Probability Distributions - Oxford University Press
Probability Distributions - Oxford University Press
Probability Distributions - Oxford University Press

You also want an ePaper? Increase the reach of your titles
YUMPU automatically turns print PDFs into web optimized ePapers that Google loves.
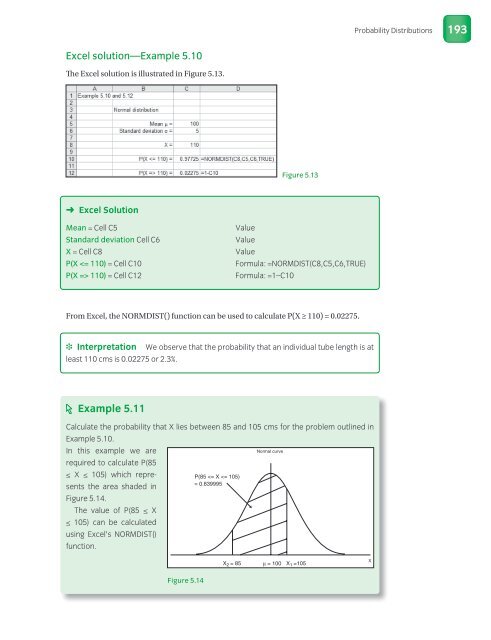
Excel solution—Example 5.10<br />
The Excel solution is ill ustrated in Figure 5.13.<br />
➜ Excel Solution<br />
Mean = Cell C5 Value<br />
Standard deviation Cell C6 Value<br />
X = Cell C8 Value<br />
P(X 110) = Cell C12 Formula: =1–C10<br />
From Excel, the NORMDIST() function can be used to calculate P(X ≥ 110) = 0.02275.<br />
❉ Interpretation We observe that the probability that an individual tube length is at<br />
least 110 cms is 0.02275 or 2.3%.<br />
Example 5.11<br />
Figure 5.13<br />
Calculate the probability that X lies between 85 and 105 cms for the problem outlined in<br />
Example 5.10.<br />
In this example we are<br />
required to calculate P(85<br />
≤ X ≤ 105) which represents<br />
the area shaded in<br />
Figure 5.14.<br />
The value of P(85 ≤ X<br />
≤ 105) can be calculated<br />
using Excel’s NORMDIST()<br />
function.<br />
Figure 5.14<br />
P(85