Probability Distributions - Oxford University Press
Probability Distributions - Oxford University Press
Probability Distributions - Oxford University Press

Create successful ePaper yourself
Turn your PDF publications into a flip-book with our unique Google optimized e-Paper software.
178 Business Statistics Using Excel<br />
Expected value The<br />
expected value of a<br />
random data variable<br />
indicates its population<br />
average value.<br />
Normal distribution The<br />
normal distribution is a<br />
symmetrical, bell-shaped<br />
curve, centred at its<br />
expected value.<br />
X<br />
» Understand the concept of a probability distribution.<br />
» Calculate using this distribution the expected value and a measure of spread.<br />
» Have an introduction to discrete distributions.<br />
» Understand when to apply the binomial distribution.<br />
» Solve simple problems using both tree diagrams and the binomial formula.<br />
» Understand when to apply the Poisson distribution.<br />
» Solve simple problems using the Poisson formula.<br />
» Have an introduction to continuous distributions.<br />
» Use the normal distribution to calculate the values of a variable that correspond to<br />
a particular probability.<br />
» Calculate as one parameter of the normal distribution if the other parameters are known.<br />
» Use the normal distribution to calculate the probability that a variable has a value<br />
between specific limits.<br />
» Understand when to apply approximations to simplify the solution process.<br />
» Have an introduction to the uniform distribution.<br />
» Have an introduction to the Student’s t distribution.<br />
» Have an introduction to the chi square distribution.<br />
» Have an introduction to the F distribution.<br />
» Solve problems using Microsoft Excel.<br />
5.1 Introduction to <strong>Probability</strong><br />
5.1.1 Basic ideas<br />
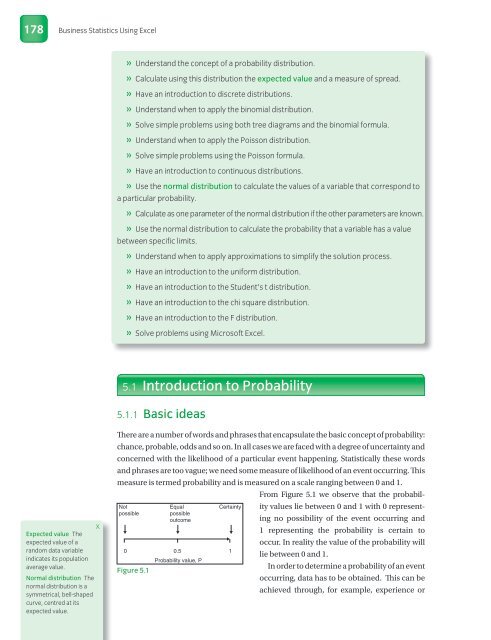
There are a number of words and phrases that encapsulate the basic concept of probability:<br />
chance, probable, odds and so on. In all cases we are faced with a degree of uncertainty and<br />
concerned with the likelihood of a particular event happening. Statistically these words<br />
and phrases are too vague; we need some measure of likelihood of an event occurring. This<br />
measure is termed probability and is measured on a scale ranging between 0 and 1.<br />
From Figure 5.1 we ob serve that the probabil<br />
Not<br />
possible<br />
Figure 5.1<br />
Equal<br />
possible<br />
outcome<br />
Certainty<br />
0 0.5<br />
<strong>Probability</strong> value, P<br />
1<br />
ity values lie between 0 and 1 with 0 representing<br />
no possibility of the event occurring and<br />
1 representing the probability is certain to<br />
occur. In reality the value of the probability will<br />
lie between 0 and 1.<br />
In order to determine a probability of an event<br />
occurring, data has to be obtained. This can be<br />
achieved through, for example, experience or