Probability Distributions - Oxford University Press
Probability Distributions - Oxford University Press
Probability Distributions - Oxford University Press

You also want an ePaper? Increase the reach of your titles
YUMPU automatically turns print PDFs into web optimized ePapers that Google loves.
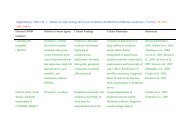
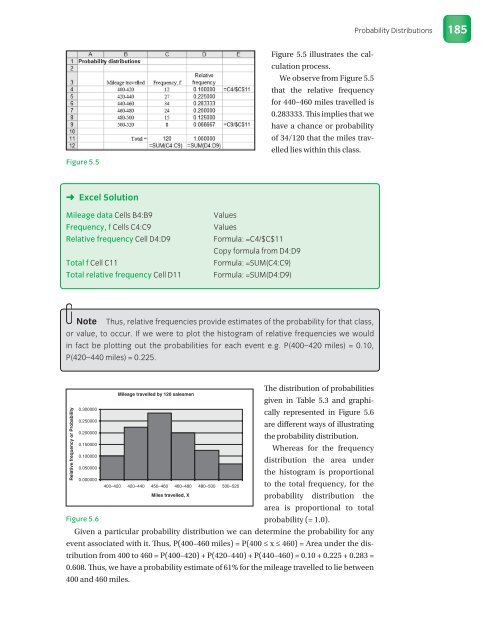
Figure 5.5<br />
➜ Excel Solution<br />
Mileage data Cells B4:B9 Values<br />
Frequency, f Cells C4:C9 Values<br />
Relative frequency Cell D4:D9 Formula: =C4/$C$11<br />
Copy formula from D4:D9<br />
Total f Cell C11 Formula: =SUM(C4:C9)<br />
Total relative frequency Cell D11 Formula: =SUM(D4:D9)<br />
Figure 5.5 illustrates the calculation<br />
process.<br />
We observe from Figure 5.5<br />
that the relative frequency<br />
for 440–460 miles travelled is<br />
0.283333. This implies that we<br />
have a chance or probability<br />
of 34/120 that the miles travelled<br />
lies within this class.<br />
Note Thus, relative frequencies provide estimates of the probability for that class,<br />
or value, to occur. If we were to plot the histogram of relative frequencies we would<br />
in fact be plotting out the probabilities for each event e.g. P(400–420 miles) = 0.10,<br />
P(420–440 miles) = 0.225.<br />
Mileage travelled by 120 salesmen<br />
The distribution of probabilities<br />
given in Table 5.3 and graphi<br />
0.300000<br />
cally represented in Figure 5.6<br />
0.250000<br />
are different ways of illustrating<br />
0.200000<br />
the probability distribution.<br />
0.150000<br />
Whereas for the frequency<br />
0.100000<br />
distribution the area under<br />
0.050000<br />
the histogram is proportional<br />
0.000000<br />
400–420 420–440 450–460 460–480 480–500 500–520 to the total frequency, for the<br />
Miles travelled, X<br />
probability distribution the<br />
Figure 5.6<br />
area is proportional to total<br />
probability (= 1.0).<br />
Given a particular probability distribution we can determine the probability for any<br />
event associated with it. Thus, P(400–460 miles) = P(400 ≤ x ≤ 460) = Area under the distribution<br />
from 400 to 460 = P(400–420) + P(420–440) + P(440–460) = 0.10 + 0.225 + 0.283 =<br />
0.608. Thus, we have a probability estimate of 61% for the mileage travelled to lie between<br />
400 and 460 miles.<br />
Relative frequency or <strong>Probability</strong><br />
<strong>Probability</strong> <strong>Distributions</strong><br />
185