Probability Distributions - Oxford University Press
Probability Distributions - Oxford University Press
Probability Distributions - Oxford University Press

You also want an ePaper? Increase the reach of your titles
YUMPU automatically turns print PDFs into web optimized ePapers that Google loves.
218 Business Statistics Using Excel<br />
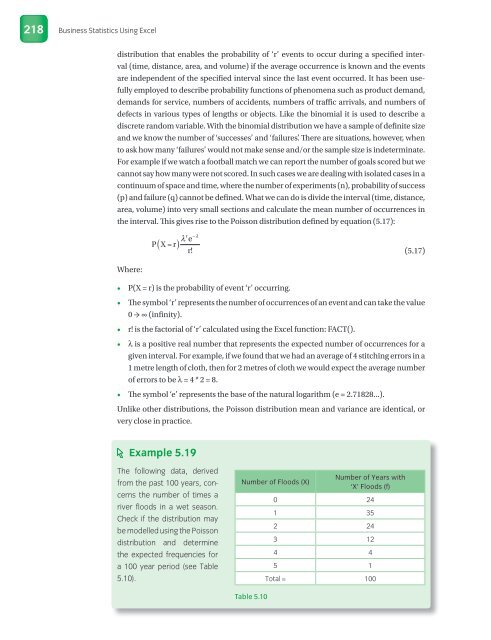
distribution that enables the probability of ‘r’ events to occur during a specifed interval<br />
(time, distance, area, and volume) if the average occurrence is known and the events<br />
are independent of the specifed interval since the last event occurred. It has been usefully<br />
employed to describe probability functions of phenomena such as product demand,<br />
demands for service, numbers of accidents, numbers of traffic arrivals, and numbers of<br />
defects in various types of lengths or objects. Like the binomial it is used to describe a<br />
discrete random variable. With the binomial distribution we have a sample of defnite size<br />
and we know the number of ‘successes’ and ‘failures’. There are situations, however, when<br />
to ask how many ‘failures’ would not make sense and/or the sample size is indeterminate.<br />
For example if we watch a football match we can report the number of goals scored but we<br />
cannot say how many were not scored. In such cases we are dealing with isolated cases in a<br />
continuum of space and time, where the number of experiments (n), probability of success<br />
(p) and failure (q) cannot be defned. What we can do is divide the interval (time, distance,<br />
area, volume) into very small sections and calculate the mean number of occurrences in<br />
the interval. This gives rise to the Poisson distribution defned by equation (5.17):<br />
Where:<br />
•<br />
•<br />
•<br />
( )<br />
P X= r<br />
r −<br />
λ e<br />
r!<br />
λ<br />
P(X = r) is the probability of event ‘r’ occurring.<br />
(5.17)<br />
The symbol ‘r’ represents the number of occurrences of an event and can take the value<br />
0 → ∞ (infnity).<br />
r! is the factorial of ‘r’ calculated using the Excel function: FACT().<br />
• λ is a positive real number that represents the expected number of occurrences for a<br />
given interval. For example, if we found that we had an average of 4 stitching errors in a<br />
1 metre length of cloth, then for 2 metres of cloth we would expect the average number<br />
of errors to be λ = 4 * 2 = 8.<br />
•<br />
The symbol ‘e’ represents the base of the natural logarithm (e = 2.71828...).<br />
Unlike other distributions, the Poisson distribution mean and variance are identical, or<br />
very close in practice.<br />
Example 5.19<br />
The following data, derived<br />
from the past 100 years, concerns<br />
the number of times a<br />
river floods in a wet season.<br />
Check if the distribution may<br />
be modelled using the Poisson<br />
distribution and determine<br />
the expected frequencies for<br />
a 100 year period (see Table<br />
5.10).<br />
Number of Floods (X)<br />
Table 5.10<br />
Number of Years with<br />
‘X’ Floods (f)<br />
0 24<br />
1 35<br />
2 24<br />
3 12<br />
4 4<br />
5 1<br />
Total = 100