2020-12 -- Real Estate of Northern Virginia Market Report - December 2020 Real Estate Trends - Michele Hudnall
2020 - End of the Year Clearance Sale!! This is a monthly report of the Northern Virginia Real Estate market regarding current market conditions with the blog, report and video conversation. The numbers come from the MLS (Bright), opinions are my own. This represents the market up to 5 Bedrooms keeping the numbers sub $1.5M and out of the luxury, custom market.
2020 - End of the Year Clearance Sale!!
This is a monthly report of the Northern Virginia Real Estate market regarding current market conditions with the blog, report and video conversation.
The numbers come from the MLS (Bright), opinions are my own. This represents the market up to 5 Bedrooms keeping the numbers sub $1.5M and out of the luxury, custom market.
- TAGS
- fauquier-county-real-estate
- prince-william-real-estate
- loudoun-county-real-estate
- fairfax-county-real-estate
- arlington-real-estate
- alexandria-real-estate
- fairfax-real-estate
- falls-church-real-estate
- manassas-real-estate
- best-northern-virginia-realtor
- your-northern-virginia-realtor
- northern-virginia-home-trends
- northern-virginia-home-prices
- real-estate-of-nva
- nva-real-estate-trends
- nova-real-estate-trends
- northern-virginia-real-estate
- michele-hudnall
- realestateofnva

Create successful ePaper yourself
Turn your PDF publications into a flip-book with our unique Google optimized e-Paper software.
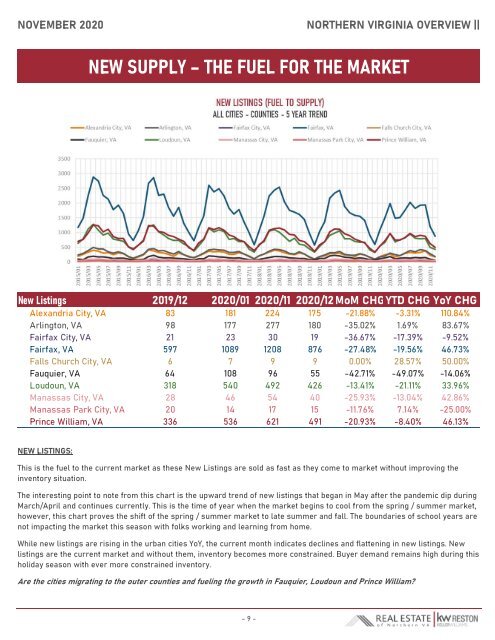
NOVEMBER <strong>2020</strong> NORTHERN VIRGINIA OVERVIEW ||<br />
NEW SUPPLY – THE FUEL FOR THE MARKET<br />
New Listings 2019/<strong>12</strong> <strong>2020</strong>/01 <strong>2020</strong>/11 <strong>2020</strong>/<strong>12</strong>MoM CHGYTD CHG YoY CHG<br />
Alexandria City, VA 83 181 224 175 -21.88% -3.31% 110.84%<br />
Arlington, VA 98 177 277 180 -35.02% 1.69% 83.67%<br />
Fairfax City, VA 21 23 30 19 -36.67% -17.39% -9.52%<br />
Fairfax, VA 597 1089 <strong>12</strong>08 876 -27.48% -19.56% 46.73%<br />
Falls Church City, VA 6 7 9 9 0.00% 28.57% 50.00%<br />
Fauquier, VA 64 108 96 55 -42.71% -49.07% -14.06%<br />
Loudoun, VA 318 540 492 426 -13.41% -21.11% 33.96%<br />
Manassas City, VA 28 46 54 40 -25.93% -13.04% 42.86%<br />
Manassas Park City, VA 20 14 17 15 -11.76% 7.14% -25.00%<br />
Prince William, VA 336 536 621 491 -20.93% -8.40% 46.13%<br />
NEW LISTINGS:<br />
This is the fuel to the current market as these New Listings are sold as fast as they come to market without improving the<br />
inventory situation.<br />
The interesting point to note from this chart is the upward trend <strong>of</strong> new listings that began in May after the pandemic dip during<br />
March/April and continues currently. This is the time <strong>of</strong> year when the market begins to cool from the spring / summer market,<br />
however, this chart proves the shift <strong>of</strong> the spring / summer market to late summer and fall. The boundaries <strong>of</strong> school years are<br />
not impacting the market this season with folks working and learning from home.<br />
While new listings are rising in the urban cities YoY, the current month indicates declines and flattening in new listings. New<br />
listings are the current market and without them, inventory becomes more constrained. Buyer demand remains high during this<br />
holiday season with ever more constrained inventory.<br />
Are the cities migrating to the outer counties and fueling the growth in Fauquier, Loudoun and Prince William?<br />
- 9 -