2020-12 -- Real Estate of Northern Virginia Market Report - December 2020 Real Estate Trends - Michele Hudnall
2020 - End of the Year Clearance Sale!! This is a monthly report of the Northern Virginia Real Estate market regarding current market conditions with the blog, report and video conversation. The numbers come from the MLS (Bright), opinions are my own. This represents the market up to 5 Bedrooms keeping the numbers sub $1.5M and out of the luxury, custom market.
2020 - End of the Year Clearance Sale!!
This is a monthly report of the Northern Virginia Real Estate market regarding current market conditions with the blog, report and video conversation.
The numbers come from the MLS (Bright), opinions are my own. This represents the market up to 5 Bedrooms keeping the numbers sub $1.5M and out of the luxury, custom market.
- TAGS
- fauquier-county-real-estate
- prince-william-real-estate
- loudoun-county-real-estate
- fairfax-county-real-estate
- arlington-real-estate
- alexandria-real-estate
- fairfax-real-estate
- falls-church-real-estate
- manassas-real-estate
- best-northern-virginia-realtor
- your-northern-virginia-realtor
- northern-virginia-home-trends
- northern-virginia-home-prices
- real-estate-of-nva
- nva-real-estate-trends
- nova-real-estate-trends
- northern-virginia-real-estate
- michele-hudnall
- realestateofnva

Create successful ePaper yourself
Turn your PDF publications into a flip-book with our unique Google optimized e-Paper software.
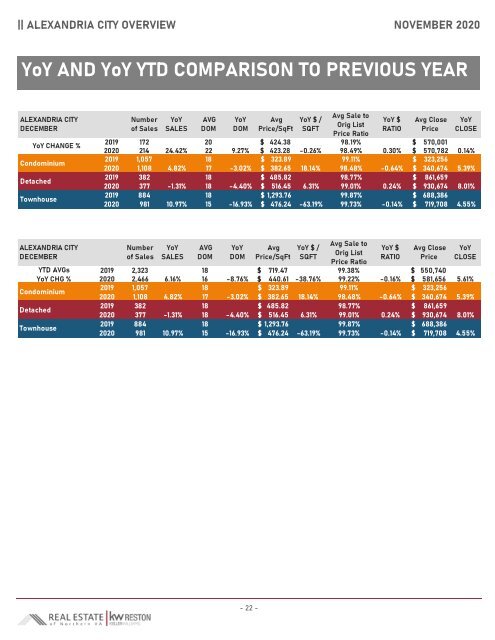
|| ALEXANDRIA CITY OVERVIEW NOVEMBER <strong>2020</strong><br />
YoY AND YoY YTD COMPARISON TO PREVIOUS YEAR<br />
ALEXANDRIA CITY<br />
DECEMBER<br />
YoY CHANGE %<br />
Condominium<br />
Detached<br />
Townhouse<br />
Number<br />
<strong>of</strong> Sales<br />
YoY<br />
SALES<br />
AVG<br />
DOM<br />
YoY<br />
DOM<br />
Avg<br />
Price/SqFt<br />
YoY $ /<br />
SQFT<br />
Avg Sale to<br />
Orig List<br />
Price Ratio<br />
YoY $<br />
RATIO<br />
Avg Close<br />
Price<br />
YoY<br />
CLOSE<br />
2019 172 20 $ 424.38 98.19% $ 570,001<br />
<strong>2020</strong> 214 24.42% 22 9.27% $ 423.28 -0.26% 98.49% 0.30% $ 570,782 0.14%<br />
2019 1,057 18 $ 323.89<br />
99.11% $ 323,256<br />
<strong>2020</strong> 1,108 4.82% 17 -3.02% $ 382.65 18.14% 98.48% -0.64% $ 340,674 5.39%<br />
2019 382 18 $ 485.82<br />
98.77% $ 861,659<br />
<strong>2020</strong> 377 -1.31% 18 -4.40% $ 516.45 6.31% 99.01% 0.24% $ 930,674 8.01%<br />
2019 884 18 $ 1,293.76<br />
99.87% $ 688,386<br />
<strong>2020</strong> 981 10.97% 15 -16.93% $ 476.24 -63.19% 99.73% -0.14% $ 719,708 4.55%<br />
ALEXANDRIA CITY<br />
DECEMBER<br />
YTD AVGs<br />
YoY CHG %<br />
Condominium<br />
Detached<br />
Townhouse<br />
Number<br />
<strong>of</strong> Sales<br />
YoY<br />
SALES<br />
AVG<br />
DOM<br />
YoY<br />
DOM<br />
Avg<br />
Price/SqFt<br />
YoY $ /<br />
SQFT<br />
Avg Sale to<br />
Orig List<br />
Price Ratio<br />
YoY $<br />
RATIO<br />
Avg Close<br />
Price<br />
YoY<br />
CLOSE<br />
2019 2,323 18 $ 719.47 99.38% $ 550,740<br />
<strong>2020</strong> 2,466 6.16% 16 -8.76% $ 440.61 -38.76% 99.22% -0.16% $ 581,656 5.61%<br />
2019 1,057 18 $ 323.89<br />
99.11% $ 323,256<br />
<strong>2020</strong> 1,108 4.82% 17 -3.02% $ 382.65 18.14% 98.48% -0.64% $ 340,674 5.39%<br />
2019 382 18 $ 485.82<br />
98.77% $ 861,659<br />
<strong>2020</strong> 377 -1.31% 18 -4.40% $ 516.45 6.31% 99.01% 0.24% $ 930,674 8.01%<br />
2019 884 18 $ 1,293.76<br />
99.87% $ 688,386<br />
<strong>2020</strong> 981 10.97% 15 -16.93% $ 476.24 -63.19% 99.73% -0.14% $ 719,708 4.55%<br />
- 22 -