The Camogie Association Coaching Articles 2nd edition
Coaching Articles for coaches from coaches.
Coaching Articles for coaches from coaches.
- No tags were found...

Create successful ePaper yourself
Turn your PDF publications into a flip-book with our unique Google optimized e-Paper software.
30<br />
By<br />
Tomas Mount<br />
PERFORMANCE ANALYSIS<br />
& COACHING<br />
This article is on the process of creating a hand<br />
notation template and what tools to use. Some<br />
people reading this article will have used hand<br />
notation templates before while coaching and<br />
working with teams, they are a great way to<br />
help coaches make informed decisions in game<br />
and help in planning on what a team needs to<br />
improve.<br />
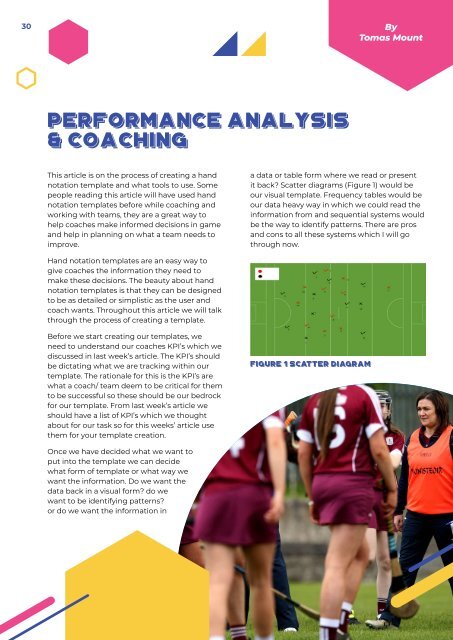
a data or table form where we read or present<br />
it back? Scatter diagrams (Figure 1) would be<br />
our visual template. Frequency tables would be<br />
our data heavy way in which we could read the<br />
information from and sequential systems would<br />
be the way to identify patterns. <strong>The</strong>re are pros<br />
and cons to all these systems which I will go<br />
through now.<br />
Hand notation templates are an easy way to<br />
give coaches the information they need to<br />
make these decisions. <strong>The</strong> beauty about hand<br />
notation templates is that they can be designed<br />
to be as detailed or simplistic as the user and<br />
coach wants. Throughout this article we will talk<br />
through the process of creating a template.<br />
Before we start creating our templates, we<br />
need to understand our coaches KPI’s which we<br />
discussed in last week’s article. <strong>The</strong> KPI’s should<br />
be dictating what we are tracking within our<br />
template. <strong>The</strong> rationale for this is the KPI’s are<br />
what a coach/ team deem to be critical for them<br />
to be successful so these should be our bedrock<br />
for our template. From last week’s article we<br />
should have a list of KPI’s which we thought<br />
about for our task so for this weeks’ article use<br />
them for your template creation.<br />
Figure 1 Scatter Diagram<br />
Once we have decided what we want to<br />
put into the template we can decide<br />
what form of template or what way we<br />
want the information. Do we want the<br />
data back in a visual form? do we<br />
want to be identifying patterns?<br />
or do we want the information in