2011 Arizona State Rail Plan - Arizona Department of Transportation
2011 Arizona State Rail Plan - Arizona Department of Transportation
2011 Arizona State Rail Plan - Arizona Department of Transportation

Create successful ePaper yourself
Turn your PDF publications into a flip-book with our unique Google optimized e-Paper software.
<strong>Arizona</strong> <strong>State</strong> <strong>Rail</strong> <strong>Plan</strong><br />
2050 Passenger Demand Forecasts<br />
Passenger rail forecasts were developed for both intercity<br />
rail service and commuter rail service on the following<br />
segments:<br />
• Intercity rail<br />
– Phoenix–Tucson<br />
– Phoenix–Yuma<br />
– Tucson–Nogales<br />
– Phoenix– Flagstaff–Winslow<br />
– Phoenix–Los Angeles<br />
– Phoenix–San Diego<br />
– Phoenix–Las Vegas<br />
• Commuter rail<br />
– Metropolitan Phoenix<br />
(Maricopa Association <strong>of</strong><br />
Governments [MAG] region,<br />
with possible Pinal County<br />
extension)<br />
– Metropolitan Tucson (Pima<br />
Association <strong>of</strong> Governments<br />
[PAG] region)<br />
– Metropolitan Flagstaff<br />
Based on demand<br />
forecasts, the<br />
Phoenix-Los Angeles<br />
and Phoenix-Tucson<br />
corridors <strong>of</strong>fer the<br />
highest ridership<br />
potential<br />
Intercity Passenger <strong>Rail</strong><br />
2050 Intercity <strong>Rail</strong> Passenger Estimates<br />
One <strong>of</strong> the key determinants <strong>of</strong> ridership is the population<br />
served by a rail corridor. For this study, the potential<br />
market was defined by population within 25 miles <strong>of</strong><br />
potential rail stations along a corridor. Past experience in<br />
providing ridership and revenue support to Amtrak and<br />
in completing other intercity rail studies has shown this<br />
to be a good measure <strong>of</strong> market size, and thus a predictor<br />
<strong>of</strong> rail ridership potential.<br />
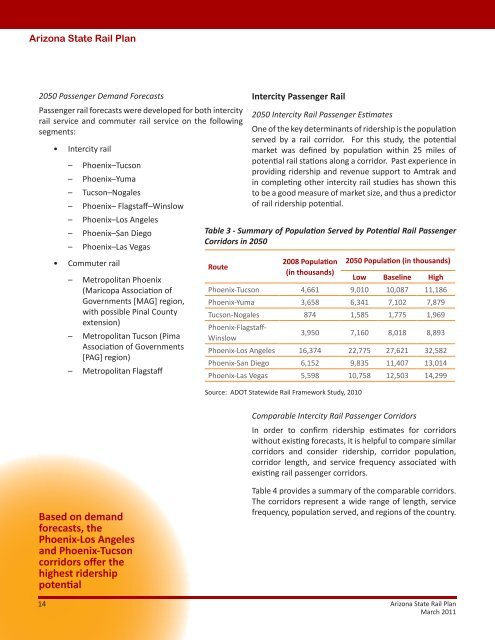
Table 3 - Summary <strong>of</strong> Population Served by Potential <strong>Rail</strong> Passenger<br />
Corridors in 2050<br />
Route<br />
2008 Population<br />
(in thousands)<br />
2050 Population (in thousands)<br />
Low Baseline High<br />
Phoenix-Tucson 4,661 9,010 10,087 11,186<br />
Phoenix-Yuma 3,658 6,341 7,102 7,879<br />
Tucson-Nogales 874 1,585 1,775 1,969<br />
Phoenix-Flagstaff-<br />
Winslow<br />
3,950 7,160 8,018 8,893<br />
Phoenix-Los Angeles 16,374 22,775 27,621 32,582<br />
Phoenix-San Diego 6,152 9,835 11,407 13,014<br />
Phoenix-Las Vegas 5,598 10,758 12,503 14,299<br />
Source: ADOT <strong>State</strong>wide <strong>Rail</strong> Framework Study, 2010<br />
Comparable Intercity <strong>Rail</strong> Passenger Corridors<br />
In order to confirm ridership estimates for corridors<br />
without existing forecasts, it is helpful to compare similar<br />
corridors and consider ridership, corridor population,<br />
corridor length, and service frequency associated with<br />
existing rail passenger corridors.<br />
Table 4 provides a summary <strong>of</strong> the comparable corridors.<br />
The corridors represent a wide range <strong>of</strong> length, service<br />
frequency, population served, and regions <strong>of</strong> the country.<br />
14 <strong>Arizona</strong> <strong>State</strong> <strong>Rail</strong> <strong>Plan</strong><br />
March <strong>2011</strong>