2011 Arizona State Rail Plan - Arizona Department of Transportation
2011 Arizona State Rail Plan - Arizona Department of Transportation
2011 Arizona State Rail Plan - Arizona Department of Transportation

You also want an ePaper? Increase the reach of your titles
YUMPU automatically turns print PDFs into web optimized ePapers that Google loves.
<strong>Arizona</strong> <strong>State</strong> <strong>Rail</strong> <strong>Plan</strong><br />
Based on the analysis, the Phoenix–Los Angeles corridor<br />
<strong>of</strong>fers the highest potential ridership, as it serves the<br />
largest population <strong>of</strong> all the corridors. While the Phoenix–<br />
San Diego estimates may appear low, they represent the<br />
additional incremental ridership over the Phoenix–Yuma<br />
corridor, which is part <strong>of</strong> the Phoenix-San Diego route.<br />
Taking both estimates into account brings the Phoenix–<br />
Yuma-San Diego potential annual ridership to between<br />
750,000 and 1.4 million.<br />
The ridership estimates in Table 5 represent the impact<br />
<strong>of</strong> the corridors individually. If service were implemented<br />
in more than one <strong>of</strong> these corridors, with connections<br />
between them, there would be potential for higher<br />
system-wide ridership.<br />
Commuter <strong>Rail</strong><br />
Three potential commuter rail corridors were identified:<br />
Metro Phoenix, Metro Tucson, and Metro Flagstaff.<br />
Ridership forecasts are available for all these services<br />
except Flagstaff. This section provides a high-level<br />
overview <strong>of</strong> the service characteristics assumed, where<br />
available, for each system. Outside Phoenix few detailed<br />
studies have been conducted.<br />
• Metropolitan Phoenix Commuter <strong>Rail</strong><br />
– Source: 2010 MAG Commuter <strong>Rail</strong> System<br />
Study<br />
– Corridors: Four potential corridors: BNSF<br />
Grand Avenue Line, UPRR Tempe/West<br />
Chandler Branch, UPRR Southeast Mainline<br />
and UPRR Yuma West Line<br />
– 2030 Service Assumptions: 30-minute peak<br />
headway, 60-minute <strong>of</strong>f-peak headway<br />
• Metropolitan Tucson Commuter <strong>Rail</strong><br />
– Source: 2007 <strong>Arizona</strong> Public <strong>Transportation</strong><br />
Program Response to Executive Order<br />
#2007-02 (#2008-02)<br />
– Corridors: None specified<br />
– 2030 Service Assumptions: 15+ one-way<br />
trips per day<br />
• Metropolitan Flagstaff Commuter <strong>Rail</strong><br />
– Source: ADOT <strong>State</strong>wide <strong>Rail</strong> Framework<br />
Study, 2010<br />
– Corridors: Williams–Flagstaff-Winslow<br />
– 2030 Service Assumptions: 10-15 one-way<br />
trips per day<br />
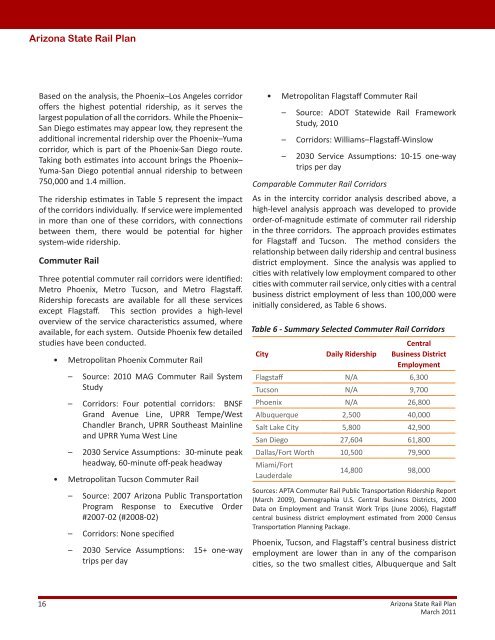
Comparable Commuter <strong>Rail</strong> Corridors<br />
As in the intercity corridor analysis described above, a<br />
high-level analysis approach was developed to provide<br />
order-<strong>of</strong>-magnitude estimate <strong>of</strong> commuter rail ridership<br />
in the three corridors. The approach provides estimates<br />
for Flagstaff and Tucson. The method considers the<br />
relationship between daily ridership and central business<br />
district employment. Since the analysis was applied to<br />
cities with relatively low employment compared to other<br />
cities with commuter rail service, only cities with a central<br />
business district employment <strong>of</strong> less than 100,000 were<br />
initially considered, as Table 6 shows.<br />
Table 6 - Summary Selected Commuter <strong>Rail</strong> Corridors<br />
City Daily Ridership<br />
Central<br />
Business District<br />
Employment<br />
Flagstaff N/A 6,300<br />
Tucson N/A 9,700<br />
Phoenix N/A 26,800<br />
Albuquerque 2,500 40,000<br />
Salt Lake City 5,800 42,900<br />
San Diego 27,604 61,800<br />
Dallas/Fort Worth 10,500 79,900<br />
Miami/Fort<br />
Lauderdale<br />
14,800 98,000<br />
Sources: APTA Commuter <strong>Rail</strong> Public <strong>Transportation</strong> Ridership Report<br />
(March 2009), Demographia U.S. Central Business Districts, 2000<br />
Data on Employment and Transit Work Trips (June 2006), Flagstaff<br />
central business district employment estimated from 2000 Census<br />
<strong>Transportation</strong> <strong>Plan</strong>ning Package.<br />
Phoenix, Tucson, and Flagstaff’s central business district<br />
employment are lower than in any <strong>of</strong> the comparison<br />
cities, so the two smallest cities, Albuquerque and Salt<br />
16 <strong>Arizona</strong> <strong>State</strong> <strong>Rail</strong> <strong>Plan</strong><br />
March <strong>2011</strong>