

Lies, Damned Lies, or Statistics- How to Tell the Truth with Statistics, 2017a
Lies, Damned Lies, or Statistics- How to Tell the Truth with Statistics, 2017a
Lies, Damned Lies, or Statistics- How to Tell the Truth with Statistics, 2017a

Create successful ePaper yourself
Turn your PDF publications into a flip-book with our unique Google optimized e-Paper software.
28 1. ONE-VARIABLE STATISTICS: BASICS<br />
• an axis is drawn, labelled <strong>with</strong> <strong>the</strong> variable of <strong>the</strong> study<br />
• tick marks and numbers are put on <strong>the</strong> axis, enough <strong>to</strong> allow <strong>the</strong> following visual<br />
features <strong>to</strong> be located numerically<br />
• a rectangle (<strong>the</strong> box) is drawn parallel <strong>to</strong> <strong>the</strong> axis, stretching from values Q 1 <strong>to</strong> Q 3<br />
on <strong>the</strong> axis<br />
• an addition line is drawn, parallel <strong>to</strong> <strong>the</strong> sides of <strong>the</strong> box at locations x min and<br />
x max , at <strong>the</strong> axis co<strong>or</strong>dinate of <strong>the</strong> median of <strong>the</strong> data<br />
• lines are drawn parallel <strong>to</strong> <strong>the</strong> axis from <strong>the</strong> middle of sides of <strong>the</strong> box at <strong>the</strong><br />
locations x min and x max out <strong>to</strong> <strong>the</strong> axis co<strong>or</strong>dinates x min and x max ,where<strong>the</strong>se<br />
whiskers terminate in “T”s.<br />
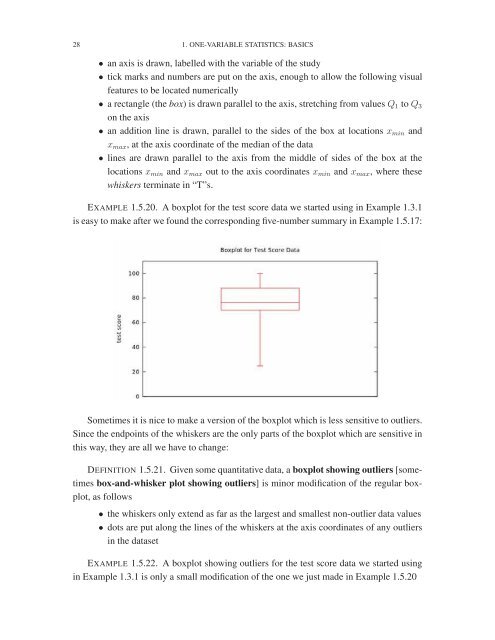
EXAMPLE 1.5.20. A boxplot f<strong>or</strong> <strong>the</strong> test sc<strong>or</strong>e data we started using in Example 1.3.1<br />
is easy <strong>to</strong> make after we found <strong>the</strong> c<strong>or</strong>responding five-number summary in Example 1.5.17:<br />
Sometimes it is nice <strong>to</strong> make a version of <strong>the</strong> boxplot which is less sensitive <strong>to</strong> outliers.<br />
Since <strong>the</strong> endpoints of <strong>the</strong> whiskers are <strong>the</strong> only parts of <strong>the</strong> boxplot which are sensitive in<br />
this way, <strong>the</strong>y are all we have <strong>to</strong> change:<br />
DEFINITION 1.5.21. Given some quantitative data, a boxplot showing outliers [sometimes<br />
box-and-whisker plot showing outliers] is min<strong>or</strong> modification of <strong>the</strong> regular boxplot,<br />
as follows<br />
• <strong>the</strong> whiskers only extend as far as <strong>the</strong> largest and smallest non-outlier data values<br />
• dots are put along <strong>the</strong> lines of <strong>the</strong> whiskers at <strong>the</strong> axis co<strong>or</strong>dinates of any outliers<br />
in <strong>the</strong> dataset<br />
EXAMPLE 1.5.22. A boxplot showing outliers f<strong>or</strong> <strong>the</strong> test sc<strong>or</strong>e data we started using<br />
in Example 1.3.1 is only a small modification of <strong>the</strong> one we just made in Example 1.5.20


