

Lies, Damned Lies, or Statistics- How to Tell the Truth with Statistics, 2017a
Lies, Damned Lies, or Statistics- How to Tell the Truth with Statistics, 2017a
Lies, Damned Lies, or Statistics- How to Tell the Truth with Statistics, 2017a

You also want an ePaper? Increase the reach of your titles
YUMPU automatically turns print PDFs into web optimized ePapers that Google loves.
32 1. ONE-VARIABLE STATISTICS: BASICS<br />
EXERCISE 1.9. What must be true about a dataset if its range is 0? Give <strong>the</strong> most<br />
interesting example of a dataset <strong>with</strong> range of 0 and <strong>the</strong> property you just described that<br />
you can think of.<br />
What must be true about a dataset if its IQR is 0? Give <strong>the</strong> most interesting example<br />
of a dataset <strong>with</strong> IQR of 0 and <strong>the</strong> property you just described that you can think of.<br />
What must be true about a dataset if its standard deviation is 0? Give <strong>the</strong> most interesting<br />
example of a dataset <strong>with</strong> standard deviation of 0 and <strong>the</strong> property you just described<br />
that you can think of.<br />
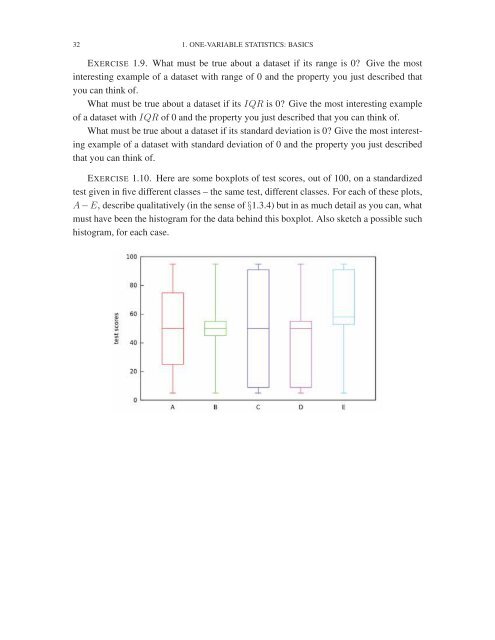
EXERCISE 1.10. Here are some boxplots of test sc<strong>or</strong>es, out of 100, on a standardized<br />
test given in five different classes – <strong>the</strong> same test, different classes. F<strong>or</strong> each of <strong>the</strong>se plots,<br />
A − E, describe qualitatively (in <strong>the</strong> sense of §1.3.4) but in as much detail as you can, what<br />
must have been <strong>the</strong> his<strong>to</strong>gram f<strong>or</strong> <strong>the</strong> data behind this boxplot. Also sketch a possible such<br />
his<strong>to</strong>gram, f<strong>or</strong> each case.


