Santa Clara County Assessor's Annual Report
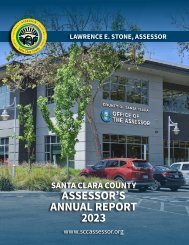
Each year the Santa Clara County Assessor’s Office prepares an Annual Report available in hard copy and electronic versions. The report offers comprehensive statistical analysis of the local assessment roll, including all real and business property, legal exemptions, and assessment appeals. Assessment information is provided by property type, city, and school district. The Assessor’s Annual Report is an important source of information for public finance officials, real estate professionals, tax experts, academics, as well as business, government, and community leaders seeking insights into real estate trends in Santa Clara County.
Each year the Santa Clara County Assessor’s Office prepares an Annual Report available in hard copy and electronic versions. The report offers comprehensive statistical analysis of the local assessment roll, including all real and business property, legal exemptions, and assessment appeals. Assessment information is provided by property type, city, and school district.
The Assessor’s Annual Report is an important source of information for public finance officials, real estate professionals, tax experts, academics, as well as business, government, and community leaders seeking insights into real estate trends in Santa Clara County.

You also want an ePaper? Increase the reach of your titles
YUMPU automatically turns print PDFs into web optimized ePapers that Google loves.
Assessment Growth by City
Palo Alto 3.85%
Los Altos Hills 4.71%
Cupertino 3.55%
Los Altos 4.73%
While assessment roll growth was
strong in most communities, Sunnyvale,
Mountain View grew faster than
the County average—a direct result
of major commercial and industrial
construction projects by Google, Jay
Paul, and Nvidia.
Mountain View 8.06%
Saratoga 4.00%
Sunnyvale 5.02%
Santa Clara 4.28%
Milpitas 4.04%
San Jose 4.28%
Monte Sereno 5.63%
Unincorporated 4.88%
Campbell 4.78%
Los Gatos 4.33%
Gilroy 4.45%
Morgan Hill 5.75%
Real Property Distribution By City
City Name Total Value Exemptions* Net Total Parcel Count
Campbell $12,159,546,933 $214,712,647 $11,944,834,286 12,205
Cupertino $26,198,594,820 $135,857,482 $26,062,737,338 16,593
Gilroy $10,230,233,872 $385,260,050 $9,844,973,822 14,629
Los Altos $19,120,639,741 $431,088,448 $18,689,551,293 11,116
Los Altos Hills $9,356,272,442 $34,718,453 $9,321,553,989 3,208
Los Gatos $15,573,275,146 $339,464,603 $15,233,810,543 11,038
Milpitas $20,333,695,268 $321,015,794 $20,012,679,474 19,899
Monte Sereno $2,566,132,966 $897,205 $2,565,235,761 1,291
Morgan Hill $11,367,672,410 $337,357,794 $11,030,314,616 13,121
Mountain View $35,630,852,213 $645,676,674 $34,985,175,539 19,838
Palo Alto $48,782,114,409 $7,275,976,470 $41,506,137,939 20,677
San Jose $209,809,537,798 $6,134,719,210 $203,674,818,588 240,744
Santa Clara $44,443,249,102 $2,290,912,103 $42,152,336,999 29,669
Saratoga $17,722,605,307 $230,766,761 $17,491,838,546 11,141
Sunnyvale $52,740,655,762 $617,766,429 $52,122,889,333 33,088
Unincorporated $27,746,899,214 $7,881,542,250 $19,865,356,964 25,431
Total $563,781,977,403 $27,277,732,373 $536,504,245,030 483,688
* See Pg. 15 for more information on exemptions
Real Property Distribution of Value* by Type
10
Net Assessment Roll Growth By City
City Secured City Secured RPTTF* Unsecured City
Unsecured
Growth Percent
Net Roll
RPTTF*
% of Roll
Campbell $10,611,263,634 $1,397,673,051 $256,559,762 $106,704,329 $12,372,200,776 4.78% 2.14%
Cupertino $27,083,468,890 $1,724,247,088 $28,807,715,978 3.55% 4.99%
Gilroy $9,968,898,669 $296,112,343 $10,265,011,012 4.45% 1.78%
Los Altos $18,702,154,929 $123,403,929 $18,825,558,858 4.73% 3.26%
Los Altos Hills $9,322,116,432 $3,447,749 $9,325,564,181 4.71% 1.62%
Los Gatos $13,362,944,816 $1,891,297,788 $248,375,152 $49,064,944 $15,551,682,700 4.33% 2.70%
Milpitas $10,946,282,678 $9,481,026,383 $835,349,447 $1,082,385,691 $22,345,044,199 4.04% 3.87%
Monte Sereno $2,565,235,761 $673,806 $2,565,909,567 5.63% 0.44%
Morgan Hill $7,398,469,690 $3,721,227,859 $203,198,815 $157,543,302 $11,480,439,666 5.75% 1.99%
Mountain View $30,537,743,197 $5,021,064,516 $1,385,997,245 $636,928,758 $37,581,733,716 8.06% 6.51%
Palo Alto $41,743,865,568 $2,283,406,108 $44,027,271,676 3.85% 7.63%
San Jose $172,895,219,493 $33,390,149,147 $4,842,807,465 $4,732,662,301 $215,860,838,406 4.28% 37.42%
Santa Clara $39,620,417,482 $4,636,364,116 $6,747,206,002 $1,259,871,212 $52,263,858,812 4.28% 9.06%
Saratoga $17,496,991,236 $46,610,292 $17,543,601,528 4.00% 3.04%
Sunnyvale $51,902,116,438 $2,006,530,558 $3,543,324,755 $131,110,306 $57,583,082,057 5.02% 9.98%
Unincorporated $20,109,075,689 $2,243 $395,669,291 $20,504,747,223 4.88% 3.55%
Total $484,266,264,602 $61,545,335,661 $22,936,389,249 $8,156,270,843 $576,904,260,355 4.60% 100%
*Redevelopment Property Tax Trust Fund
Property Type
Santa Clara County Assessor’s Annual Report 2021-22 Santa Clara County Assessor’s Annual Report 2021-22
Property Value
Value
Growth %
Percent of
Total Value
Parcel
Count
Single Family Detached $287,825,426,748 5% 54% 338,149 70%
Condominiums $55,838,663,581 5% 10% 91,483 19%
Office $52,546,572,694 8% 10% 5,294 1%
Apartments 5+ Units $41,911,245,022 5% 8% 5,920 1%
R&D Industrial $23,192,735,955 7% 4% 790 0%
Other Industrial Non-Manufacturing $17,079,856,329 7% 3% 3,431 1%
Specialty Retail and Hotels $16,271,319,622 4% 3% 5,700 1%
Single Family 2-4 Units $10,421,521,235 4% 2% 15,036 3%
Major Shopping Centers $9,445,871,522 0% 2% 864 0%
Other Urban $7,455,569,139 -3% 1% 6,715 1%
Public & Quasi-Public $6,092,869,139 19% 1% 2,571 1%
Other Industrial Manufacturing $3,695,268,310 -3% 1% 2,066 0%
Agricultural $2,442,610,893 4% 0% 5,346 1%
Electronics & Machinery Manufacturing $2,197,502,746 -10% 0% 171 0%
Residential Misc. $87,212,095 19% 0% 152 0%
Parcel
%
Total $536,504,245,030 5.0% 100% 483,688 100%
*Net of non-reimbursable exemptions; does not include mobile homes; includes possessory
interest assessments which, until 2014-15, were on the unsecured roll
11