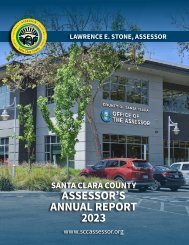
Santa Clara County Assessor's Annual Report
Each year the Santa Clara County Assessor’s Office prepares an Annual Report available in hard copy and electronic versions. The report offers comprehensive statistical analysis of the local assessment roll, including all real and business property, legal exemptions, and assessment appeals. Assessment information is provided by property type, city, and school district. The Assessor’s Annual Report is an important source of information for public finance officials, real estate professionals, tax experts, academics, as well as business, government, and community leaders seeking insights into real estate trends in Santa Clara County.
Each year the Santa Clara County Assessor’s Office prepares an Annual Report available in hard copy and electronic versions. The report offers comprehensive statistical analysis of the local assessment roll, including all real and business property, legal exemptions, and assessment appeals. Assessment information is provided by property type, city, and school district.
The Assessor’s Annual Report is an important source of information for public finance officials, real estate professionals, tax experts, academics, as well as business, government, and community leaders seeking insights into real estate trends in Santa Clara County.

Create successful ePaper yourself
Turn your PDF publications into a flip-book with our unique Google optimized e-Paper software.
CONTENTS
Message from Lawrence E. Stone......................... 3
How Tax Bills are Calculated............................... 6
The Assessment Roll............................................ 7
Supplemental Assessments................................... 8
Roll Comparison of Counties................................ 9
Assessment Information by City......................... 10
Proposition 13.................................................... 12
Historical Trends of Assessed Values.................. 14
Exemptions......................................................... 15
New Construction............................................... 16
Changes in Ownership & Transfers.................... 18
Explanation of Terms..............................................................34
Santa Clara County Assessor’s Mission Statement
The Santa Clara County Assessor’s Office Mission is to produce an annual assessment roll, including all assessable
property, in accordance with legal mandates in a timely, accurate, and efficient manner; and provide current assessment
related information to the public, and to governmental agencies, in a timely and responsive way.
Responsibility of the Assessor’s Office
The Assessor has the responsibility to locate all taxable property in the County, identify ownership, establish a value for
all property subject to local property taxation, list the value of all property on the assessment roll, and apply all legal
exemptions. The Santa Clara County Assessor does not compute property tax bills, collect property taxes, establish
property Artwork tax by laws, Lila Gemellos establish rules by which property is assessed, or set property tax rates. The assessments allow the
County of Santa Clara to collect and allocate property tax revenue, which supports essential public services provided
by the County, local schools, cities, and special districts.
Artwork by Lila Gemellos
What is Proposition 8?............................................................19
Temporary Declines in Assessed Value...................................20
Business Personal Property.....................................................21
Top 25 Companies..................................................................22
Assessment Appeals...............................................................23
Customer Service/Performance Counts...................................25
Property Assessment Monthly Calendar..................................27
Org. Overview of the Assessor’s Office..................................28
The Assessor’s Team..............................................................29
Assessed Value by City and Property Type.............................30
Assessed Value by School District and Property Type............31
Cover Images, clockwise from the top. Impressive new construction projects that are planned or underway in Santa Clara County: Jay Paul
CityView, six interconnected 19-story office buildings. Urban Catalyst, Icon/Echo Towers, 21-story office, and 27-story residential towers.
KT Urban Woz Way, two 20-story office towers. Urban Community/Westbank Park Habitat, 20-story office tower.
A Message from Lawrence E. Stone
Looking back over the past year, coping with the
COVID-19 pandemic and the shelter-in-place order that
suddenly presented serious challenges, not only to public
health, but to the Silicon Valley economy, I have never
been more impressed by the resilience, adaptation and
success achieved by our Santa Clara County community,
and the Assessor’s Office, in particular.
At the beginning of the year, a contentious presidential
election was on the horizon, COVID-19 deaths were skyrocketing,
and the early development of a vaccine looked
promising, but was still uncertain. It was only natural
to be apprehensive, even despondent, about the Silicon
Valley economy and real estate property values. In the
Assessor’s Annual Report last year, I predicted significant
declines in the market value of real estate that would
inevitably require significant assessment reductions.
How would businesses, particularly hospitality and retail,
adapt to restrictive and continually changing public health
orders that, by design, kept customers away from businesses?
How would local businesses, ordered to close,
survive? What impact would employees sheltered in
place or working remotely have on the local real estate
economy? Would corporate and industrial investments in
local real estate markets remain, or would values impacted
by remote work trends create a sell off of property,
leading to an exodus of people and companies from Santa
Clara County? The outlook was dire.
Instead, our community and Silicon Valley’s private and
public sector leadership responded decisively, adapting
quickly to working remotely and social distancing
requirements. Technological innovations, such as Zoom,
enabled us to engineer working relationships remotely.
Restaurants and their patrons embraced open-air dining
and home delivery services. Though sometimes difficult,
most of us managed to stay safe and conduct business,
including essential government services. The Office of
the Assessor was available for business throughout the
COVID-19 year.
As a result, the 2021/22 Santa Clara County assessment
roll, including all real and business property, grew by
$25.4 billion to a record $576.9 billion, a 4.6 percent
increase over the prior year. The annual assessment roll
reflects the total net assessed value of all real and business
property in Santa Clara County as of January 1, 2021.
Looking forward to the next lien date, January 1, 2022,
the outlook for a robust recovery appears extremely
promising. The pandemic will likely remain an obstacle,
but vaccination rates in Santa Clara County are the best
in the nation, our business and community leadership
has demonstrated a strong and solid commitment to our
success. Technology companies and commercial real
Santa Clara County Assessor’s Annual Report 2021-22
estate developers continue to design and develop impressive,
multi-story office buildings and corporate campuses.
Residential housing values continue to increase, entrepreneurship
and innovation led by record venture capital
investment is driving the Silicon Valley economy, and
higher education in the Bay Area remains the envy of the
nation.
What’s Inside the Annual Report?
The Assessor’s Annual Report offers comprehensive
statistical analysis of the local assessment roll, including
all real and business property, legal exemptions and
assessment appeals. Assessment information is provided
by property type, city and school district.
The Assessor’s Annual Report is an important source
of information for public finance officials, real estate
professionals, tax experts, academics, as well as business,
government, and community leaders seeking insights into
real estate trends in Santa Clara County.
Role of the Assessor’s Office
The Assessor’s Office annually determines the assessed
value of all real and business property. The assessment
roll is comprised of 529,005 assessable roll units, and
is the basis upon which property taxes are levied. Property
taxes are an essential source of revenue supporting
basic public services provided by schools, cities, special
districts and local governments, critical to the vitality of
our region.
Assessment Roll Growth
Roll growth is determined by the combined net annual
assessment of transfers of ownership, new construction,
the annual statutory increase limited to two percent,
business property, and exemptions. The change in the
assessed value of individual properties is the difference
between the prior assessed value and the new market
value. When a change in ownership or new construction
occurs, the real property is assessed at fair market value.
This newly established value is referred to as the “base
year value” and cannot increase more than two percent
per year, unless there is a subsequent change in ownership
or new construction.
The largest drivers of growth this year were changes of
ownership and new construction, contributing $14 billion
and $6.69 billion respectively. Both of these factors are
impacted by economic and business cycles. For example,
in Santa Clara County, changes in ownership generates
an increase in assessments because the appreciation of
real estate is a near constant, except during the most
severe recessions. However, property sales volume varies
due to market conditions. New construction, the second
largest contributor to assessment growth, is considered a
leading indicator of trends in the real estate cycle.
3
The County experienced an 18 percent decline in the assessment
growth from transfers of ownership, year over
year. Commercial property assessments also declined
by 21 percent from the prior year. Many commercial
property owners and developers took a “wait and see”
approach, hesitating to commit to any meaningful economic
activity while the pandemic raged. Interestingly,
the assessment of residential property transfers actually
increased by 2.4 percent.
Roll growth due to new construction declined by 21
percent to $6.7 billion from $8.5 billion the prior year.
During the pandemic, new construction was disrupted
by work stoppages, and labor and material shortages.
Local planning and building departments were disrupted
as they scrambled to adapt to shelter-in-place mandates.
Going forward, however, construction is expected to
resume to pre-pandemic levels as the corporate commitment
to Silicon Valley remains strong.
Proposition 13 generally limits assessed value growth
to 2 percent annually, except for the reassessment of
transfers of ownership or new construction. The limit is
tied to the California Consumer Price Index (CCPI). In
2021/2022, the CCPI was just 1.036 percent for properties
not affected by transfers of ownership or new
construction, creating a loss in anticipated property tax
revenue for schools and local government.
Growth Driven by Location
Roll growth in Mountain View, at 8 percent, was the
standout among the 15 cities, exceeding the average of
4.6 percent. Sunnyvale, Monte Sereno and Morgan Hill
all had assessed roll growth exceeding 5 percent. All
other jurisdictions, including the unincorporated areas
exceeded 4 percent, with the exception of Cupertino,
which increased at a meager 3.6 percent.
Challenges
The last fiscal year has been both the most challenging
and rewarding of my career. It was a year of constant
adaptation, to shelter-in-place requirements, mask
mandates, vaccination administration, budget reductions,
working remotely, and a re-organization to reduce
expenses. Yet, my staff’s commitment to their essential
role, producing an accurate assessment roll, combined
with excellent customer service, never wavered. And,
more importantly, we achieved all this while keeping
employees safe throughout the worst of the pandemic.
Accomplishments
• For the 26th consecutive year, completed the
annual assessment roll by the state-mandated
July 1, 2021 deadline.
• Completed 98.7 percent of real property assessments.
• Completed 99.47 percent of business personal
property assessments.
• Completed 711 audits of companies mandated
by state law.
• Processed 100 percent of recorded deeds.
• Completed all exemption claims file by eligible
non-profit organizations, homeowners and
veterans.
• Processed 65,297 business accounts.
• Processed 59,130 title documents.
• Successfully defended assessed values before
the Assessment Appeals Board, retaining 96.8
percent of the assessed value in dispute.
• Resolved 2,619 assessment appeals.
Modernization, Management and Service
I am committed to employee safety, productivity, process
improvement, efficiency, fiscal responsibility, and
customer service. I am proud of my staff’s accomplishments
and improvements in each of these areas:
• Complied with OSHA COVID-19 safety
requirements, the Santa Clara County Public
Health Department’s shelter-in-place orders,
and vaccination directives.
• Returned $1.68 million one-time savings of the
Assessor’s budget to the County General Fund.
During my 26 year tenure as Assessor, I have
returned $23 million to the County General
Fund, unspent.
• Reorganized the Standards, Services and
Exemption Division, achieving $1.6 million
in annual structural savings, while increasing
efficiency and productivity.
Factors Causing Changes to the Roll Compared to the Prior Year
Factor Current Year (AV*) Previous Year (AV*) Net Change (AV*)
Business Personal Property $44,455,650,560 $45,331,043,107 ($875,392,547)
Exemptions ($31,333,367,608) ($30,823,301,130) ($510,066,478)
Proposition 8 net changes ($1,811,725,352) ($2,050,409,497) $238,684,145
Corrections/Board/Other $537,706,626,809 $537,034,966,189 $671,660,620
New Construction $6,690,044,268 $0 $6,690,044,268
Change in Ownership $14,001,465,631 $0 $14,001,465,631
Total Roll $576,904,260,355 $551,542,708,166 $25,361,552,189
*AV= Assessed Value
• Administered an annual budget based on service
levels, including measurable increases in productivity.
• Assisted 32,083 taxpayers who contacted the office
by telephone, and 2,722 who visited the public
service counter. My office implemented an online
reservation system for in-person public service,
coupled with stringent safety measures to maintain
accessibility for seniors and others who need onsite
customer service.
• Completed 9,044 hours of professional training, including
1,739 hours of State Board of Equalization
training, in addition to County initiated leadership
classes.
• Achieved a department wide customer satisfaction
rating of 95.4 percent from independent surveys of
taxpayers who contacted the Assessor’s Office for
assistance.
• Replaced our legacy document management system
with a modern system supporting current security
standards, file formats, and process workflows
and successfully converted 20 million documents
to the new system.
• Scanned 32,644 documents into the document
management system, demonstrating our commitment
to a paperless work environment.
• Over 880,000 visitors accessed the assessor’s website,
totaling 1.77 million page views.
• Hosted 8 community webinars addressing Prop. 19,
reaching over three thousand stakeholders, including
realtors, the California Bar Association, and
title companies.
• Levied penalties on businesses totaling $24,000
with unrecorded changes of ownership and recovered
$108 million from businesses who failed to
file their annual business property statements.
Leadership and Legislative Initiatives
Collaborating with the California Assessor’s Association,
we advocate for legislation conducive to efficient and
equitable property tax administration. For example, we
determined whether various deadline extensions due to the
COVID-19 crisis were necessary, especially in cases of
assessment appeals, we helped draft enabling legislation for
Prop. 19, and we advocated for augmented state funding of
Assessor’s Offices throughout the state.
We work closely with the California State Board of
Equalization to further professional development of staff
throughout California. We are a leader in education, developing
curricula and delivering it via the California Assessors’
Administrative Services Association. We believe that
furthering the education of staff results in the best customer
service delivery to the taxpayers of Santa Clara County.
Challenges Ahead
Our response to the COVID-19 pandemic demonstrated
amazing flexibility and resilience. We successfully completed
the annual assessment roll and delivered a quality
assessment product in compliance with our California
Constitutional mandate.
The future is uncertain, but it appears that a robust
economic rebound will emerge as vaccination rates
continues to increase. Real estate developers continue
to see opportunity in the county and new construction
of all types or real estate is expected to drive assessment
roll growth next year.
The residential real estate market continues to appreciate
to record levels. This too will drive roll growth
next year. It seems unsustainable in the long term, and
may lead to a correction when equilibrium returns to
the market.
Trends and Future Goals
As County Assessor, I remain committed to performance
and productivity. I have implemented performance
based budgeting that ties mission and goals
to the budget, critically evaluates performance and
focuses resources on improvements to quality, service,
innovation and accountability.
Assessor’s Office staff are talented, dedicated and ethical
and serve our community exceedingly well. They
strive to treat all taxpayers with the highest degree of
courtesy and professionalism.
For 27 years, it has been my honor to serve the taxpayers,
property owners and public agencies in Santa
Clara County. And, it is my privilege to continue leading
an important county function that renders fair and
accurate assessments, supporting schools, cities and
local public agencies, vital to our community.
Lawrence E. Stone
Assessor
“What gets
measured,
gets done.”
4
Santa Clara County Assessor’s Annual Report 2021-22 Santa Clara County Assessor’s Annual Report 2021-22
5
How are tax bills calculated?
Once the Assessor delivers the annual roll to the County Finance Agency, they calculate and issue property tax bills in
early October. Property taxes are calculated by multiplying the basic one percent tax rate plus the annual rate to service
each jurisdiction’s payment on general obligation bonds, special fees, and any other bonded indebtedness imposed by
public agencies and approved by the voters. Property tax revenue supports K-12 school and community college districts,
as well as local government agencies including cities, the county and special districts. Redevelopment Successor Agencies
continue to receive a portion of property taxes to service outstanding debt incurred by Redevelopment Agencies
while they existed.
The annual assessment roll is the foundation of the property tax system and as such it must be complete, accurate and
consistently delivered to serve the community and agencies that depend on the revenue it generates. The Assessor’s Office
does not calculate or collect taxes, nor does the Assessor forecast or allocate tax revenues. For information regarding
the collection of and allocation of property taxes, please visit the Department of Tax and Collections (DTAC) online at
www.scctax.org or call (408) 808-7900.
Where do my
property taxes go?
6
K-12 Public
44%
Top 15 Taxpayers for Santa Clara County for FY 2020-2021
Firm Type of Business Assessed Value Taxes Paid
GOOGLE, INC. Internet $8,831,675,833 $105,798,878
PACIFIC GAS & ELECTRIC CO. Utilities $2,511,014,384 $66,251,127
CAMPUS HOLDINGS, INC. Computer Manufacturing $3,652,054,476 $43,287,876
APPLE COMPUTER, INC. Computer Manufacturing $1,932,561,304 $23,088,583
CISCO TECHNOLOGY, INC. Computer Manufacturing $1,517,606,211 $18,124,359
WESTFIELD MALLS Retail $1,198,731,500 $15,520,732
APPLIED MATERIALS, INC. Chip Manufacturing Equipment $1,145,700,280 $13,515,188
INTEL CORPORATION Chip Manufacturing $1,090,141,602 $12,899,044
LOCKHEAD MARTIN Aerospace $891,098,033 $10,589,600
ESSEX PORTFOLIO LP Real Estate Management $836,678,920 $10,024,615
FRIT SAN JOSE TOWN & COUNTRY VILLAGE, LLC Corporate Service Company $655,151,539 $9,783,950
PACIFIC BELL TELEPHONE CO. DBA AT&T CA Communications $376,145,984 $9,734,644
INTUITIVE SURGICAL, INC. Medical Device Manufacturer $491,514,374 $9,239,254
CW SPE, LLC LLC $771,596,716 $9,093,267
GP IX SAC II PROPERTIES, LLC LLC $745,701,200 $8,942,406
Santa Clara County Average Property Tax Revenue Allocation 2021-2022
The County Assessor’s Office does not calculate taxes or allocate tax revenues.
County
18%
*Image compliments of Sunnyvale Heritage Park Museum
Cities*
14%
Redevelopment
11%
Community
College
7%
Special
Districts
6%
ASSESSED VALUE (BILLIONS)
$308 $334 $357 $388 $419 $450
Santa Clara County Assessor’s Annual Report 2021-22 Santa Clara County Assessor’s Annual Report 2021-22
$483
$516
$551 $577
2012 2013 2014 2015 2016 2017 2018 2019 2020 2021
The
Assessment
Roll
“Property tax, plus all other
special assessments for
fiscal year 2020-2021, is
$6,936,634,340.”
The assessment roll is comprised of the secured roll (property subject to lien) and the unsecured roll (property on which
property taxes are not a lien against improvements on leased land). Exemptions from property taxation fall into two broad
categories: homeowners and “other” exemptions, such as non-profit organizations, churches, charitable institutions, colleges,
hospitals, affordable housing and private schools. Only homeowners’ exemptions are backfilled by the state and comprise only
$1.7 billion of the total $33 billion in exemptions.
Improvements (the value of buildings or structures situated on land) reflect values assessed by both the Real Property and
Business Divisions. Prop. 13 provides that once a base year value is established as a result in a change of ownership or new
construction, the base year can increase by no more than two percent annually, or the California Consumer Price Index (CCPI),
whichever is lesser. The CCPI has been less than two percent in three of the last ten years, and ten times since the passage of
Prop. 13 in 1978.
Summary Report: 2021-2022 Assessment Roll Totals
Assessment Type 2021-2022 2020-2021 Dollar Change
Land $286,689,631,738 $272,285,752,426 $14,403,879,312 5%
Improvements (Real Property) $277,092,345,665 $264,749,213,763 $12,343,131,902 5%
Improvements (Business Division) $2,950,671,724 $2,889,051,702 $61,620,022 2%
Total Improvements $280,043,017,389 $267,638,265,465 $12,404,751,924 5%
Subtotal $566,732,649,127 $539,924,017,891 $26,808,631,236 5%
Personal Property $6,235,975,120 $5,948,789,766 $287,185,354 5%
Mobile Homes $865,664,756 $798,587,758 $67,076,998 8%
Subtotal $7,101,639,876 $6,747,377,524 $354,262,352 5%
Total Gross Secured $573,834,289,003 $546,671,395,415 $27,162,893,588 5%
Less: Non-Reimbursable Secured Exemptions ($28,022,688,740) ($27,063,856,359) ($958,832,381) 4%
NET SECURED $545,811,600,263 $519,607,539,056 $26,204,061,207 5%
Total Gross Unsecured $34,403,338,960 $35,694,613,881 ($1,291,274,921) -4%
Percent
Change
Less Non-Reimbursable Unsecured Exemption ($3,310,678,868) ($3,759,444,771) $448,765,903 -12%
NET UNSECURED $31,092,660,092 $31,935,169,110 ($842,509,018) -3%
TOTAL LOCAL ROLL $576,904,260,355 $551,542,708,166 $25,361,552,189 5%
Homeowners’ Exemption $1,721,855,800 $1,770,130,021 ($48,274,221) -3%
7
Supplemental
Assessments
Supplemental assessments were created by Senate Bill 813 in 1983 to close inequities in Proposition 13. Prior to the
creation of supplemental assessments, changes in assessed value, due to a change in ownership or completion of new
construction, would not result in higher taxes until the tax year following the Lien Date, when the new values were
placed on the assessment roll. In some instances, taxes on the new assessments would not be collected for up to 21
months. This resulted in serious differences in tax treatment for transactions that may have only been separated by one
day. Supplemental assessments are designed to identify changes in assessed value that occur during the fiscal year,
including changes in ownership and new construction, creating a substantial amount of new revenue for schools and
local government. They are in addition to the annual assessment and property tax bill.
A supplemental tax bill is issued only on the added value, and is prorated for the remaining portion of the fiscal year.
The entire new assessed value is reflected on the regular roll bill the next fiscal year.
The Assessor’s Office produces a supplemental roll that generates significant revenue, not part of the annual roll. The
assessed value of all supplemental assessments for calendar year 2020 totaled $21.3 billion, a dramatic increase from
the prior year total of $13.7 billion. The number of supplemental assessments also increased from 17,000 to 27,000,
due to the implementation of a direct assessment application for residential transfers of ownership.
The chart below reflects the number of supplemental assessments processed and the average supplemental assessed
value per transaction for each calendar year.
$900,000
$800,000
$700,000
$600,000
$500,000
$400,000
$300,000
$200,000
$100,000
$-
$425,038
SUPPLEMENTAL ASSESSMENTS
$593,169
$653,367
$638,982
$792,377
$808,178
$774,043
29,096 25,127 24,200 27,269 24,494 17,016 27,557
2014 2015 2016 2017 2018 2019 2020
Total Events
Avg. Assessed Value per Transaction
35,000
30,000
25,000
20,000
15,000
10,000
5,000
0
County*
Bay Area Counties Assessed Value (AV) 2021-2022
Secured, Unsecured, and Total Net Assessment Roll
Net Secured Roll
Net Unsecured
Roll
Total Net Roll
California’s Most Populous Counties 2021-2022
Secured, Unsecured and Total Net Assessment Roll
County* Net Secured Roll Net Unsecured Roll Total Net Roll
Roll Comparison
of Counties
% Increase
over Prior
Year
% Increase
Over Prior
Year
Avg. Per
Capita
Avg. Per
Capita
Population
Santa Clara $545,811,600,263 $31,092,660,092 $576,904,260,355 4.60% $298,270 1,934,171
Alameda $329,499,202,788 $17,165,799,328 $346,755,002,116 4.30% $209,318 1,656,591
San Francisco $291,894,672,529 $16,774,138,496 $308,668,811,025 3.58% $352,760 875,010
San Mateo $255,814,987,683 $9,996,830,828 $265,811,818,511 4.16% $347,355 765,245
Contra Costa $227,255,929,451 $6,371,167,054 $233,627,096,505 3.44% $202,475 1,153,854
Sonoma $99,036,551,075 $3,247,331,795 $102,283,882,870 3.20% $211,240 484,207
Marin $88,016,346,763 $1,716,464,259 $89,732,811,022 3.93% $348,107 257,774
Monterey $73,348,896,412 $3,341,376,606 $76,690,273,018 3.78% $175,365 437,318
Solano $60,152,334,245 $2,541,170,739 $62,693,504,984 2.97% $142,964 438,527
Santa Cruz $51,167,425,927 $1,035,947,483 $52,203,373,410 3.49% $199,925 261,115
Napa $43,932,678,970 $1,627,386,255 $45,560,065,225 3.35% $331,016 137,637
San Benito $9,928,563,508 $446,400,335 $10,374,963,843 6.49% $163,318 63,526
Population
Los Angeles $1,706,356,284,695 $56,714,147,269 $1,763,070,431,964 3.70% $175,527 10,044,458
Orange $654,865,750,820 $23,199,112,232 $678,064,863,052 3.47% $215,002 3,153,764
San Diego $589,029,483,462 $16,332,151,661 $605,361,635,123 3.49% $182,591 3,315,404
Santa Clara $545,811,600,263 $31,092,660,092 $576,904,260,355 4.60% $298,270 1,934,171
Alameda $329,499,202,788 $17,165,799,328 $346,665,002,116 4.30% $209,264 1,656,591
Riverside $319,939,724,243 $10,307,859,936 $330,247,584,179 5.64% $134,550 2,454,453
San Francisco $291,894,672,529 $16,774,138,496 $308,668,811,025 3.58% $352,760 875,010
San Mateo $255,814,987,683 $9,996,830,828 $265,811,818,511 4.16% $347,355 765,245
San Bernadino $250,846,380,419 $13,191,490,045 $264,037,870,464 6.50% $121,346 2,175,909
Contra Costa $227,255,929,451 $6,371,167,054 $233,627,096,505 3.44% $202,475 1,153,854
Sacramento $184,891,603,907 $6,619,417,144 $191,511,021,051 5.32% $122,684 1,561,014
Ventura $152,003,126,472 Not Available $152,003,126,472 N/A $181,991 835,223
Kern $89,687,251,563 $9,336,504,390 $99,023,755,953 0.92% $108,318 914,193
Fresno $86,191,278,240 $4,027,204,387 $90,218,482,627 4.19% $87,874 1,026,681
San Joaquin $86,186,211,733 $4,487,818,505 $90,674,030,238 6.73% $115,724 783,534
*sorted by net secured roll
8
Santa Clara County Assessor’s Annual Report 2021-22 Santa Clara County Assessor’s Annual Report 2021-22
9
Assessment Growth by City
Palo Alto 3.85%
Los Altos Hills 4.71%
Cupertino 3.55%
Los Altos 4.73%
While assessment roll growth was
strong in most communities, Sunnyvale,
Mountain View grew faster than
the County average—a direct result
of major commercial and industrial
construction projects by Google, Jay
Paul, and Nvidia.
Mountain View 8.06%
Saratoga 4.00%
Sunnyvale 5.02%
Santa Clara 4.28%
Milpitas 4.04%
San Jose 4.28%
Monte Sereno 5.63%
Unincorporated 4.88%
Campbell 4.78%
Los Gatos 4.33%
Gilroy 4.45%
Morgan Hill 5.75%
Real Property Distribution By City
City Name Total Value Exemptions* Net Total Parcel Count
Campbell $12,159,546,933 $214,712,647 $11,944,834,286 12,205
Cupertino $26,198,594,820 $135,857,482 $26,062,737,338 16,593
Gilroy $10,230,233,872 $385,260,050 $9,844,973,822 14,629
Los Altos $19,120,639,741 $431,088,448 $18,689,551,293 11,116
Los Altos Hills $9,356,272,442 $34,718,453 $9,321,553,989 3,208
Los Gatos $15,573,275,146 $339,464,603 $15,233,810,543 11,038
Milpitas $20,333,695,268 $321,015,794 $20,012,679,474 19,899
Monte Sereno $2,566,132,966 $897,205 $2,565,235,761 1,291
Morgan Hill $11,367,672,410 $337,357,794 $11,030,314,616 13,121
Mountain View $35,630,852,213 $645,676,674 $34,985,175,539 19,838
Palo Alto $48,782,114,409 $7,275,976,470 $41,506,137,939 20,677
San Jose $209,809,537,798 $6,134,719,210 $203,674,818,588 240,744
Santa Clara $44,443,249,102 $2,290,912,103 $42,152,336,999 29,669
Saratoga $17,722,605,307 $230,766,761 $17,491,838,546 11,141
Sunnyvale $52,740,655,762 $617,766,429 $52,122,889,333 33,088
Unincorporated $27,746,899,214 $7,881,542,250 $19,865,356,964 25,431
Total $563,781,977,403 $27,277,732,373 $536,504,245,030 483,688
* See Pg. 15 for more information on exemptions
Real Property Distribution of Value* by Type
10
Net Assessment Roll Growth By City
City Secured City Secured RPTTF* Unsecured City
Unsecured
Growth Percent
Net Roll
RPTTF*
% of Roll
Campbell $10,611,263,634 $1,397,673,051 $256,559,762 $106,704,329 $12,372,200,776 4.78% 2.14%
Cupertino $27,083,468,890 $1,724,247,088 $28,807,715,978 3.55% 4.99%
Gilroy $9,968,898,669 $296,112,343 $10,265,011,012 4.45% 1.78%
Los Altos $18,702,154,929 $123,403,929 $18,825,558,858 4.73% 3.26%
Los Altos Hills $9,322,116,432 $3,447,749 $9,325,564,181 4.71% 1.62%
Los Gatos $13,362,944,816 $1,891,297,788 $248,375,152 $49,064,944 $15,551,682,700 4.33% 2.70%
Milpitas $10,946,282,678 $9,481,026,383 $835,349,447 $1,082,385,691 $22,345,044,199 4.04% 3.87%
Monte Sereno $2,565,235,761 $673,806 $2,565,909,567 5.63% 0.44%
Morgan Hill $7,398,469,690 $3,721,227,859 $203,198,815 $157,543,302 $11,480,439,666 5.75% 1.99%
Mountain View $30,537,743,197 $5,021,064,516 $1,385,997,245 $636,928,758 $37,581,733,716 8.06% 6.51%
Palo Alto $41,743,865,568 $2,283,406,108 $44,027,271,676 3.85% 7.63%
San Jose $172,895,219,493 $33,390,149,147 $4,842,807,465 $4,732,662,301 $215,860,838,406 4.28% 37.42%
Santa Clara $39,620,417,482 $4,636,364,116 $6,747,206,002 $1,259,871,212 $52,263,858,812 4.28% 9.06%
Saratoga $17,496,991,236 $46,610,292 $17,543,601,528 4.00% 3.04%
Sunnyvale $51,902,116,438 $2,006,530,558 $3,543,324,755 $131,110,306 $57,583,082,057 5.02% 9.98%
Unincorporated $20,109,075,689 $2,243 $395,669,291 $20,504,747,223 4.88% 3.55%
Total $484,266,264,602 $61,545,335,661 $22,936,389,249 $8,156,270,843 $576,904,260,355 4.60% 100%
*Redevelopment Property Tax Trust Fund
Property Type
Santa Clara County Assessor’s Annual Report 2021-22 Santa Clara County Assessor’s Annual Report 2021-22
Property Value
Value
Growth %
Percent of
Total Value
Parcel
Count
Single Family Detached $287,825,426,748 5% 54% 338,149 70%
Condominiums $55,838,663,581 5% 10% 91,483 19%
Office $52,546,572,694 8% 10% 5,294 1%
Apartments 5+ Units $41,911,245,022 5% 8% 5,920 1%
R&D Industrial $23,192,735,955 7% 4% 790 0%
Other Industrial Non-Manufacturing $17,079,856,329 7% 3% 3,431 1%
Specialty Retail and Hotels $16,271,319,622 4% 3% 5,700 1%
Single Family 2-4 Units $10,421,521,235 4% 2% 15,036 3%
Major Shopping Centers $9,445,871,522 0% 2% 864 0%
Other Urban $7,455,569,139 -3% 1% 6,715 1%
Public & Quasi-Public $6,092,869,139 19% 1% 2,571 1%
Other Industrial Manufacturing $3,695,268,310 -3% 1% 2,066 0%
Agricultural $2,442,610,893 4% 0% 5,346 1%
Electronics & Machinery Manufacturing $2,197,502,746 -10% 0% 171 0%
Residential Misc. $87,212,095 19% 0% 152 0%
Parcel
%
Total $536,504,245,030 5.0% 100% 483,688 100%
*Net of non-reimbursable exemptions; does not include mobile homes; includes possessory
interest assessments which, until 2014-15, were on the unsecured roll
11
Proposition 13
Passed by the voters in June 1978, Proposition 13 (Prop. 13) amended the California Constitution, limiting the assessment
and taxation of property in California. It restricts both the tax rate and the annual increase of assessed value as follows:
• The property tax cannot exceed one percent of a property’s taxable value (plus service fees, improvement bonds, and
special assessments, many of which require voter approval).
• A property’s original base value is its 1975-76 market value. A new base year value is established by reappraisal whenever
there is a change in ownership or new construction. An increase in the assessed value of real property is limited to no
more than two percent per year.
• The adjusted (factored) base year value of real property is the upper limit of value for property tax purposes.
• Business property, boats, airplanes, and certain restricted properties are subject to annual reappraisal and assessment.
During a recession, the gap between the market value and assessed value of single-family homes declines. However, as
the economy recovers, the gap widens.
The chart below provides a snapshot as of December 31, 2020, based upon market value as of March 1, 1975, or the
subsequent date of acquisition, plus the inflation rate not to exceed two percent per year for properties in Santa Clara
County. For example, 21 percent of all current single-family homeowners purchased their property before 1989; however,
they only account for six percent of all property taxes paid by homeowners. In contrast, homes purchased in the
last ten years account for 61 percent of the total property tax paid by homeowners. The disparity is even greater among
owners of commercial, industrial, and multifamily properties.
Q. How many properties are still protected by
Prop. 13, passed by the voters in 1978?
A. All properties in Santa Clara County and
throughout California receive the full protections
and benefits of Prop. 13, whether a property was
purchased last year or in 1975. A base year value
is established at the time of purchase or new construction,
and increases in the assessed value are
limited to an inflation factor of no more than two
percent annually.
Q. What happens when a property
transfers ownership?
A. The Assessor determines if a reappraisal is required
under State law. If required, an appraisal is made to
determine the new base value of the property. The sales
price, if known, is a strong indicator, but not the sole
factor in setting the assessment. The property owner
is notified of the new assessment and has the right to
appeal both the value and the reappraisal decision. The
reappraisal of property acquired by inheritance from an
estate or living trust occurs as of the date of the death of
the former owner, not on the date of distribution to the
beneficiary. An assessment will be made in the name of
the estate even if the property is sold rather than distributed
to the heirs.
Distribution of Secured Assessment Roll by Base Year and Property Type (Gross AV)
Base Year Lien
Date
Single-Family/Condominium Multifamily Housing Commercial, Industrial, Other
Assessed Value AV % Parcel
%
Assessed Value AV % Parcel
%
Assessed Value AV % Parcel
%
Prior to 1979 $6,078,236,212 2% 11% $1,431,078,535 2% 14% $15,228,894,978 9% 14%
1979-1988 $12,921,394,447 4% 10% $2,708,508,592 5% 14% $6,489,020,142 4% 9%
1989-1998 $31,720,648,814 9% 14% $3,500,480,900 6% 13% $9,179,266,129 6% 11%
1999-2008 $86,055,930,478 25% 22% $12,581,441,631 22% 22% $25,665,307,917 16% 19%
2009-2018 $139,393,080,614 41% 32% $29,063,060,612 50% 28% $74,919,510,422 46% 34%
2019-to date $67,908,961,919 20% 11% $8,970,147,468 15% 9% $29,967,007,593 19% 12%
Total $344,078,252,484 100% 100% $58,254,717,738 100% 100% $161,449,007,181 100% 100%
Who benefits from Prop. 13?
Every property owner benefits from Prop. 13; however, the longer a property is owned, the greater the property tax benefit.
For example, 21 percent of all single-family properties purchased before 1989 have not had their assessed value adjusted
beyond the Prop. 13 two percent cap or the CCPI, whichever is lower. However, these properties only comprise six percent
of the total assessed value for all single-family properties. In contrast, of the 429,637 residential properties in the county,
185,840 were purchased between 2009 and 2020, accounting for 43 percent of the total number of residential properties.
These property owners are paying a greater share of the total property taxes. The assessed value of these residential properties
was $207.3 billion, 60 percent of the total. The table below provides a snapshot as of December 31, 2020, based upon
market value as of March 1, 1975, or the subsequent date of acquisition, plus the inflation rate, not to exceed two percent per
year for properties in each city in the county. For example, in Sunnyvale, 42 percent of the properties were acquired in the
last ten years and are paying 69.5 percent of the total property taxes.
Distribution of Assessment Roll by Year and Percentage
City Name
Campbell
Cupertino
Gilroy
Los Altos
Los Altos Hills
Los Gatos
Milpitas
Monte Sereno
Morgan Hill
Mountain View
Palo Alto
San Jose
Santa Clara
Saratoga
Sunnyvale
Unincorporated
% Type
Prior to 1979- 1989- 1999- 2009- 2019-to
1979 1988 1998 2008 2018 date
Gross AV 1.81 3.86 8.05 20.78 41.50 24.00
Parcel 11.23 10.17 14.41 21.48 30.81 11.90
Gross AV 1.26 3.98 9.27 23.47 48.28 13.75
Parcel 10.10 11.16 17.40 28.03 25.98 7.33
Gross AV 1.04 2.73 5.25 25.13 43.87 21.97
Parcel 5.94 6.79 9.11 20.54 40.61 17.02
Gross AV 1.84 3.86 10.17 24.18 41.28 18.67
Parcel 14.61 10.69 15.63 21.14 28.64 9.29
Gross AV 1.88 4.70 10.58 25.65 43.58 13.62
Parcel 14.14 13.05 15.96 19.62 28.86 8.37
Gross AV 2.18 3.98 8.56 21.67 42.84 20.77
Parcel 12.25 10.35 14.31 19.87 30.89 12.34
Gross AV 6.28 3.08 7.93 19.89 41.74 21.08
Parcel 9.26 8.73 14.21 20.24 32.82 14.74
Gross AV 1.99 4.19 12.02 24.74 35.69 21.37
Parcel 14.56 11.00 16.19 19.05 25.17 14.02
Gross AV 1.40 3.04 7.58 23.56 38.77 25.64
Parcel 4.61 6.24 11.89 21.71 35.96 19.60
Gross AV 1.61 3.74 4.81 16.40 51.75 21.69
Parcel 12.09 7.71 12.27 23.11 32.10 12.72
Gross AV 9.54 4.96 8.50 21.90 38.76 16.34
Parcel 15.69 11.31 15.12 21.73 27.66 8.49
Gross AV 2.23 3.64 7.81 24.45 41.70 20.17
Parcel 10.17 10.01 13.94 22.30 32.58 11.01
Gross AV 3.73 3.02 7.91 17.23 50.78 17.33
Parcel 14.02 9.08 11.47 22.06 32.11 11.27
Gross AV 2.78 4.09 12.64 26.49 38.47 15.54
Parcel 14.19 10.11 18.18 21.31 27.51 8.70
Gross AV 2.64 2.78 6.56 18.49 50.41 19.13
Parcel 13.42 9.70 13.39 21.46 30.52 11.51
Gross AV 22.60 9.14 6.98 19.38 28.63 13.27
Parcel 14.91 11.07 13.07 20.46 29.91 10.58
12
Santa Clara County Assessor’s Annual Report 2021-22 Santa Clara County Assessor’s Annual Report 2021-22
13
Historical Trends of
Properties as Percent of
Total Assessed Value of All
Secured Properties
Roll Year Residential % Industrial %
2004 65.51% 34.49%
2005 67.38% 32.62%
2006 67.86% 32.14%
2007 67.67% 32.33%
2008 66.83% 33.17%
2009 65.46% 34.54%
2010 65.89% 34.11%
2011 66.72% 33.28%
2012 66.50% 33.50%
2013 66.95% 33.05%
2014 66.76% 33.24%
2015 65.55% 34.45%
2016 64.64% 35.36%
2017 64.19% 35.81%
2018 63.86% 36.14%
2019 63.90% 36.10%
2020 63.16% 36.84%
2021 63.07% 36.93%
$1,800,000
$1,600,000
$1,400,000
$1,200,000
$1,000,000
$800,000
$600,000
$400,000
$200,000
$-
Assessed Values in
Santa Clara County
This chart compares the total net assessed value of residential
properties to other property, including commercial and industrial
properties. Since Prop. 13 passed in 1978, the portion of the net
secured assessment roll of commercial and industrial properties
has declined 8 percent, a trend consistent with data from other
counties. The reason for this shift is likely the growth of residential
properties. Between 1978 and 2020, the number of residential
parcels grew by 49 percent, while the number of nonresidential
actually shrunk by 8 percent.Within a similar timeline,
the population grew 49 percent.
Properties as a Percent of Total Net
Assessed Value Of All Secured
Properties
80%
70%
56%
52% 56% 60% 67% 67%
60%
63%
50%
40%
48%
44%
44%
30%
40%
20%
33% 33%
37%
10%
0%
1970 1980 1990 2000 2010 2020 2030
Residential(SFR and Condo)
Non-Residential
Single Family Homes Average "Sale" Value Vs Average Assessed Value
1975 1980 1985 1990 1995 2000 2005 2010 2015 2020 2025
Average Sales Price
Average Assessed Value
Property Tax Exemptions
“Under Section 4(b) of Article XIII of the
California Constitution, the Legislature has the
authority to exempt property (1) used exclusively
for religious, hospital, or charitable purposes,
and (2) owned or held in trust by nonprofit
organizations operating for those purposes. This
exemption from property taxation, popularly
known as the welfare exemption, was first adopted
by voters as a constitutional amendment
on November 7, 1944. With this amendment,
California became the last of 48 states in the
country to provide such an exemption from
property taxes.
When the Legislature enacted Section 214 of
the Revenue and Taxation Code to implement
the Constitutional provision in 1945, a fourth
purpose, scientific, was added to the three
mentioned in the Constitution. Section 214
parallels and expands upon the Constitutional
provision that property used exclusively for the
stated purposes (religious, hospital, scientific,
or charitable), owned by qualifying nonprofit
organizations, is exempt from taxation if certain
requirements are met. An organization’s primary
purpose must be either religious, hospital, scientific,
or charitable. Whether its operations are for one of these purposes is determined by its activities. A qualifying
organization’s property may be exempted fully or partially from property taxes, depending on how much of the
property is used for qualifying purposes and activities.”*
The table entitled “Qualifying Exemption 2021-2022” illustrates the various types of properties receiving exemptions
in Santa Clara County, as well as the sum of those exemptions. As you can see, the magnitude of the welfare
and institutional exemptions dwarfs the more commonly known homeowners’ exemption.
Santa Clara County’s Largest Exemption: Stanford University
“The College Exemption is available to property used exclusively for educational
purposes by a nonprofit educational institution of collegiate grade. The property
may be either owned or leased, but it must be used for educational purposes as
of the January 1 Lien Date. Buildings under construction or renovation, and the
land required for their convenient use, and equipment in them may also qualify
for the exemption if the intended use when completed will qualify the property for
exemption … The courts have construed that ‘used exclusively for the purposes
of education’ to include any facilities that are ‘reasonably necessary for the fulfillment
of a generally recognized function of a complete and modern college.’” **
Leland Stanford Junior University, founded in 1885, is granted the title of the largest
exemption in Santa Clara County annually. With 357 total exempt properties,
the exemptions at the time of the 2021 Lien Date summed up to $15,954,808,967.
This figure includes Stanford Medical Center and the Lucille Packard Children’s
hospital, teaching and research institutes.
*Assessors’ Handbook, Section 267, Welfare, Church, and Religious Exemptions
**The College Exemption is provided for in Section 3(e) of Article XIII of the California Constitution, implemented
by Section 203 of the Revenue and Taxation Code
Qualifying Exemptions 2021-2022
Private and Parochial Schools
(less than Collegiate Grade)
Exemption Roll Unit Total Value
138 $847,721,585
Hospitals 39 $2,160,030,936
Other Religious and Charitable Properties 1,537 $8,855,317,188
Religious Properties 616 $904,969,220
Disabled Veterans 1,057 $144,712,386
Churches 95 $150,652,184
Privately Owned Colleges 492 $17,462,788,977
Cemetery 35 $181,801,237
Historical Aircraft 7 $322,586
Other 76 $625,051,309
Total Non-Reimburseable Exemptions 4,092 $31,333,367,608
Reimburseable Exemptions
(Homeowners’ Exemptions)
245,579 $1,721,855,800
Total Exemptions 249,671 $33,055,223,408
14
Santa Clara County Assessor’s Annual Report 2021-22 Santa Clara County Assessor’s Annual Report 2021-22
15
New Construction
City Name
Campbell
Cupertino
Gilroy
Los Altos
Los Altos Hills
Los Gatos
Milpitas
Monte Sereno
Morgan Hill
Mountain View
Palo Alto
San Jose
Santa Clara
Saratoga
Sunnyvale
Unincorporated
Total
Added Assessed Value due to Changes in New Construction
by City and Major Property Type, Value and Parcel Count: 2021-2022
Agricultural &
Misc.
Industrial &
Manufacturing
Multifamily
Housing
Office
Retail
Single-Family
Housing
$27,972 $390,000 $15,912 $498,474 $1,661,000 $39,833,282 $42,426,640
2 1 1 2 1 188 195
$17,342,351 $52,445,619 $3,944,975 $716,452 -$859,889 $79,790,759 $153,380,267
2 3 6 5 3 239 258.00
$6,261,993 $1,412,432 $7,485,987 $9,677,861 $38,344,529 $63,182,802
5 2 1 3 122 133.00
-$368,555 $823,526 $5,502,708 $95,821,699 $101,779,378
6 3 2 354 365
-$1,891,290 $82,361,322 $80,470,032
2 146 148
$6,403,965 $464,407 $4,834,858 $887,478 $49,997,190 $62,587,898
2 4 4 4 246 260
$19,477,438 $22,604,147 $143,273,348 $18,675,798 $14,713,355 $218,744,086
5 5 6 3 143 162
$14,600,696 $14,600,696
80 80
$4,773,422 $69,048,292 $23,661,852 $760,000 $1,031,995 $12,021,069 $111,296,630
2 8 2 1 3 147 163
$577,023,650 $138,536,554 $126,553,459 $501,915,037 $35,359,750 $100,438,795 $1,479,827,245
8 9 11 9 4 443 484
$2,867,066 $14,625,598 $13,386,217 $142,493,145 $52,054,904 $238,381,809 $463,808,739
16 2 5 9 19 451 502
$309,117,542 $139,782,318 $584,710,496 $602,241,778 $126,704,415 $299,562,158 $2,062,118,707
30 19 52 27 29 2,233 2,390
$21,740,512 $172,347,668 $133,753,353 $195,795,778 $11,093,343 $69,673,423 $604,404,077
3 13 12 9 5 467 509.00
$1,168,107 $1,221,836 $168,386 $67,184,007 $69,742,336
3 2 3 251 259
-$181,082 $569,539,272 $252,353,339 $102,644,033 $52,328,359 $97,672,740 $1,074,356,661
5 29 23 17 9 506 589
$9,611,820 $1,322,853 $81,840 $76,301,561 $87,318,074
45 2 1 446 494
$973,374,911 $1,182,054,753 $1,290,508,711 $1,558,624,099 $308,783,400 $1,376,698,394 $6,690,044,268
136 93 127 87 86 6,462 6991
Q. I am remodeling my home, will the improvements be reassessed?
A. Remodeling that does not involve adding to the size of the structure or to the amenities provided within
the structure is generally not considered new construction and is not subject to reassessment. The exception are
those situations where the remodeling is so extensive as to constitute the “substantial equivalent” of a new structure.
If a remodeling project is extensive, the property owner is encouraged to contact the Assessor’s staff in advance by
email at rp@asr.sccgov.org or (408) 299-5300, to obtain a better understanding of how the project will be treated for
assessment purposes.
Total
Major New Construction
On Map Assessee Property Type City Net Change
1 PLANETARY VENTURES, LLC / 1 Agricultural & Miscellaneous Mountain View $487,320,040
2 SJSC PROPERTIES, LLC Multifamily Housing San Jose $220,643,829
3 CAP TRANCHE 2, LLC Office San Jose $183,000,000
4 MGP IX SAC II PROPERTIES, LLC Office Mountain View $168,937,031
5 PEERY, RICHARD T. TRUSTEE & ET AL Office San Jose $155,355,350
6 BACCARAT SHORELINE, LLC Office Mountain View $149,140,873
7 ADOBE, INC. Agricultural & Miscellaneous San Jose $127,720,000
8 INTUITIVE SURGICAL, INC. Industrial & Manufacturing Sunnyvale $111,876,746
9 PATHLINE PARK I, LLC Industrial & Manufacturing Sunnyvale $102,692,335
10 LINKEDIN CORPORATION Industrial & Manufacturing Mountain View $101,779,630
4
1
9
6
Q. Appraising and Assessing: Is There a Difference?
10
8 7
A. Yes. An appraisal is the process of estimating value. Most taxpayers assume the marketplace exclusively determines
a property’s assessment. However, the market value may be only one component in the process of determining the
property’s assessed value. While at least one of the three approaches to value, (1) sales comparison, (2) income, and (3)
cost, is always considered in the appraisal of a property, the Assessor is required to incorporate additional factors when
determining when and how to assess property under State law. Frequently, court decisions, laws, and rules put into effect
by the State Legislature and State Board of Equalization amend the assessment process, and redefine what, when and/or
how the Assessor must determine the assessed value of a property.
3
5
2
16
Santa Clara County Assessor’s Annual Report 2021-22 Santa Clara County Assessor’s Annual Report 2021-22
17
Top 10 Changes in Ownership
% Increase Over
Property Type City Net AV Net Changed AV
Prior Year
Office Cupertino $346,000,000 $159,136,113 46.0%
Office San Jose $310,499,900 $188,536,838 60.7%
Office Palo Alto $300,840,297 $103,699,727 34.5%
Office San Jose $274,999,900 $44,824,611 16.3%
Multifamily Housing San Jose $175,951,172 $13,636,436 7.8%
Office San Jose $175,337,872 $65,340,673 37.3%
Industrial & Manufacturing San Jose $160,000,000 $60,870,118 38.0%
Office Santa Clara $153,574,719 $29,068,703 18.9%
Multifamily Housing San Jose $145,063,951 ($55,314) -0.0%
Industrial & Manufacturing Sunnyvale $141,274,000 $25,346,316 17.9%
City
Campbell
Cupertino
Gilroy
Los Altos
Los Altos Hills
Los Gatos
Milpitas
Monte Sereno
Morgan Hill
Mountain View
Palo Alto
San Jose
Santa Clara
Saratoga
Sunnyvale
Unincorporated
Added AV Due to Changes in Ownership
by City and Major Property Type, Value and Parcel Count
Agricultural & Industrial & Multifamily
Single-Family
Office Retail
Miscellaneous Manufacturing Housing
Housing
Total
$5,320,361 $13,944,124 $26,677,986 $47,267,600 $30,321,411 $251,697,440 $375,228,922
5 9 38 7 12 434 505
-$253,913 $94,519,205 $71,144,454 $189,403,593 $4,385,534 $406,589,825 $765,788,698
4 13 16 9 3 407 452
$72,630,031 $18,718,132 $26,047,576 $5,090,250 $5,830,560 $146,200,829 $274,517,378
96 8 76 2 11 782 975
$4,514,944 $2,216,557 $5,033,250 $12,267,648 $555,171,451 $579,203,850
11 1 8 3 363 386
$5,906,372 $30 $211,362,996 $217,269,398
8 1 111 120
$10,719,717 $14,894,370 $8,862,122 $38,978,828 $364,863,838 $438,318,875
24 16 18 16 452 526
$2,633,471 $88,168,218 $66,562,773 $1,713,089 $49,778,798 $297,775,393 $506,631,742
9 13 13 1 4 715 755
$5,024,218 $87,683,911 $92,708,129
2 65 67
$32,043,405 $24,320,551 $5,279,395 $1,602,058 $2,149,125 $261,781,845 $327,176,379
28 11 7 5 4 833 888
$27,978,799 $35,755,334 $123,915,318 $6,746,011 $31,047,042 $503,311,108 $728,753,612
15 5 26 6 8 648 708
$22,312,530 $58,702,194 $20,367,295 $228,541,060 $3,871,461 $777,443,407 $1,111,237,947
12 6 17 22 8 539 604
$202,964,284 $291,593,726 $193,686,858 $475,527,248 $136,864,702 $3,979,691,330 $5,280,328,148
135 103 299 67 80 8616 9300
$4,976,270 $161,263,757 $28,450,894 $93,634,662 $31,241,439 $755,936,702 $1,075,503,724
12 28 50 10 15 1140 1255
$4,453,021 $516,392 $2,102,232 $383,829,045 $390,900,690
14 3 5 321 343
$23,972,038 $115,064,754 $247,076,829 $35,539,080 $74,131,116 $818,164,791 $1,313,948,608
12 14 58 6 23 1046 1159
$63,176,286 $252,970 $2,347,697 $1,114,132 $168,931 $456,889,515 $523,949,531
215 3 6 4 3 737 968
What is Proposition 8?
Proposition 8, passed by California voters in November 1978, entitles property owners to the lower of the fair market
value of their property as of the Lien Date (January 1, 2021), or the factored base year value. The factored base
year value is the assessed value as determined at the time of purchase or construction, increased each year by no
more than two percent, or the CCPI, whichever is lower. When the market value of a property declines below the
factored base year value, the Assessor is required to proactively reduce the assessed value to reflect the lower fair
market value of their property. Properties where the market value exceeds the assessed value as of January 1, 2021,
are not eligible for an adjustment.
Billions
$30
$25
$20
$15
$10
$5
$0
$23.8
119
$27.0
124
PROPOSITION 8 HISTORY
$27.0
137
$15.9
81
$8.0
38
$4.9
22
2010 2011 2012 2013 2014 2015 2016 2017 2018 2019 2020 2021
$2.7
11
Temporary Reduction Amount (Billions)
$2.0
7
The Property Tax Avenger is on your side
To help new and prospective homeowners better understand how supplemental assessments
affect them, the Assessor’s Office has created a fun and informative video to
eliminate surprises about a confusing part of purchasing a new home. New homeowners
often assume their property taxes were taken care of during escrow, or as part of the
monthly mortgage payments, only to receive a supplemental assessment followed by a
supplemental tax bill. The “Tax Avenger” video provides a collection of information on
the Assessor’s website, including a “Supplemental Estimator” that enables a new property
owner to calculate the estimated taxes based upon the anticipated purchase price and
month of acquisition. The “Estimator” assists taxpayers to better understand how supplemental
assessments and taxes are calculated by the Assessor and the Tax Collector.
Find the Tax Avenger video on the Santa Clara County Assessor’s Office YouTube
channel.
$1.4
3
$1.1
2
$2.1
11
Parcel Count (Thousands)
$1.8
8
160
140
120
100
80
60
40
20
-
Thousands
18
Santa Clara County Assessor’s Annual Report 2021-22 Santa Clara County Assessor’s Annual Report 2021-22
19
Temporary Declines
in Assessed Value
Properties with Temporary Decline by City and Property Type
Business Personal Property
The assessed value of business personal property is derived from over 50,000 business property statements filed
by taxpayers annually, of which, 26,961 were filed electronically. Electronically filed business property statements
improve accuracy and reduce paperwork for both the Assessor and the taxpayer. While Santa Clara County ranks
sixth in population and has historically ranked fourth in total assessed value, it reports the second largest assessed
value of business personal property in the state.
When the filing period opens in January 2022, the Assessor’s website (www.sccassessor.org) will have a new
landing page for business statement filing. Improvements include ease of navigation, improved multiple account
filing, account maintenance, and ability to check online filing status.
Commercial Properties Townhouse/Condo Single-Family Housing Total
City
Value
Parcel
Count
Value
Parcel
Count
Reversing last year’s trend, the number of decline in value assessments dropped from 10,629 to 7,696, a surprise
given the uncertainty of the COVID-19 pandemic. And, the amount of reduction declined from $2.1 billion to
$1.8 billion. The reversal was due to the strength in the residential market, where the number of declines fell
by 2,945 properties. The number of commercial properties assessed at less than their factored base year value
increased only slightly. Surprising, given the concern for the effect of COVID-19 on the demand for commercial/
industrial property.
The number of residential sales was nearly identical in 2019 and 2020, but the median price of single-family
properties prices rose 3.5 percent year over year. Appreciation in the single-family market was particularly strong
in the fourth quarter of 2020, relative to the end of 2019, recording a 6.5 percent increase in the average sales
price and a 4.8 percent increase in the median sales price, countywide. The market for condominiums and townhomes
was relatively static year over year, with the number of sales and sales prices changing only slightly.
The greatest beneficiary of the strength in the single-family market has been the city of San Jose. The number of
properties assessed less than their factored base year value declined by 2,128 properties, resulting in an increase
in assessed value of nearly $230 million, which equates to $2.3 million in property taxes.
Real estate in Santa Clara County remains in high demand. The commercial market, after a bit of uncertainty,
still sees demand, particularly for Class A Office and other quality property types. The residential market remains
strong.
Value
Parcel
Count
Value By City
Parcel
Count
Campbell ($9,117,538) 9 ($10,258,705) 120 ($4,037,100) 29 ($23,413,343) 158
Cupertino ($32,993,682) 10 ($7,788,335) 85 ($4,472,036) 28 ($45,254,053) 123
Gilroy ($17,582,536) 28 ($1,618,806) 34 ($19,232,054) 193 ($38,433,396) 255
Los Altos ($697,929) 2 ($2,699,792) 22 ($6,509,113) 19 ($9,906,834) 43
Los Altos Hills ($1,319,318) 2 ($39,915,990) 20 ($41,235,308) 22
Los Gatos ($7,492,815) 9 ($6,685,175) 67 ($27,755,369) 32 ($41,933,359) 108
Milpitas ($46,624,826) 23 ($38,911,198) 560 ($5,710,512) 41 ($91,246,536) 624
Monte Sereno ($17,857,851) 9 ($17,857,851) 9
Morgan Hill ($14,749,928) 11 ($7,660,362) 187 ($7,502,197) 68 ($29,912,487) 266
Mountain View ($39,711,618) 16 ($52,216,653) 429 ($7,626,500) 37 ($99,554,771) 482
Palo Alto ($75,515,883) 12 ($9,614,099) 72 ($19,090,646) 32 ($104,220,628) 116
San Jose ($479,935,009) 139 ($206,590,193) 3,000 ($91,362,267) 641 ($777,887,469) 3,780
Santa Clara ($48,609,729) 13 ($42,774,862) 469 ($17,668,865) 123 ($109,053,456) 605
Saratoga ($1,444,924) 3 ($4,556,714) 38 ($98,425,474) 86 ($104,427,112) 127
Sunnyvale ($60,850,519) 22 ($58,220,174) 560 ($26,315,772) 148 ($145,386,465) 730
Unincorporated ($64,547,088) 85 ($186,200) 3 ($67,268,996) 160 ($132,002,284) 248
Total ($901,193,342) 384 ($449,781,268) 5,646 ($460,750,742) 1,666 ($1,811,725,352) 7,696
Business and Personal Property Distribution by City
City Gross Secured Gross Unsecured Gross Exemptions Net Total
Percent Value of
of Value Growth
Campbell $68,418,243 $375,979,881 $17,031,634 $427,366,490 1% 14%
Cupertino $1,029,472,298 $1,729,307,474 $13,801,132 $2,744,978,640 7% -10%
Gilroy $126,076,566 $300,238,808 $6,278,184 $420,037,190 1% 9%
Los Altos $34,364,102 $130,730,093 $29,086,630 $136,007,565 0% -3%
Los Altos Hills $3,704,857 $3,460,539 $3,155,204 $4,010,192 0% 3%
Los Gatos $53,462,172 $333,179,397 $68,769,412 $317,872,157 1% -4%
Milpitas $424,840,407 $1,922,356,687 $14,832,369 $2,332,364,725 6% 0%
Monte Sereno $1,119,933 $446,127 $673,806 0% 28%
Morgan Hill $90,487,166 $364,993,516 $5,355,632 $450,125,050 1% 4%
Mountain View $622,073,779 $2,816,073,919 $841,589,521 $2,596,558,177 6% 0%
Palo Alto $304,378,742 $3,480,754,920 $1,263,999,925 $2,521,133,737 6% 0%
San Jose $2,744,139,750 $9,791,133,329 $349,253,261 $12,186,019,818 30% 0%
Santa Clara $2,443,027,690 $8,078,821,978 $410,327,855 $10,111,521,813 25% 1%
Saratoga $15,264,024 $50,249,363 $13,750,405 $51,762,982 0% 0%
Sunnyvale $1,826,141,010 $3,707,605,550 $73,553,836 $5,460,192,724 14% -4%
Unincorporated $266,460,794 $1,317,333,573 $944,404,108 $639,390,259 2% 18%
Total $10,052,311,600 $34,403,338,960 $4,055,635,235 $40,400,015,325
20
Santa Clara County Assessor’s Annual Report 2021-22 Santa Clara County Assessor’s Annual Report 2021-22
21
25 Assessment
TOP Companies 2021-2022
Just two percent of all businesses account for over three quarters of the assessed value of business personal
property. Below are the top 25 companies in Santa Clara County as of the Lien Date, January 1, 2021, ranked
by the gross assessed taxable value of business property, including computers, machinery, equipment, fixtures,
and furniture, ranging from $181 million to $4.4 billion. All business property is assessed annually at market
value. [Note: The ranking only includes business property and does not include the assessed value of real property
or exempt value.]
Rank
Name
Last
year
rank
1 APPLE COMPUTER, INC. 1
2 CISCO SYSTEMS, INC. 2
3 GOOGLE, LLC 3
4 INTEL CORPORATION 4
5 MICROSOFT CORPORATION 5
6 APPLIED MATERIALS, INC. 6
7 NVIDIA CORPORATION 7
8 LOCKHEED MARTIN CORPORATION 10
9 HGST, INC. 11
10 VANTAGE DATA CENTERS 4, LLC 9
11 INTUITIVE SURGICAL, INC. 8
12 EQUINIX, LLC 12
13 A100 US, LLC 17
Rank
Name
Last
year
rank
14 HEADWAY TECHNOLOGIES, INC. 26
15 KLA CORPORATION 14
16 PALO ALTO NETWORKS, INC. 16
17 XERES VENTURES, LLC 15
18 HEWLETT PACKARD ENTERPRISE COMPANY 18
19 FORTY NINERS SC STADIUM COMPANY, LLC 24
20 HP, INC. 13
21 ADOBE, INC. 19
22 2016 ESA PROJECT COMPANY, LLC 21
23 WESTERN DIGITAL TECHNOLOGIES, INC. 20
24 GILEAD SCIENCES, INC. 35
25 SYNOPSYS, INC. 25
Appeals Process
In Santa Clara County, a Notification of Assessed Value, indicating the assessed (taxable) value of each property, is
mailed in June to all property owners on the secured roll. A taxpayer who disagrees with the assessed value is encouraged
to take advantage of the Assessor’s online tool at www.sccassessor.org. Last year, approximately 360,000
property owners were able to review the comparable sales used to determine their assessment. Property owners can
also request an informal review before August 1. If the Assessor agrees that a reduction is appropriate, an adjustment
is made prior to the mailing of the property tax bill in October.
If a difference of opinion still exists, the taxpayer may file a free, formal assessment appeal online at www.sccgov.
org/assessmentappeals. The appeal is then set for hearing before the local, independent Assessment Appeals Board.
In Santa Clara County, an appeal must be filed between July 2 and September 15 with the Clerk of the Board
(Clerk to the County Board of Supervisors). State law requires that all assessment appeals be resolved within two
years of filing, unless the property owner signs a waiver of the statute. To appeal a roll change or supplemental
assessment, typically triggered by a change in ownership, audit, or completed new construction, the appeal must be
filed within 60 days of the date of the notice of the supplemental assessment.
Homeowners filing an appeal are encouraged to request a hearing before a Value Hearing Officer. This streamlined
program was created with homeowners in mind and is designed to help process resolution of residential assessment
appeals. On average, residential appeals were resolved within 17 months in the last fiscal year, longer than
usual because of the mass cancellations of hearings last year due to COVID-19.
If the Assessment Appeals Board or Value Hearing Officer renders a decision granting a temporary reduction in
value Prop. 8, then the value and the corresponding reduction in property taxes apply only to the property tax due
for the year the application was filed.
Business and Personal Property Distribution of Value by Type
Property Type Gross Secured Gross Unsecured Exemptions Net Total
% of Value Number of
Value Growth Assessments
Aircraft $386,591 $997,746,087 $713,177 $997,419,501 2% -5% 716
Apartments $166,666,154 $18,509,425 $10,989,570 $174,186,009 0% -1% 993
Boats $49,384,666 $0 $49,384,666 0% 11% 1,822
Computer Manufacturers $1,629,868,734 $5,052,788,329 $0 $6,682,657,063 17% 3% 225
Electronic Manufacturers $2,191,525,823 $3,695,381,780 $0 $5,886,907,603 15% -7% 829
Financial Institutions $11,671,782 $231,860,909 $0 $243,532,691 1% -1% 516
Leased Equipment $1,046,712,278 $6,651,758 $1,040,060,520 3% -11% 6,353
Mobile Homes $865,664,756 $1,665,691 $863,999,065 2% 8% 11,542
Other $661,762,579 $4,428,144,309 $2,667,613,802 $2,422,293,086 6% 47% 1,596
Other Manufacturing $1,022,512,729 $2,220,017,493 $4,525,637 $3,238,004,585 8% 5% 2,335
Professional Services $2,682,759,624 $13,060,670,592 $1,348,915,421 $14,394,514,795 36% -5% 11,584
Retail $142,492,314 $2,505,321,244 $14,560,179 $2,633,253,379 7% -5% 6,789
Semiconductor Manufacturing $677,000,514 $1,096,801,848 $0 $1,773,802,362 4% 2% 35
Total $10,052,311,600 $34,403,338,960 $4,055,635,235 $40,400,015,325 45,335
City
Assessment Appeals Filed in 2020-2021
Non-Residential
Residential
Sum at Risk Appeals Sum at Risk Appeals
Campbell $487,313,570 58 $19,730,243 47
Cupertino $2,880,337,491 115 $54,998,785 99
Gilroy $270,472,655 62 $4,217,188 23
Los Altos $74,427,333 30 $83,274,388 106
Los Altos Hills $4,370,000 2 $107,600,798 63
Los Gatos $238,734,182 46 ($4,760,877) 64
Milpitas $2,676,355,085 138 $19,243,478 91
Monte Sereno $17,182,184 19
Morgan Hill $65,356,309 52 $10,643,277 27
Mountain View $1,539,895,846 141 $37,965,257 96
Palo Alto $1,886,041,717 136 $232,354,520 195
San Jose $8,002,176,835 900 $170,515,982 640
Santa Clara $6,625,898,349 289 $20,350,990 107
Saratoga $23,482,772 12 $95,963,759 121
Sunnyvale $4,972,293,626 295 $59,749,089 196
Unincorporated $168,451,454 79 $87,082,892 131
Waiting for Validation $216,589,015 34
Total $30,132,196,239 2,389 $1,016,111,953 2,025
Should the Assessment Appeals
Board order a change in the base
year value set by the Assessor for
new construction or a change in
ownership, the reduction in value
applies to the tax bill(s) for the year
the application was filed, and establishes
a new base year value for the
future. When a taxpayer disputes
the Assessor’s decision to reassess
a change in ownership, the matter
is heard and adjudicated by an independently
appointed, legal hearing
officer. Between July 1, 2020
and June 30, 2021, the Assessor’s
Office resolved 2,587 appeals. Over
90 percent of enrolled assessed values,
disputed by appellants, were
preserved by the Assessment Appeals
Board and the Value Hearing
Officers. The Clerk of the Board’s
Office held 27 additional hearings
to the regular schedule in the fiscal
year in order to “catch up” with the
cancelled hearings in early 2020.
22
Santa Clara County Assessor’s Annual Report 2021-22 Santa Clara County Assessor’s Annual Report 2021-22
23
Appeals Filed
Modest Increase in Appeals Applications Indicative of Strong Underlying Economy
Though the fiscal year began with COVID-19, the public health shelter-in-place orders newly in effect, and with
much uncertainty facing the economy, the number of assessment appeals applications filed for the period increased
only modestly, from 3,455 to 3,612, a 4.5 percent increase. However, the value at risk, compared year to
year, increased 18 percent mostly due to commercial and industrial filings. The assessed value of appeals filed by
five companies—Apple, Hitachi, Juniper Networks, Applied Materials and SF Forty-Niners— totals just over $37
billion in disputed value. Due to the strength of the residential real estate market, the relative value of its value in
dispute is small.
The total amount of assessed value in dispute
filed by commercial property owners
was $30.1 billion in 2020-21. As appeals
filed by major corporations can include
multiple years and take longer to resolve, the
total assessed value in dispute has continued
to increase at a faster pace than the appeals
resolved annually. In 2021, the top 25
companies with the highest assessed values
in dispute totaled $66.5 billion. Eight years
ago, the total was $27 billion. Ten companies
account for 79 percent of the total value in
dispute, ranging between $2.3 billion and
$16.7 billion. In total, the amount in dispute
as of July 1 was $100 billion.
10,000
9,000
8,000
7,000
6,000
5,000
4,000
All Appeal Applications Filed Comparison
Valid Assessment Appeals Filed
Year Appeals Total Local Roll Value at Risk % at Risk
2020 3,612 $551,542,708,166 $25,999,965,821 4.71
2019 3,524 $516,068,803,614 $20,946,681,786 3.80
2018 3,061 $483,248,439,238 $21,140,364,864 4.37
2017 2,992 $450,190,625,516 $23,407,192,356 5.20
2016 3,871 $419,270,051,518 $24,197,544,372 5.77
2015 3,549 $388,335,251,577 $25,779,884,633 6.64
2014 5,004 $357,339,245,945 $25,274,187,756 7.07
2013 5,693 $334,580,873,994 $23,595,764,078 7.05
What our Customers are Saying
Courteous 96%
Professional 95%
Prompt 95%
Overall Satisfaction 95%
Quick Courteous
Professional
Wonderful
Service
Customer
Service
Supportive
Clear
Kind
Efficient
Patient
Respectful
Diligent
In 2020, the Assessor’s Office shifted to electronic customer satisfaction surveys away from more costly and cumbersome
paper and telephone tools. The surveys continue to measure clarity of information, courtesy, helpfulness,
professionalism, promptness, and overall satisfaction.
Reaching Out to the Community
Informative
County Assessor Larry Stone enjoys speaking to neighborhood associations,
realtors, business organizations, and civic groups like Rotary, City Councils,
School Boards, and Chambers of Commerce. Last year, he delivered over 50
speeches. To request the Assessor to speak, go to www.sccassessor.org.
3,000
2,000
1,000
0
2010 2011 2012 2013 2014 2015 2016 2017 2018 2019 2020
Appeals by all other taxpayers Appeals by owners of residential properties Total Appeals Resolved
“Mr. Larry Stone’s
speech was very
powerful, informative
and helped a lot.”
24
Santa Clara County Assessor’s Annual Report 2021-22 Santa Clara County Assessor’s Annual Report 2021-22
25
Performance Counts
Led by County Assessor Larry Stone, the Assessor’s Office has implemented an ambitious performance-based
budgeting and management initiative. Based on the simple idea that what gets measured gets done, the Assessor’s
Office has a clear mission statement and measurable performance indicators designed to quantify improvement
over time, all tied directly to the budget.
Performance Measures
The following are the Assessor’s comprehensive performance measures for Fiscal Year 2020-21. By reporting
high-level quantitative and qualitative data that track levels of customer satisfaction, timeliness of product delivery,
accuracy of assessments and overall efficiency, these measures allow the Assessor to identify and record
service levels from year to year, designed to achieve specific continuous improvement objectives. The data is
compiled from the results of similar, more detailed measures in each Division of the Assessor’s Office. The performance
measures were developed in collaboration with both line staff and managers.
Property Assessment Monthly Calendar
Jan. 1: Lien Date
for next assessment
roll year.
This is the time
when taxes for
the next fiscal
year become a
lien on the property.
Feb. 15:
Deadline
to file all
exemption
claims.
Apr. 1: Due date for filing
statements for business personal
property, aircraft and boats.
Business property owners must
file a property statement each
year detailing the cost of all
supplies, machinery, equipment,
leasehold improvements,
fixtures and land owned at
each location within Santa
Clara County.
Apr. 10: Last day
to pay second installment
of second
property taxes without
penalty. This tax
payment is based on
property values determined
for the Jan.1
Lien Date of the year
prior.
1. Completed 99.1 percent of assessments
The assessment roll is the basis by which property taxes are levied. The completeness of the assessment roll
assures public agencies dependent upon property tax revenue that the assessment roll accurately reflects current
market activity.
2. Delivered supplemental assessments to the Tax Collector in an average of 171 days
Supplemental assessments occur upon a “change in ownership” or “new construction” of real property. This
performance measure ensures timely notification to those property owners who acquire or complete new construction
on their property.
3. Resolved all Assessment Appeals in an average of 640 days
By statute, assessment appeals must be resolved within two years of filing, unless a waiver is executed by the
taxpayer. This performance measure ensures a timely equalization of assessments for property owners. The average
number of days to resolve a residential appeal was 502 days.
4. Earned a 99.3 percent customer satisfaction rating from all office surveys
This outcome measures cumulatively the satisfaction level of both our internal and external customers who rely
on the Assessor for timely service and accurate information.
5. Managed resources with total expenditures at 96.3 percent of budget
The budget/cost ratio compares the department’s actual bottom line expenditures at the end of the fiscal year to
the budget to ensure that costs do not exceed anticipated resources.
Cost Accounting
May 7: Last day
to file a business
personal property
statement
without incuring
a 10 percent
penalty.
Aug. 1: Last
day to request
an informal
Proposition 8
review.
Jun. 30: Annual mailing of
assessment notices to all Santa
Clara County property owners on
the secured roll stating the taxable
value of the property. Owners who
disagree with the Assessor’s valuation
are encouraged to contact us,
via the website, prior to August 1
to request a review.
Aug. 31: Last
day to pay unsecured
property
taxes.
Sep. 15: Last day
to file an Assessment
Appeal application
for reduced
assessment on the
regular roll with the
Clerk of the Board
of Supervisors.
Jul. 1: Close of assessment
roll and the start
of the new assessment
roll year. The assessment
roll is the official
list of all assessable
property within the
County.
Jul. 2: First day to
file an Assessment
Appeal with the
Clerk of the Board
of Supervisors.
A critical component of the Assessor’s performance-based budget and management system is the comprehensive
cost accounting system that allows the Assessor to financially account for nearly every task performed by office
staff. The data captures the fully loaded cost, including compensation, benefits, overhead, etc., of activities such
as the cost of a residential or commercial appraisal, or an audit of a major company.
Managers use the cost accounting data to measure performance and establish quality standards, allocate work
assignments, and measure completion rates. Managers are able to review hours worked, essential for calculating
the cost per unit. This information is critical for achieving increased productivity, and improving customer
service to property owners, taxpayers, and public agencies that depend on property tax revenue.
Mid-Oct.:
Tax Collector
sends property
tax bill.
Dec. 10: Last day
to pay first installment
of secured
property taxes
without penalty.
26
Santa Clara County Assessor’s Annual Report 2021-22 Santa Clara County Assessor’s Annual Report 2021-22
27
Business Division
(Business Personal Property - BPP)
Division Description - Responsible for locating, valuing and
enrolling all taxable business personal property, including
property (owned and leased) such as computers, supplies,
machinery, equipment, and fixtures, as well as mobile homes,
airplanes and boats. The Division is responsible for the
administration of assessment appeals involving business
personal property. Once every four years, most businesses
with personal property are subject to audit. Ninety-two percent
of all personal property is owned by five percent of all business
entities.
Staff Composition - In addition to clerical staff, there were
46 certified auditor-appraisers, including 36 employees who
have advanced certification awarded by the State Board of
Equalization. The staff is comprised of accountants and experts
skilled in auditing and assessing high-tech businesses.
Major Accomplishments
Business Assessments on Secured Roll
Mobile Home Parcels Assessed
(BPP) Appraisals Enrolled
Total Business Personal Property (BPP)
Assessment Activities
Business Audits
2020-2021
2,297
11,452
51,891
61,078
711
2021-2022
2,305
11,542
50,746
ASSESSOR
ASSISTANT ASSESSOR
57,979
Division Description - The Administration Division implemented
and monitored teleworking policy, administered new supplemental
leave policies, procured a myriad of COVID-19 safety
supplies, facilitated emergency administration of excess shots,
monitored vaccination and emergency notification in case of
infections, prepared the annual budget and administered the
Voluntary Separation Incentive Program. The Division was
instrumental to the success of the office’s adaptation to the
COVID-19 crisis.
Staff Composition - A staff of ten includes two certified
appraisers and one advanced certified appraiser who are
certified by the State Board of Equalization. Employees
possess backgrounds in assessment operations, policy
development, strategic planning, communications, fiscal
and contract management, accounting, and personnel.
Major Accomplishments
The Administration Division implemented and monitored
teleworking policy, administered new supplemental leave
policies, procured a myriad of COVID-19 safety supplies, facilitated
emergency administration of wastage shots, monitored
vaccination and emergency notification in case of infections,
prepared the annual budget and administered the Voluntary
Separation Incentive Program. The unit was instrumental to
the success of the office’s adaptation to the COVID-19 crisis.
Assessor’s Office (as of 6/30)
Actual Expenses
Authorized Positions
ORGANIZATIONAL OVERVIEW
Administration Division
2019-2020
$41,223,606
274
2021-2022
$43,310,122
249
DEPUTY ASSESSOR
Assessment Standards, Services,
and Exemptions Division
Division Description - Responsible for locating and identifying
ownership and reappraisability of all taxable real property, as
well as approving and enrolling all legal property tax exemptions.
Professional staff members monitor assessment appeal
information; process legal appeals; maintain and update
assessment maps; manage the public service center,
document imaging center; and oversee quality control.
Staff Composition - A majority of the divisional staff members
possess expert knowledge in exemption law, cartography and/
or the legal complexities of property transfers. In addition, 16
employees are certified as Assessment Analysts and one
staff member is a State Board of Equalization certified advanced
appraiser.
Major Accomplishments
Ownership Title Documents Processed
Organizational Exemption Claims
Parcel Number Changes
Reassessment Parent/Child Exclusions
2020-2021
65,112
4,232
2,106
2,866
Real Property Division
Division Description - Responsible for valuing and enrolling
all taxable real property (land and improvements). The Division
provides assessment-related information to the public, and
cooperates with other agencies regarding assessment and
property tax related matters.
Staff Composition - In addition to clerical staff, there are
85 certified real property appraisers, including 66 appraisers
who hold advanced certificates issued by the State Board of
Equalization.
Major Accomplishments
2020-2021
Real Property Parcels
483,413
Reappraisable Changes of Ownership 18,641
Permits Processed
24,870
Temporary Decline in Value Parcels 10,617
Parcels with New Construction
8,526
Information Systems Division
2021-2022
59,130
4,092
1,314
3,216
2021-2022
483,688
19,378
26,932
7,707
6,875
Division Description - Responsible for providing systems
support to all other divisions in the pursuit of preparing and
delivering the secured, unsecured and supplemental
assessment rolls.
Staff Composition - The staff is composed of business
systems analysts, full stack developers, technology architects,
systems administrators, and IT service specialists, as well as
management staff. The staff has a broad knowledge of application
development, network administration, and maintenance
of legacy systems. This unit is an independent Information
Services group reporting directly to the Assessor.
Major Accomplishments
Developed and implemented new workflow for Business
Property Statement processing and assessment; a modern
document management system; conversion of legacy files
to the new system; internal comprehensive customer service
survey measurement system; and partial implementation of a
new commercial/industrial appraisal system.
The Assessor’s Team
Here to Help
James Abe, Raji Abraham, Shalini Agrawal, Linda Aguilar,
Annabelle Alquiza, Medel Angel, Rafael Aranda, Norman Arias,
Michael Arriola, Audrey Atkins, Tuan Au, Anita Badger, Jeffrey
Barlow, Julie Barraza, Deborah Bathurst, Feliza Bautista, Melvin
Bautista, Jeannie Bauzon, John Belo, Alana Beltran-Balagso, Janeth
Berg, Neeraj Bhardwaj, Matthew Boxberger, Jon Bredeson, Khoi
Bui, Phoebe Cabaluna, Charmaine Cabuag, Simon Calaunan, Carol
Callahan, Mia Campana, Jackie Cantu, Jocelyn Champlin, Deborah Chavez,
Joshua Chen, Win Chen, Min Cheng, Arthur Chien, Bordon Chin, Queenie Ching, Jae Choe, Mei Chou, Dawn Cieslik, Dick
Cloyd, Daniel Cooper, Kent Corey, Domonique Craft, Melody Dejesus, David Del Real, Barry Delfin, Sourita Dey, Chris Dickson,
Deborah Dini, James DiTomaso, Sall Duke, Tara Duncan, James Duong, Thy Duong, Tony Duong, Soman Easaw, James Egan,
Gloria Elia, Sandra Emerson, Cathleen Espinoza, Aaron Feldman, Cecilia Feng, Richard Fisher, Ibrahim Fofanah, Henderson Ford,
Gemma Foster, Maria Galeana Castillo, Nora Galvez, Leo Garcia, Gabriel Garcia, Joseph Garcia, Lizuarte Garcia, Maylina Garcia,
Jack Gaskins, Matthew Gleason, Vipin Goel, Sally Gonzaga, Manuela Gonzalez, Teresa Gonzalez, James Gray, Russel Gray, Jared
Gregory, Maria Salome Grepo, Kevin Gruidl, Evguenia Guilbert, Xin Guo, Brook Haile, Virginia Hamley, Cara Heaney, Brenda
Hidalgo, Julius Ho, Stella Hong, Joshua Howell, Jau-Horng Hsu, Christopher Hughes, Jenny Huynh, Tri Huynh, Yong Jin Im,
Julie Jacobson-Gentry, Patricia Jadrich, Michelle Jergensen, Carlos Jimenez, David Johnston, Elaine Kan, Dae-Sun Kang, Karen
Klein, Karen Kloster, Michael P Kofnovec, Meiyee Kong, Melissa Kong, James Kostmayer, Jeffrey Kwan, Wei Jim Lai, Lori Lammle,
Ching-Fu Lan, Arnold Lau, Kathleen LeGrande, Young Lee, Kristen Leglu, Bertha Legorreta, Amber Leon, Richard Leong,
Matthew Leslie, Elizabeth Leyva, Thida Lim-Santos, Steve Lin, David Liu, Carl Lombard, Vanessa Lopez, Vickie Lopez, Fraser
Louie, Kari Luescher, Brett Lunceford, Melody Luong, David Luu, Trinh Luu-Nguyen, Teresa Macy, Amy Martinez, Frank Masi,
Eric Matsuda, Aden Mengistie, Nedra Millwood, Tiffany Ming, Carol Mondino, Dulce Monsivais-Lopez, Gregory Monteverde,
Hazel Morales, Susan Murphy, Jeannette Murray, Quoc Ngo, Bao Nguyen, Caroline Nguyen, Davis Nguyen, Linda Nguyen, Loan
Nguyen, Wayne Nguyen, Y Nguyen, Diane Paskert, Swathi Pathak, David Peak, Sylvia Pedraza, Thuy Pham, Phu Phan, Michelle
Pine, Chris Piscitelli, Janene Pratt, Lynn Quan, Noe Quinanola, Deepali Raisinghani,
Michael Randle, Shashank Ranjan, John Recchio, Alfredo Resurrecion, Roy
Rivas, Shellsy Rizo, Juan Rodriguez, Emilie Roy, Marie Rueda, Maria Sarabia, Selu
Sataraka, Sheryl Schenkman, Laura Scott, Kristina Seldal, Alfredo Semene, Chetan
Shah, Naren Shah, David Shank, Vijay Shankarappa, Mai Shearer, Tommy Shing,
Anil Siddam, Esmeralda Silveira, John Sleeman, Hector Solorzano, Cheryl Soriano,
Debra Spolski, Kim Starrett, Marian Stewart, Lawrence E Stone, Roopa
Subramanian, Christine Swensen, Michael Swigart, Khadiza Tahera, Marcus Tai,
Kim Tang, Kevin Tanner, Jasmine Ting, Khanh Tran, Natalie Tran, Peter Tran, Tran
Tran-Galligan, Shradha Upadhyay, Carmen Valles, Susan Vasconcelos, Malthi
Venkateswaran, Jackie Ventimiglia, Athena Wang, Wendy Watson, Joseph White,
David Wierzba, Rob Willet, Mullissa Willette, Yeongtyan Wong, Richard Xavier,
Wen Xia, Vanessa Yang, Autumn Young, Guillermo Young, Michelle Zaffa, Eric
Zamudio, Jennifer Zenni, Diane Zertuche, Jinlin Zhang, Li Zhao, Veronica Zuniga
Acknowledgments:
STAFF Composition
White
Female
53.25%
Male
46.75%
30%
Caucasian 30%
STAFF COMPOSITION
Hispanic
Hispanic 14% 13%
Black
4% Black 4%
Editors: Greg Monteverde–Assistant Assessor, Autumn Young–Deputy Assessor; Lori Lammle–Confidential Secretary; Henderson
Ford IV–Graphic Designer; Alana Beltran-Balagso–Assistant Editor
Printing: Santa Clara County Printing Services
Disclaimer: This document presents a distribution of the 2021-2022 Santa Clara County property tax local assessment roll by City/Redevelopment Successor Agency and major property types. It does not include state-assessed
property (unitary roll). It is not the source document for deriving the property tax revenues to be received by any public entity. For example, the Controller’s AB8 calculations do not include aircraft assessed
valuation, which is incorporated into this report. Numbers reported in tables and charts reflect up to 0.01 units. Items less than 0.01 units have been reported as a dash. Minor discrepancies may occur due to rounding
calculations and/or clarification in definition of terms. Published November 2021.
Asian
52%
Asian 52%
28
Santa Clara County Assessor’s Annual Report 2021-22 Santa Clara County Assessor’s Annual Report 2021-22
29
Net Secured Assessed Value (AV) and Number of Parcels (APN) by City and Property Type
30
Homeowner
Exemption
Other
Exemption
Net Secured
Single-Family and
Condo Housing
Office Retail
Multifamily
Housing
Mobile Home
Industrial &
Manufacturing
Agricultural &
Miscellaneous
Row
Type
City
APN 157 289 108 756 218 260 10,529 12,317 113 5,868
AV $180,440,327 $677,707,646 $14,086,866 $1,609,072,896 $981,923,231 $945,451,290 $7,600,254,429 $12,008,936,685 $219,028,491 41,654,200
Campbell
APN 223 59 579 225 148 15,375 16,609 79 9,369
AV $168,735,197 $1,175,857,454 $1,522,720,366 $6,750,140,207 $1,381,256,846 $16,084,758,820 $27,083,468,890 $144,598,228 65,573,200
Cupertino
APN 638 224 171 648 100 317 12,724 14,822 145 6,645
AV $398,044,868 $663,475,908 $12,857,655 $553,306,787 $109,883,355 $960,642,346 $7,270,687,750 $9,968,898,669 $387,411,769 46,512,200
Gilroy
APN 152 30 138 281 176 10,366 11,143 72 6,712
AV $88,604,421 $16,008,337 $286,676,072 $614,362,323 $441,934,565 $17,254,569,211 $18,702,154,929 $452,848,914 46,977,000
Los Altos
APN 207 21 1 2,998 3,227 14 1,879
AV $260,055,885 $2,830,441 $42,176 $9,059,187,930 $9,322,116,432 $37,860,867 13,153,000
Los Altos Hills
APN 355 55 58 454 277 211 9,695 11,105 71 5,814
AV $325,282,988 $200,280,590 $4,796,786 $723,982,596 $1,181,649,332 $593,398,580 $12,224,851,732 $15,254,242,604 $372,494,714 40,691,000
Los Gatos
APN 388 398 399 373 177 189 18,394 20,318 120 9,594
AV $534,413,858 $4,194,667,388 $28,764,486 $2,218,321,494 $322,026,130 $1,454,897,952 $11,674,217,753 $20,427,309,061 $331,226,614 67,145,400
Milpitas
APN 37 2 1,252 1,291 1 777
AV $21,404,832 $2,611,199 $2,541,219,730 $2,565,235,761 $897,205 5,439,000
Monte Sereno
APN 475 234 450 323 98 221 11,790 13,591 123 7,002
AV $441,476,330 $850,922,352 $39,235,162 $518,036,573 $136,702,795 $553,610,543 $8,579,713,794 $11,119,697,549 $338,462,027 49,918,400
Morgan Hill
APN 280 339 840 1,517 413 386 16,917 20,692 110 9,702
AV $1,989,409,821 $4,762,977,834 $73,164,829 $5,611,189,997 $6,232,025,564 $1,531,263,278 $15,358,776,390 $35,558,807,713 $694,118,279 67,943,400
Mountain View
APN 487 174 8 838 577 384 18,244 20,712 311 10,852
AV $431,341,181 $2,047,665,001 $120,444 $2,377,085,739 $7,246,290,199 $1,844,148,494 $27,797,214,510 $41,743,865,568 $7,342,627,583 75,959,800
Palo Alto
APN 3,846 2,819 6,672 11,013 2,163 3,240 217,848 247,601 1,597 121,629
AV $5,609,676,181 $16,237,991,762 $427,700,710 $23,464,142,085 $14,051,824,195 $11,801,473,495 $134,692,560,212 $206,285,368,640 $6,268,308,908 852,710,600
San Jose
APN 456 941 1 2,010 291 433 25,599 29,731 256 13,533
AV $2,196,058,081 $9,748,911,591 $159,917 $6,172,115,168 $7,406,461,747 $1,926,117,117 $16,806,687,353 $44,256,510,974 $2,629,495,194 94,729,600
Santa Clara
APN 349 37 1 23 88 67 10,582 11,147 47 6,853
AV $215,706,749 $44,633,359 $64,329 $10,997,879 $165,948,299 $173,521,825 $16,886,118,796 $17,496,991,236 $240,878,095 47,965,400
Saratoga
APN 287 557 2,796 2,125 356 415 29,364 35,900 148 18,552
AV $682,452,420 $10,829,083,231 $261,156,321 $7,340,887,428 $9,210,146,676 $2,338,070,100 $23,246,850,820 $53,908,646,996 $658,149,776 129,918,600
Sunnyvale
APN 6,919 318 38 311 30 122 17,960 25,698 333 10,798
AV $2,965,361,724 $214,054,027 $1,849,384 $168,595,225 $26,152,528 $135,815,410 $16,597,249,634 $20,109,077,932 $7,904,282,076 75,565,000
Unincorporated
Santa Clara County Assessor’s Annual Report 2021-22 Santa Clara County Assessor’s Annual Report 2021-22
Net Secured Assessed Value (AV) and Number of Parcels (APN) by High School and Elementary Districts and by Major Property Type
Total
Value
Growth
Homeowner
Exemption
Other
Exemption
Non-Residential Net Secured Net Unsecured Grand Total
Single-Family
Housing
Multifamily
Housing
Row Type Mobile Home
Elementary
School
District
Campbell Union High School District
AV $132,062,999 $279,975,506 $76,642,047 $488,680,552 $3,708,257 $492,388,809 $9,775,629 $1,855,000 4%
APN 179 597 115 891 4 265
Burbank
AV $4,882,753 $706,036,055 $5,633,438,787 $1,246,574,035 $7,590,931,630 $124,827,714 $7,715,759,344 $95,022,715 $33,012,000 5%
APN 25 472 8,326 494 9,317 43 4,634
Cambrian
AV $14,765,331 $4,145,278,554 $15,989,818,988 $6,239,951,284 $26,389,814,157 $805,250,148 $27,195,064,305 $686,105,498 $81,561,200 4%
APN 135 2,368 21,165 1,499 25,167 201 11,651
Campbell
Union
AV $1,511,196,587 $7,920,735,832 $1,203,265,934 $10,635,198,353 $131,495,790 $10,766,694,143 $156,853,326 $44,987,600 5%
APN 1,091 10,772 305 12,168 57 6,425
Moreland
AV $32,860 $352,651,714 $10,434,849,675 $908,089,406 $11,695,623,655 $90,309,624 $11,785,933,279 $105,225,388 $58,037,000 6%
APN 1 378 13,650 257 14,286 72 8,292
Union
Elementary
Total AV $19,680,944 $6,847,225,909 $40,258,818,788 $9,674,522,706 $56,800,248,347 $1,155,591,533 $57,955,839,880 $1,052,982,556 $219,452,800
APN 161 4,488 54,510 2,670 61,829 377 31,267
East Side Union High School District
AV $5,930,732 $818,710,310 $8,507,026,787 $1,490,870,913 $10,822,538,742 $161,386,158 $10,983,924,900 $1,002,570,149 $70,397,600 4%
APN 132 865 19,778 1,153 21,928 224 9,874
Alum Rock
Union
AV $68,115 $906,559,678 $12,614,080,333 $956,245,020 $14,476,953,146 $211,087,341 $14,688,040,487 $181,010,129 $85,748,600 3%
APN 1 98 22,866 482 23,447 130 12,252
Berryessa
Union
AV $37,617,507 $200,753,203 $18,570,071,104 $1,611,756,056 $20,420,197,870 $178,956,775 $20,599,154,645 $284,626,684 $105,119,000 3%
APN 579 71 25,608 766 27,024 146 15,021
Evergreen
AV $134,042,636 $949,298,939 $7,339,419,073 $2,746,974,448 $11,169,735,096 $434,264,607 $11,603,999,703 $931,533,179 $58,240,000 4%
APN 2,237 938 15,240 1,677 20,092 134 8,321
Franklin
McKinley
AV $91,045 $14,711,159 $2,555,974,283 $175,370,514 $2,746,147,001 $9,158,309 $2,755,305,310 $24,806,255 $18,289,600 4%
APN 1 28 5,007 179 5,215 30 2,613
Mount
Pleasant
AV $98,521,508 $2,127,070,244 $14,025,733,764 $3,395,309,742 $19,646,635,258 $1,089,271,547 $20,735,906,805 $567,223,270 $101,948,000 5%
APN 1,352 518 26,281 572 28,723 159 14,556
Oak Grove
AV $51,994,684 $1,332,786,434 $1,679,776,618 $8,766,409,635 $11,830,967,371 $1,422,854,949 $13,253,822,320 $134,659,001 $11,645,200 3%
APN 913 32 2,373 1,332 4,650 25 1,664
Orchard
Total AV $328,266,227 $6,349,889,967 $65,292,081,962 $19,142,936,328 $91,113,174,484 $3,506,979,686 $94,620,154,170 $3,126,428,667 $451,388,000
APN 5,215 2,550 117,153 6,161 131,079 848 64,301
31
Net Secured Assessed Value (AV) and Number of Parcels (APN) by High School and Elementary Districts and by Major Property Type
Elementary School
District
Row
Type Mobile Home Multifamily
Housing
Single-Family
Housing
Non-Residential Net Secured Net Unsecured Grand Total Other Exemption
Fremont Union High School District
Homeowner
Exemption
Total
Value
Growth
Cupertino Union
Sunnyvale Elementary
AV $3,231,178,419 $36,408,809,830 $8,338,673,507 $47,978,661,756 $1,889,618,103 $49,868,279,859 $323,323,378 $159,210,800 5%
APN 1,561 36,419 1,262 39,242 146 22,746
AV $91,795,001 $5,167,183,094 $12,997,731,132 $19,708,454,178 $37,965,163,405 $3,157,968,689 $41,123,132,094 $452,521,885 $70,768,600 5%
APN 974 1,349 17,098 1,334 20,755 109 10,112
Total AV $91,795,001 $8,398,361,513 $49,406,540,962 $28,047,127,685 $85,943,825,161 $5,047,586,792 $90,991,411,953 $775,845,263 $229,979,400
Total APN 974 2,910 53,517 2,596 59,997 255 32,858
Gilroy Unified High School District
AV $13,531,497 $557,460,364 $8,520,865,295 $3,025,428,818 $12,117,285,974 $345,966,436 $12,463,252,410 $397,246,145 $54,538,400 4%
Gilroy Unified
APN 187 661 14,275 3,035 18,158 161 7,792
Los Gatos - Saratoga Joint Union High School District
Lakeside Union
Loma
Prieta Union
Los Gatos Union
Saratoga
AV $1,286,640 $150,876,489 $24,974,017 $177,137,146 $15,705 $177,152,851 $1,519,312 $749,000 5%
APN 1 175 122 298 2 107
AV $204,489 $254,997,274 $54,017,855 $309,219,618 $887,022 $310,106,640 $892,334 $1,425,200 6%
APN 2 329 245 576 1 204
AV $4,796,786 $434,370,307 $12,272,617,049 $1,989,510,143 $14,701,294,285 $235,513,811 $14,936,808,096 $258,478,988 $37,214,800 4%
APN 58 244 8,841 1,412 10,555 52 5,317
AV $64,329 $8,377,654 $12,993,176,722 $466,958,866 $13,468,577,571 $35,902,641 $13,504,480,212 $220,563,451 $30,713,200 4%
APN 1 17 6,913 564 7,495 33 4,388
Total AV $4,861,115 $444,239,090 $25,671,667,534 $2,535,460,881 $28,656,228,620 $272,319,179 $28,928,547,799 $479,934,773 $69,353,200
Total APN 59 264 16,258 2,343 18,924 86 9,909
Milpitas Unified High School District
Milpitas Unified
AV $28,818,926 $1,819,315,398 $11,532,793,015 $6,506,513,303 $19,887,440,642 $1,901,284,591 $21,788,725,233 $317,237,594 $67,131,400 4%
APN 400 368 18,219 1,420 20,407 122 9,592
Morgan Hill Unified High School District
Morgan Hill Unified
AV $40,059,349 $527,016,506 $12,566,720,623 $3,269,065,231 $16,402,861,709 $463,233,638 $16,866,095,347 $401,371,334 $72,835,000 5%
APN 466 342 17,475 3,384 21,667 174 10,277
Elementary School
District
Los Altos Elementary
Mountain View
Elementary
Row
Type
Mobile Home
Multifamily
Housing
Single-Family
Housing
Non-Residential Net Secured Net Unsecured Grand Total Other Exemption
Mountain View - Los Altos District
Homeowner
Exemption
AV $42,176 $1,584,274,555 $24,927,252,132 $2,447,329,135 $28,958,897,998 $254,959,234 $29,213,857,232 $629,015,893 $60,975,600 6%
APN 1 193 13,878 938 15,010 102 8,712
AV $73,164,829 $4,230,418,355 $12,879,911,137 $15,569,345,625 $32,752,839,946 $2,119,299,877 $34,872,139,823 $682,775,435 $57,562,400 7%
APN 840 1,411 14,396 1,386 18,033 98 8,219
Total AV $73,207,005 $5,814,692,910 $37,807,163,269 $18,016,674,760 $61,711,737,944 $2,374,259,111 $64,085,997,055 $1,311,791,328 $118,538,000
Total APN 841 1,604 28,274 2,324 33,043 200 16,931
Palo Alto Unified High School District
Total
Value
Growth
Palo Alto Unified
AV $120,444 $2,377,187,709 $32,010,282,267 $11,503,966,190 $45,891,556,610 $2,416,270,206 $48,307,826,816 $15,109,524,234 $84,849,800 4%
APN 8 857 20,079 1,786 22,730 506 12,122
Patterson Joint High School District
Patterson Joint
AV $649,226 $38,145,513 $38,794,739 $59,148 $38,853,887 $0 $154,000 -1%
APN 3 429 432 0 22
San Benito Joint Union High School District
North County Union Joint
AV $44,521,496 $44,521,496 $1,082,816 $45,604,312 $0 $42,000 2%
APN 220 220 0 6
San Jose Unified High School District
San Jose Unified
AV $36,550,024 $8,405,614,756 $41,083,064,087 $13,264,313,240 $62,789,542,107 $2,730,471,516 $65,520,013,623 $2,253,739,705 $233,982,000 5%
APN 470 4,880 60,443 4,604 70,397 526 33,423
Santa Clara Unified High School District
Santa Clara Unified
AV $227,108,533 $11,036,126,183 $19,524,271,836 $33,626,605,254 $64,414,111,806 $10,877,555,440 $75,291,667,246 $2,795,067,829 $118,862,800 3%
APN 2,762 2,184 29,431 2,644 37,021 283 16,972
Santa Clara County
Grand Total AV $863,999,065 $52,577,130,305 $343,674,918,864 $148,695,281,405 $545,811,329,639 $31,092,660,092 $576,903,989,731 $28,021,169,428 $1,721,106,800
Grand Total APN 11,543 21,108 429,637 33,616 495,904 3,538 245,472
32
Santa Clara County Assessor’s Annual Report 2021-22 Santa Clara County Assessor’s Annual Report 2021-22
33
Explanation of Terms*
*Explanation of terms are provided to simplify
assessment terminology, but do not replace legal
definitions.
Ad Valorem Property Tax
Taxes imposed on the basis of the property’s value.
Assessed Value (AV)
The taxable value of a property against which the tax
rate is applied.
Assessment Appeal
Due process initiated by taxpayer if the assessed value
of their property cannot be agreed upon with the Assessor.
Assessment Appeals Board (AAB)
A three-member panel appointed by the Board of
Supervisors to resolve disputes between the Assessor’s
Office and property owners. Qualifying property owners
may alternatively select a Value Hearing Officer (VHO),
who is typically a real estate professional, to hear their
appeal. The VHO process is considered an expedient
and convenient alternative to the more formal Board
proceedings, and may provide a faster resolution to an
appeal.
Assessment Roll
The official list of all property within the County assessed
by the Assessor.
Base Year Value (BYV)
The fair market value of a property at the time of the
1975 lien date, or on the date of the subsequent new
construction or change in ownership.
Basic Aid
“Basic Aid” school districts fund their revenue limit
entirely through property taxes and receive no general
purpose State aid.
Business Personal Property
Property which is movable and not affixed to the land,
and which is owned and used to operate a business,
such as machinery, equipment, computers, furniture and
supplies.
Change in Ownership
A transfer of real property resulting in the transfer of the
present interest and beneficial use of the property.
California Consumer Price Index (CCPI)
Determined annually by the California Bureau of Labor
Statistics.
Escaped Assessments
Assessments levied outside the normal assessment period for
the lien date(s) in question.
Exclusions
Qualifying transfers of real property which are excluded
from reappraisal if a timely claim is filed with the Assessor’s
Office.
Exemption
Legally qualified deduction from the taxable assessed value
of the property.
Factored Base Year Value (FBYV)
A property’s base value, adjusted annually by the change
in the CCPI, not to exceed 2 percent. It is the upper limit of
taxable value each year.
Fiscal Year
The period beginning July 1 and ending June 30.
Fixture
Tangible property securely affixed to real property.
Full Cash Value (FCV)
The amount of cash or its equivalent value that property
would bring if exposed for sale in the open market, and as
further defined in Revenue & Taxation Code §110.
Improvements
Buildings or structures generally attached to the land.
Lien
The amount owed and created by the assessment of the
property, or the amount levied against property by a taxing
agency or revenue district.
Lien Date
The date when taxes for any fiscal year become a lien on
property. The Lien Date for California property is 12:01 a.m.
January 1.
New Construction
The construction of new buildings, additions to existing
buildings, or alterations which convert the property to another
use or extends the economic life of the improvement.
Personal Property
Any property except real estate, including airplanes, boats,
and business property.
Possessory Interest (PI)
Interest of a lessee in government-owned property. Examples
of a PI include the exclusive right to use public property at
an airport, such as a car rental company’s service counter
or a concession stand at the county fair. In both cases, the
vendors are subject to property taxes.
Proposition 13 (Prop. 13)
Passed by California voters in June 1978, Proposition 13 is a
Constitutional amendment that limits the taxation of property
and creates a procedure for establishing the current taxable
value of locally assessed real property, referencing a base year
full cash value.
Proposition 8 (Prop. 8)
Passed by California voters in November 1978, Proposition 8
requires the temporary reduction in the assessed value when
there is a decline in market value below the property’s factored
base year value.
Real Property
Land that has been legally defined and improvements that have
been made to the land.
Secured Roll
Assessment roll on which the taxes are secured by a lien
against the real estate.
Special Assessments
Direct charges or flat fees against property which are included
in the total tax bill, but are not based upon the Assessor’s valuation
of the property. Examples are sewer charges or school
parcel taxes.
State Board of Equalization (BOE)
The Board consists of four members elected by California
voters by district, and the State Controller. Their duties include
administering various State taxes and fees, and serving as an
appellate body for property, business, and income tax assessments.
Through guidelines and rules, the Board promotes
uniformity in local assessment practices.
Supplemental Assessment
Upon a change of ownership or completion of new construction,
a supplemental assessment is issued in addition to the
annual regular assessment and is based on the net difference
between the previous assessed values and the new value for
the remainder of the assessment year(s).
Tax Rate
The ratio of the tax to the tax base. The minimum
ad valorem property tax rate is 1% of the net taxable
value of the property. The total tax rate may be higher
due to voter-approved general obligation bonds that
are secured by property taxes for the annual payment
of principle and interest.
Tax Roll
The official list of property subject to property tax,
together with the amount of assessed value and the
amount of taxes due, as applied and extended by the
Auditor/Controller.
Tax Rate Area (TRA)
A geographic area having the same property tax allocation
factors.
Transfer of Ownership
Change in ownership or change in manner in which
property is held.
Unsecured Roll
Assessment roll consisting largely of business personal
property on which the property taxes are not
secured by a lien against the real estate.
34
Santa Clara County Assessor’s Annual Report 2021-22 Santa Clara County Assessor’s Annual Report 2021-22
35
Office of the County Assessor
Lawrence E. Stone, Assessor
County of Santa Clara Government Center
70 West Hedding Street, East Wing, 5th Floor
San Jose, California 95110-1771
www.sccassessor.org
Santa Clara County Board of Supervisors
Mike Wasserman, District 1
Cindy Chavez, District 2
Otto Lee, District 3
Susan Ellenberg, District 4
Joe Simitian, District 5
County Executive
Dr. Jeffrey V. Smith
www.sccgov.org
General County financial information, including
taxes by tax rate areas and methods of property tax
revenue allocation:
Santa Clara County Finance Agency • (408) 299-5200
Santa Clara County Office of the Assessor:
Public Service • (408) 299-5500
Real Property (land and improvements)
(408) 299-5300 • rp@asr.sccgov.org
Personal Property, including Businesses,
Mobile Homes, Boats and Airplanes
(408) 299-5400 • busdiv@asr.sccgov.org
Property Tax Exemptions
(408) 299-6460 • exemptions@asr.sccgov.org
Change in Ownership Issues
(408) 299-5540 • propertytransfer@asr.sccgov.org
Mapping • (408) 299-5550 • mapping@asr.sccgov.org
Administration • (408) 299-5588 • Fax (408) 297-9526
Tax bills, payments, delinquency, or the phone number
of the appropriate agency to contact about a special
assessment:
Santa Clara County Department of Tax and Collections •
(408) 808-7900 • www.scctax.org
Filing Assessment Appeals:
Santa Clara County Assessment Appeals Board Clerk
(Clerk of the Board of Supervisors)
(408) 299-5088 • www.sccgov.org/assessmentappeals
Recording Documents:
Office of the County Clerk-Recorder
(408) 299-5688 • www.clerkrecorder.org
California State Board of Equalization:
The State Board of Equalization is responsible for assuring
that county property tax assessment practices are equal and
uniform throughout the state. For more information, contact
the State Board at (916) 274-3400, or www.boe.ca.gov.
Thank you for requesting a paper copy of the annual report.
Please e-mail us at assessor@asr.sccgov.org if your address has changed or to recieve
the report electronically. Scan the QR code to download this report in pdf format.