Santa Clara County Assessor's Annual Report
Each year the Santa Clara County Assessor’s Office prepares an Annual Report available in hard copy and electronic versions. The report offers comprehensive statistical analysis of the local assessment roll, including all real and business property, legal exemptions, and assessment appeals. Assessment information is provided by property type, city, and school district. The Assessor’s Annual Report is an important source of information for public finance officials, real estate professionals, tax experts, academics, as well as business, government, and community leaders seeking insights into real estate trends in Santa Clara County.
Each year the Santa Clara County Assessor’s Office prepares an Annual Report available in hard copy and electronic versions. The report offers comprehensive statistical analysis of the local assessment roll, including all real and business property, legal exemptions, and assessment appeals. Assessment information is provided by property type, city, and school district.
The Assessor’s Annual Report is an important source of information for public finance officials, real estate professionals, tax experts, academics, as well as business, government, and community leaders seeking insights into real estate trends in Santa Clara County.

You also want an ePaper? Increase the reach of your titles
YUMPU automatically turns print PDFs into web optimized ePapers that Google loves.
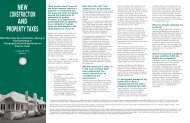
How are tax bills calculated?
Once the Assessor delivers the annual roll to the County Finance Agency, they calculate and issue property tax bills in
early October. Property taxes are calculated by multiplying the basic one percent tax rate plus the annual rate to service
each jurisdiction’s payment on general obligation bonds, special fees, and any other bonded indebtedness imposed by
public agencies and approved by the voters. Property tax revenue supports K-12 school and community college districts,
as well as local government agencies including cities, the county and special districts. Redevelopment Successor Agencies
continue to receive a portion of property taxes to service outstanding debt incurred by Redevelopment Agencies
while they existed.
The annual assessment roll is the foundation of the property tax system and as such it must be complete, accurate and
consistently delivered to serve the community and agencies that depend on the revenue it generates. The Assessor’s Office
does not calculate or collect taxes, nor does the Assessor forecast or allocate tax revenues. For information regarding
the collection of and allocation of property taxes, please visit the Department of Tax and Collections (DTAC) online at
www.scctax.org or call (408) 808-7900.
Where do my
property taxes go?
6
K-12 Public
44%
Top 15 Taxpayers for Santa Clara County for FY 2020-2021
Firm Type of Business Assessed Value Taxes Paid
GOOGLE, INC. Internet $8,831,675,833 $105,798,878
PACIFIC GAS & ELECTRIC CO. Utilities $2,511,014,384 $66,251,127
CAMPUS HOLDINGS, INC. Computer Manufacturing $3,652,054,476 $43,287,876
APPLE COMPUTER, INC. Computer Manufacturing $1,932,561,304 $23,088,583
CISCO TECHNOLOGY, INC. Computer Manufacturing $1,517,606,211 $18,124,359
WESTFIELD MALLS Retail $1,198,731,500 $15,520,732
APPLIED MATERIALS, INC. Chip Manufacturing Equipment $1,145,700,280 $13,515,188
INTEL CORPORATION Chip Manufacturing $1,090,141,602 $12,899,044
LOCKHEAD MARTIN Aerospace $891,098,033 $10,589,600
ESSEX PORTFOLIO LP Real Estate Management $836,678,920 $10,024,615
FRIT SAN JOSE TOWN & COUNTRY VILLAGE, LLC Corporate Service Company $655,151,539 $9,783,950
PACIFIC BELL TELEPHONE CO. DBA AT&T CA Communications $376,145,984 $9,734,644
INTUITIVE SURGICAL, INC. Medical Device Manufacturer $491,514,374 $9,239,254
CW SPE, LLC LLC $771,596,716 $9,093,267
GP IX SAC II PROPERTIES, LLC LLC $745,701,200 $8,942,406
Santa Clara County Average Property Tax Revenue Allocation 2021-2022
The County Assessor’s Office does not calculate taxes or allocate tax revenues.
County
18%
*Image compliments of Sunnyvale Heritage Park Museum
Cities*
14%
Redevelopment
11%
Community
College
7%
Special
Districts
6%
ASSESSED VALUE (BILLIONS)
$308 $334 $357 $388 $419 $450
Santa Clara County Assessor’s Annual Report 2021-22 Santa Clara County Assessor’s Annual Report 2021-22
$483
$516
$551 $577
2012 2013 2014 2015 2016 2017 2018 2019 2020 2021
The
Assessment
Roll
“Property tax, plus all other
special assessments for
fiscal year 2020-2021, is
$6,936,634,340.”
The assessment roll is comprised of the secured roll (property subject to lien) and the unsecured roll (property on which
property taxes are not a lien against improvements on leased land). Exemptions from property taxation fall into two broad
categories: homeowners and “other” exemptions, such as non-profit organizations, churches, charitable institutions, colleges,
hospitals, affordable housing and private schools. Only homeowners’ exemptions are backfilled by the state and comprise only
$1.7 billion of the total $33 billion in exemptions.
Improvements (the value of buildings or structures situated on land) reflect values assessed by both the Real Property and
Business Divisions. Prop. 13 provides that once a base year value is established as a result in a change of ownership or new
construction, the base year can increase by no more than two percent annually, or the California Consumer Price Index (CCPI),
whichever is lesser. The CCPI has been less than two percent in three of the last ten years, and ten times since the passage of
Prop. 13 in 1978.
Summary Report: 2021-2022 Assessment Roll Totals
Assessment Type 2021-2022 2020-2021 Dollar Change
Land $286,689,631,738 $272,285,752,426 $14,403,879,312 5%
Improvements (Real Property) $277,092,345,665 $264,749,213,763 $12,343,131,902 5%
Improvements (Business Division) $2,950,671,724 $2,889,051,702 $61,620,022 2%
Total Improvements $280,043,017,389 $267,638,265,465 $12,404,751,924 5%
Subtotal $566,732,649,127 $539,924,017,891 $26,808,631,236 5%
Personal Property $6,235,975,120 $5,948,789,766 $287,185,354 5%
Mobile Homes $865,664,756 $798,587,758 $67,076,998 8%
Subtotal $7,101,639,876 $6,747,377,524 $354,262,352 5%
Total Gross Secured $573,834,289,003 $546,671,395,415 $27,162,893,588 5%
Less: Non-Reimbursable Secured Exemptions ($28,022,688,740) ($27,063,856,359) ($958,832,381) 4%
NET SECURED $545,811,600,263 $519,607,539,056 $26,204,061,207 5%
Total Gross Unsecured $34,403,338,960 $35,694,613,881 ($1,291,274,921) -4%
Percent
Change
Less Non-Reimbursable Unsecured Exemption ($3,310,678,868) ($3,759,444,771) $448,765,903 -12%
NET UNSECURED $31,092,660,092 $31,935,169,110 ($842,509,018) -3%
TOTAL LOCAL ROLL $576,904,260,355 $551,542,708,166 $25,361,552,189 5%
Homeowners’ Exemption $1,721,855,800 $1,770,130,021 ($48,274,221) -3%
7