Santa Clara County Assessor's Annual Report
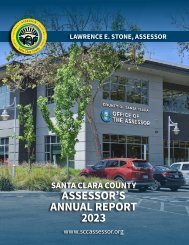
Each year the Santa Clara County Assessor’s Office prepares an Annual Report available in hard copy and electronic versions. The report offers comprehensive statistical analysis of the local assessment roll, including all real and business property, legal exemptions, and assessment appeals. Assessment information is provided by property type, city, and school district. The Assessor’s Annual Report is an important source of information for public finance officials, real estate professionals, tax experts, academics, as well as business, government, and community leaders seeking insights into real estate trends in Santa Clara County.
Each year the Santa Clara County Assessor’s Office prepares an Annual Report available in hard copy and electronic versions. The report offers comprehensive statistical analysis of the local assessment roll, including all real and business property, legal exemptions, and assessment appeals. Assessment information is provided by property type, city, and school district.
The Assessor’s Annual Report is an important source of information for public finance officials, real estate professionals, tax experts, academics, as well as business, government, and community leaders seeking insights into real estate trends in Santa Clara County.
You also want an ePaper? Increase the reach of your titles
YUMPU automatically turns print PDFs into web optimized ePapers that Google loves.
Net Secured Assessed Value (AV) and Number of Parcels (APN) by City and Property Type
30
Homeowner
Exemption
Other
Exemption
Net Secured
Single-Family and
Condo Housing
Office Retail
Multifamily
Housing
Mobile Home
Industrial &
Manufacturing
Agricultural &
Miscellaneous
Row
Type
City
APN 157 289 108 756 218 260 10,529 12,317 113 5,868
AV $180,440,327 $677,707,646 $14,086,866 $1,609,072,896 $981,923,231 $945,451,290 $7,600,254,429 $12,008,936,685 $219,028,491 41,654,200
Campbell
APN 223 59 579 225 148 15,375 16,609 79 9,369
AV $168,735,197 $1,175,857,454 $1,522,720,366 $6,750,140,207 $1,381,256,846 $16,084,758,820 $27,083,468,890 $144,598,228 65,573,200
Cupertino
APN 638 224 171 648 100 317 12,724 14,822 145 6,645
AV $398,044,868 $663,475,908 $12,857,655 $553,306,787 $109,883,355 $960,642,346 $7,270,687,750 $9,968,898,669 $387,411,769 46,512,200
Gilroy
APN 152 30 138 281 176 10,366 11,143 72 6,712
AV $88,604,421 $16,008,337 $286,676,072 $614,362,323 $441,934,565 $17,254,569,211 $18,702,154,929 $452,848,914 46,977,000
Los Altos
APN 207 21 1 2,998 3,227 14 1,879
AV $260,055,885 $2,830,441 $42,176 $9,059,187,930 $9,322,116,432 $37,860,867 13,153,000
Los Altos Hills
APN 355 55 58 454 277 211 9,695 11,105 71 5,814
AV $325,282,988 $200,280,590 $4,796,786 $723,982,596 $1,181,649,332 $593,398,580 $12,224,851,732 $15,254,242,604 $372,494,714 40,691,000
Los Gatos
APN 388 398 399 373 177 189 18,394 20,318 120 9,594
AV $534,413,858 $4,194,667,388 $28,764,486 $2,218,321,494 $322,026,130 $1,454,897,952 $11,674,217,753 $20,427,309,061 $331,226,614 67,145,400
Milpitas
APN 37 2 1,252 1,291 1 777
AV $21,404,832 $2,611,199 $2,541,219,730 $2,565,235,761 $897,205 5,439,000
Monte Sereno
APN 475 234 450 323 98 221 11,790 13,591 123 7,002
AV $441,476,330 $850,922,352 $39,235,162 $518,036,573 $136,702,795 $553,610,543 $8,579,713,794 $11,119,697,549 $338,462,027 49,918,400
Morgan Hill
APN 280 339 840 1,517 413 386 16,917 20,692 110 9,702
AV $1,989,409,821 $4,762,977,834 $73,164,829 $5,611,189,997 $6,232,025,564 $1,531,263,278 $15,358,776,390 $35,558,807,713 $694,118,279 67,943,400
Mountain View
APN 487 174 8 838 577 384 18,244 20,712 311 10,852
AV $431,341,181 $2,047,665,001 $120,444 $2,377,085,739 $7,246,290,199 $1,844,148,494 $27,797,214,510 $41,743,865,568 $7,342,627,583 75,959,800
Palo Alto
APN 3,846 2,819 6,672 11,013 2,163 3,240 217,848 247,601 1,597 121,629
AV $5,609,676,181 $16,237,991,762 $427,700,710 $23,464,142,085 $14,051,824,195 $11,801,473,495 $134,692,560,212 $206,285,368,640 $6,268,308,908 852,710,600
San Jose
APN 456 941 1 2,010 291 433 25,599 29,731 256 13,533
AV $2,196,058,081 $9,748,911,591 $159,917 $6,172,115,168 $7,406,461,747 $1,926,117,117 $16,806,687,353 $44,256,510,974 $2,629,495,194 94,729,600
Santa Clara
APN 349 37 1 23 88 67 10,582 11,147 47 6,853
AV $215,706,749 $44,633,359 $64,329 $10,997,879 $165,948,299 $173,521,825 $16,886,118,796 $17,496,991,236 $240,878,095 47,965,400
Saratoga
APN 287 557 2,796 2,125 356 415 29,364 35,900 148 18,552
AV $682,452,420 $10,829,083,231 $261,156,321 $7,340,887,428 $9,210,146,676 $2,338,070,100 $23,246,850,820 $53,908,646,996 $658,149,776 129,918,600
Sunnyvale
APN 6,919 318 38 311 30 122 17,960 25,698 333 10,798
AV $2,965,361,724 $214,054,027 $1,849,384 $168,595,225 $26,152,528 $135,815,410 $16,597,249,634 $20,109,077,932 $7,904,282,076 75,565,000
Unincorporated
Santa Clara County Assessor’s Annual Report 2021-22 Santa Clara County Assessor’s Annual Report 2021-22
Net Secured Assessed Value (AV) and Number of Parcels (APN) by High School and Elementary Districts and by Major Property Type
Total
Value
Growth
Homeowner
Exemption
Other
Exemption
Non-Residential Net Secured Net Unsecured Grand Total
Single-Family
Housing
Multifamily
Housing
Row Type Mobile Home
Elementary
School
District
Campbell Union High School District
AV $132,062,999 $279,975,506 $76,642,047 $488,680,552 $3,708,257 $492,388,809 $9,775,629 $1,855,000 4%
APN 179 597 115 891 4 265
Burbank
AV $4,882,753 $706,036,055 $5,633,438,787 $1,246,574,035 $7,590,931,630 $124,827,714 $7,715,759,344 $95,022,715 $33,012,000 5%
APN 25 472 8,326 494 9,317 43 4,634
Cambrian
AV $14,765,331 $4,145,278,554 $15,989,818,988 $6,239,951,284 $26,389,814,157 $805,250,148 $27,195,064,305 $686,105,498 $81,561,200 4%
APN 135 2,368 21,165 1,499 25,167 201 11,651
Campbell
Union
AV $1,511,196,587 $7,920,735,832 $1,203,265,934 $10,635,198,353 $131,495,790 $10,766,694,143 $156,853,326 $44,987,600 5%
APN 1,091 10,772 305 12,168 57 6,425
Moreland
AV $32,860 $352,651,714 $10,434,849,675 $908,089,406 $11,695,623,655 $90,309,624 $11,785,933,279 $105,225,388 $58,037,000 6%
APN 1 378 13,650 257 14,286 72 8,292
Union
Elementary
Total AV $19,680,944 $6,847,225,909 $40,258,818,788 $9,674,522,706 $56,800,248,347 $1,155,591,533 $57,955,839,880 $1,052,982,556 $219,452,800
APN 161 4,488 54,510 2,670 61,829 377 31,267
East Side Union High School District
AV $5,930,732 $818,710,310 $8,507,026,787 $1,490,870,913 $10,822,538,742 $161,386,158 $10,983,924,900 $1,002,570,149 $70,397,600 4%
APN 132 865 19,778 1,153 21,928 224 9,874
Alum Rock
Union
AV $68,115 $906,559,678 $12,614,080,333 $956,245,020 $14,476,953,146 $211,087,341 $14,688,040,487 $181,010,129 $85,748,600 3%
APN 1 98 22,866 482 23,447 130 12,252
Berryessa
Union
AV $37,617,507 $200,753,203 $18,570,071,104 $1,611,756,056 $20,420,197,870 $178,956,775 $20,599,154,645 $284,626,684 $105,119,000 3%
APN 579 71 25,608 766 27,024 146 15,021
Evergreen
AV $134,042,636 $949,298,939 $7,339,419,073 $2,746,974,448 $11,169,735,096 $434,264,607 $11,603,999,703 $931,533,179 $58,240,000 4%
APN 2,237 938 15,240 1,677 20,092 134 8,321
Franklin
McKinley
AV $91,045 $14,711,159 $2,555,974,283 $175,370,514 $2,746,147,001 $9,158,309 $2,755,305,310 $24,806,255 $18,289,600 4%
APN 1 28 5,007 179 5,215 30 2,613
Mount
Pleasant
AV $98,521,508 $2,127,070,244 $14,025,733,764 $3,395,309,742 $19,646,635,258 $1,089,271,547 $20,735,906,805 $567,223,270 $101,948,000 5%
APN 1,352 518 26,281 572 28,723 159 14,556
Oak Grove
AV $51,994,684 $1,332,786,434 $1,679,776,618 $8,766,409,635 $11,830,967,371 $1,422,854,949 $13,253,822,320 $134,659,001 $11,645,200 3%
APN 913 32 2,373 1,332 4,650 25 1,664
Orchard
Total AV $328,266,227 $6,349,889,967 $65,292,081,962 $19,142,936,328 $91,113,174,484 $3,506,979,686 $94,620,154,170 $3,126,428,667 $451,388,000
APN 5,215 2,550 117,153 6,161 131,079 848 64,301
31


