Santa Clara County Assessor's Annual Report
Each year the Santa Clara County Assessor’s Office prepares an Annual Report available in hard copy and electronic versions. The report offers comprehensive statistical analysis of the local assessment roll, including all real and business property, legal exemptions, and assessment appeals. Assessment information is provided by property type, city, and school district. The Assessor’s Annual Report is an important source of information for public finance officials, real estate professionals, tax experts, academics, as well as business, government, and community leaders seeking insights into real estate trends in Santa Clara County.
Each year the Santa Clara County Assessor’s Office prepares an Annual Report available in hard copy and electronic versions. The report offers comprehensive statistical analysis of the local assessment roll, including all real and business property, legal exemptions, and assessment appeals. Assessment information is provided by property type, city, and school district.
The Assessor’s Annual Report is an important source of information for public finance officials, real estate professionals, tax experts, academics, as well as business, government, and community leaders seeking insights into real estate trends in Santa Clara County.

Create successful ePaper yourself
Turn your PDF publications into a flip-book with our unique Google optimized e-Paper software.
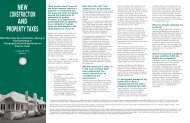
Top 10 Changes in Ownership
% Increase Over
Property Type City Net AV Net Changed AV
Prior Year
Office Cupertino $346,000,000 $159,136,113 46.0%
Office San Jose $310,499,900 $188,536,838 60.7%
Office Palo Alto $300,840,297 $103,699,727 34.5%
Office San Jose $274,999,900 $44,824,611 16.3%
Multifamily Housing San Jose $175,951,172 $13,636,436 7.8%
Office San Jose $175,337,872 $65,340,673 37.3%
Industrial & Manufacturing San Jose $160,000,000 $60,870,118 38.0%
Office Santa Clara $153,574,719 $29,068,703 18.9%
Multifamily Housing San Jose $145,063,951 ($55,314) -0.0%
Industrial & Manufacturing Sunnyvale $141,274,000 $25,346,316 17.9%
City
Campbell
Cupertino
Gilroy
Los Altos
Los Altos Hills
Los Gatos
Milpitas
Monte Sereno
Morgan Hill
Mountain View
Palo Alto
San Jose
Santa Clara
Saratoga
Sunnyvale
Unincorporated
Added AV Due to Changes in Ownership
by City and Major Property Type, Value and Parcel Count
Agricultural & Industrial & Multifamily
Single-Family
Office Retail
Miscellaneous Manufacturing Housing
Housing
Total
$5,320,361 $13,944,124 $26,677,986 $47,267,600 $30,321,411 $251,697,440 $375,228,922
5 9 38 7 12 434 505
-$253,913 $94,519,205 $71,144,454 $189,403,593 $4,385,534 $406,589,825 $765,788,698
4 13 16 9 3 407 452
$72,630,031 $18,718,132 $26,047,576 $5,090,250 $5,830,560 $146,200,829 $274,517,378
96 8 76 2 11 782 975
$4,514,944 $2,216,557 $5,033,250 $12,267,648 $555,171,451 $579,203,850
11 1 8 3 363 386
$5,906,372 $30 $211,362,996 $217,269,398
8 1 111 120
$10,719,717 $14,894,370 $8,862,122 $38,978,828 $364,863,838 $438,318,875
24 16 18 16 452 526
$2,633,471 $88,168,218 $66,562,773 $1,713,089 $49,778,798 $297,775,393 $506,631,742
9 13 13 1 4 715 755
$5,024,218 $87,683,911 $92,708,129
2 65 67
$32,043,405 $24,320,551 $5,279,395 $1,602,058 $2,149,125 $261,781,845 $327,176,379
28 11 7 5 4 833 888
$27,978,799 $35,755,334 $123,915,318 $6,746,011 $31,047,042 $503,311,108 $728,753,612
15 5 26 6 8 648 708
$22,312,530 $58,702,194 $20,367,295 $228,541,060 $3,871,461 $777,443,407 $1,111,237,947
12 6 17 22 8 539 604
$202,964,284 $291,593,726 $193,686,858 $475,527,248 $136,864,702 $3,979,691,330 $5,280,328,148
135 103 299 67 80 8616 9300
$4,976,270 $161,263,757 $28,450,894 $93,634,662 $31,241,439 $755,936,702 $1,075,503,724
12 28 50 10 15 1140 1255
$4,453,021 $516,392 $2,102,232 $383,829,045 $390,900,690
14 3 5 321 343
$23,972,038 $115,064,754 $247,076,829 $35,539,080 $74,131,116 $818,164,791 $1,313,948,608
12 14 58 6 23 1046 1159
$63,176,286 $252,970 $2,347,697 $1,114,132 $168,931 $456,889,515 $523,949,531
215 3 6 4 3 737 968
What is Proposition 8?
Proposition 8, passed by California voters in November 1978, entitles property owners to the lower of the fair market
value of their property as of the Lien Date (January 1, 2021), or the factored base year value. The factored base
year value is the assessed value as determined at the time of purchase or construction, increased each year by no
more than two percent, or the CCPI, whichever is lower. When the market value of a property declines below the
factored base year value, the Assessor is required to proactively reduce the assessed value to reflect the lower fair
market value of their property. Properties where the market value exceeds the assessed value as of January 1, 2021,
are not eligible for an adjustment.
Billions
$30
$25
$20
$15
$10
$5
$0
$23.8
119
$27.0
124
PROPOSITION 8 HISTORY
$27.0
137
$15.9
81
$8.0
38
$4.9
22
2010 2011 2012 2013 2014 2015 2016 2017 2018 2019 2020 2021
$2.7
11
Temporary Reduction Amount (Billions)
$2.0
7
The Property Tax Avenger is on your side
To help new and prospective homeowners better understand how supplemental assessments
affect them, the Assessor’s Office has created a fun and informative video to
eliminate surprises about a confusing part of purchasing a new home. New homeowners
often assume their property taxes were taken care of during escrow, or as part of the
monthly mortgage payments, only to receive a supplemental assessment followed by a
supplemental tax bill. The “Tax Avenger” video provides a collection of information on
the Assessor’s website, including a “Supplemental Estimator” that enables a new property
owner to calculate the estimated taxes based upon the anticipated purchase price and
month of acquisition. The “Estimator” assists taxpayers to better understand how supplemental
assessments and taxes are calculated by the Assessor and the Tax Collector.
Find the Tax Avenger video on the Santa Clara County Assessor’s Office YouTube
channel.
$1.4
3
$1.1
2
$2.1
11
Parcel Count (Thousands)
$1.8
8
160
140
120
100
80
60
40
20
-
Thousands
18
Santa Clara County Assessor’s Annual Report 2021-22 Santa Clara County Assessor’s Annual Report 2021-22
19