Association between use of hand hygiene products and rates ... - CCIH
Association between use of hand hygiene products and rates ... - CCIH
Association between use of hand hygiene products and rates ... - CCIH
Create successful ePaper yourself
Turn your PDF publications into a flip-book with our unique Google optimized e-Paper software.
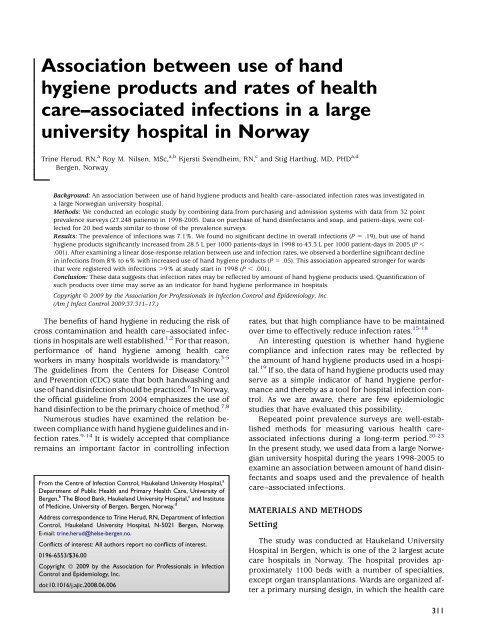
<strong>Association</strong> <strong>between</strong> <strong>use</strong> <strong>of</strong> <strong>h<strong>and</strong></strong><br />
<strong>hygiene</strong> <strong>products</strong> <strong>and</strong> <strong>rates</strong> <strong>of</strong> health<br />
care–associated infections in a large<br />
university hospital in Norway<br />
Trine Herud, RN, a Roy M. Nilsen, MSc, a,b Kjersti Svendheim, RN, c <strong>and</strong> Stig Harthug, MD, PHD a,d<br />
Bergen, Norway<br />
Background: An association <strong>between</strong> <strong>use</strong> <strong>of</strong> <strong>h<strong>and</strong></strong> <strong>hygiene</strong> <strong>products</strong> <strong>and</strong> health care–associated infection <strong>rates</strong> was investigated in<br />
a large Norwegian university hospital.<br />
Methods: We conducted an ecologic study by combining data from purchasing <strong>and</strong> admission systems with data from 32 point<br />
prevalence surveys (27,248 patients) in 1998-2005. Data on purchase <strong>of</strong> <strong>h<strong>and</strong></strong> disinfectants <strong>and</strong> soap, <strong>and</strong> patient-days, were collected<br />
for 20 bed wards similar to those <strong>of</strong> the prevalence surveys.<br />
Results: The prevalence <strong>of</strong> infections was 7.1%. We found no significant decline in overall infections (P 5 .19), but <strong>use</strong> <strong>of</strong> <strong>h<strong>and</strong></strong><br />
<strong>hygiene</strong> <strong>products</strong> significantly increased from 28.5 L per 1000 patients-days in 1998 to 43.3 L per 1000 patient-days in 2005 (P ,<br />
.001). After examining a linear dose-response relation <strong>between</strong> <strong>use</strong> <strong>and</strong> infection <strong>rates</strong>, we observed a borderline significant decline<br />
in infections from 8% to 6% with increased <strong>use</strong> <strong>of</strong> <strong>h<strong>and</strong></strong> <strong>hygiene</strong> <strong>products</strong> (P 5 .05). This association appeared stronger for wards<br />
that were registered with infections .9% at study start in 1998 (P , .001).<br />
Conclusion: These data suggests that infection <strong>rates</strong> may be reflected by amount <strong>of</strong> <strong>h<strong>and</strong></strong> <strong>hygiene</strong> <strong>products</strong> <strong>use</strong>d. Quantification <strong>of</strong><br />
such <strong>products</strong> over time may serve as an indicator for <strong>h<strong>and</strong></strong> <strong>hygiene</strong> performance in hospitals.<br />
Copyright ª 2009 by the <strong>Association</strong> for Pr<strong>of</strong>essionals in Infection Control <strong>and</strong> Epidemiology, Inc.<br />
(Am J Infect Control 2009;37:311–17.)<br />
The benefits <strong>of</strong> <strong>h<strong>and</strong></strong> <strong>hygiene</strong> in reducing the risk <strong>of</strong><br />
cross contamination <strong>and</strong> health care–associated infections<br />
in hospitals are well established. 1,2 For that reason,<br />
performance <strong>of</strong> <strong>h<strong>and</strong></strong> <strong>hygiene</strong> among health care<br />
workers in many hospitals worldwide is m<strong>and</strong>atory. 3-5<br />
The guidelines from the Centers for Disease Control<br />
<strong>and</strong> Prevention (CDC) state that both <strong>h<strong>and</strong></strong>washing <strong>and</strong><br />
<strong>use</strong> <strong>of</strong> <strong>h<strong>and</strong></strong> disinfection should be practiced. 6 In Norway,<br />
the <strong>of</strong>ficial guideline from 2004 emphasizes the <strong>use</strong> <strong>of</strong><br />
<strong>h<strong>and</strong></strong> disinfection to be the primary choice <strong>of</strong> method. 7,8<br />
Numerous studies have examined the relation <strong>between</strong><br />
compliance with <strong>h<strong>and</strong></strong> <strong>hygiene</strong> guidelines <strong>and</strong> infection<br />
<strong>rates</strong>. 9-14 It is widely accepted that compliance<br />
remains an important factor in controlling infection<br />
From the Centre <strong>of</strong> Infection Control, Haukel<strong>and</strong> University Hospital, a<br />
Department <strong>of</strong> Public Health <strong>and</strong> Primary Health Care, University <strong>of</strong><br />
Bergen, b The Blood Bank, Haukel<strong>and</strong> University Hospital, c <strong>and</strong> Institute<br />
<strong>of</strong> Medicine, University <strong>of</strong> Bergen, Bergen, Norway. d<br />
Address correspondence to Trine Herud, RN, Department <strong>of</strong> Infection<br />
Control, Haukel<strong>and</strong> University Hospital, N-5021 Bergen, Norway.<br />
E-mail: trine.herud@helse-bergen.no.<br />
Conflicts <strong>of</strong> interest: All authors report no conflicts <strong>of</strong> interest.<br />
0196-6553/$36.00<br />
Copyright ª 2009 by the <strong>Association</strong> for Pr<strong>of</strong>essionals in Infection<br />
Control <strong>and</strong> Epidemiology, Inc.<br />
doi:10.1016/j.ajic.2008.06.006<br />
<strong>rates</strong>, but that high compliance have to be maintained<br />
over time to effectively reduce infection <strong>rates</strong>. 15-18<br />
An interesting question is whether <strong>h<strong>and</strong></strong> <strong>hygiene</strong><br />
compliance <strong>and</strong> infection <strong>rates</strong> may be reflected by<br />
the amount <strong>of</strong> <strong>h<strong>and</strong></strong> <strong>hygiene</strong> <strong>products</strong> <strong>use</strong>d in a hospital.<br />
19 If so, the data <strong>of</strong> <strong>h<strong>and</strong></strong> <strong>hygiene</strong> <strong>products</strong> <strong>use</strong>d may<br />
serve as a simple indicator <strong>of</strong> <strong>h<strong>and</strong></strong> <strong>hygiene</strong> performance<br />
<strong>and</strong> thereby as a tool for hospital infection control.<br />
As we are aware, there are few epidemiologic<br />
studies that have evaluated this possibility.<br />
Repeated point prevalence surveys are well-established<br />
methods for measuring various health careassociated<br />
infections during a long-term period. 20-23<br />
In the present study, we <strong>use</strong>d data from a large Norwegian<br />
university hospital during the years 1998-2005 to<br />
examine an association <strong>between</strong> amount <strong>of</strong> <strong>h<strong>and</strong></strong> disinfectants<br />
<strong>and</strong> soaps <strong>use</strong>d <strong>and</strong> the prevalence <strong>of</strong> health<br />
care–associated infections.<br />
MATERIALS AND METHODS<br />
Setting<br />
The study was conducted at Haukel<strong>and</strong> University<br />
Hospital in Bergen, which is one <strong>of</strong> the 2 largest acute<br />
care hospitals in Norway. The hospital provides approximately<br />
1100 beds with a number <strong>of</strong> specialties,<br />
except organ transplantations. Wards are organized after<br />
a primary nursing design, in which the health care<br />
311
312 Herudetal. American Journal <strong>of</strong> Infection Control<br />
May 2009<br />
workers are divided into teams treating the same set <strong>of</strong><br />
patients every day. One team may involve a wide spectre<br />
<strong>of</strong> different health care workers, basically including<br />
registered nurses, nursing assistants, <strong>and</strong> doctors.<br />
Data<br />
This was an ecologic study in which information from<br />
3 different data sources was compared. Information on<br />
product labels <strong>and</strong> amount <strong>of</strong> <strong>h<strong>and</strong></strong> soap <strong>and</strong> disinfectant<br />
were abstracted from the hospital"s purchasing database<br />
system, whereas information on a patient’s length<br />
<strong>of</strong> hospital stay (ie, patient-days) was abstracted from<br />
the patient admission database system. If a patient was<br />
admitted <strong>and</strong> discharged on the same day, we defined<br />
his or her length <strong>of</strong> hospital stay as 1 day.<br />
From point prevalence surveys, we collected information<br />
on a patient’s infection status. In brief, repeated<br />
point prevalence surveys have been conducted by the<br />
Centre <strong>of</strong> Infection Control at the hospital 4 times a<br />
year since 1994. They were normally conducted on<br />
1 day for each <strong>of</strong> the following time intervals: (1) January<br />
to March, (2) April to June, (3) July to October, <strong>and</strong><br />
(4) November to December. Infection data were collected<br />
<strong>and</strong> registered at each ward by dedicated senior<br />
nurses <strong>and</strong> physicians on the day <strong>of</strong> collection. Each<br />
patient was inspected <strong>between</strong> 8:00 <strong>and</strong> 9:00 AM <strong>and</strong><br />
examined with respect to infection status. Whether<br />
an infection started outside or during the hospital admission<br />
or at another hospital stay was assessed by interviewing<br />
the patient <strong>and</strong> reading the patients journal.<br />
Ahead <strong>of</strong> a data collection, an announcement was<br />
made on the hospital’s Intranet. Detailed instructions<br />
<strong>and</strong> guidelines were sent by e-mail to those who<br />
were responsible for the data collection. All infection<br />
data were registered on-line <strong>and</strong> stored in a single infection<br />
database system. Generally, response <strong>rates</strong><br />
were over 95%.<br />
All types <strong>of</strong> hospital infections were registered <strong>and</strong><br />
CDC definitions <strong>of</strong> nosocomial infections, with minor<br />
modifications, were <strong>use</strong>d throughout the surveillance<br />
period. 24,25 The CDC’s National Nosocomial Infections<br />
Surveillance system defines nosocomial infections as<br />
a localized or systemic condition that results from adverse<br />
reaction to the presence <strong>of</strong> an infectious agent(s)<br />
or its toxin(s) <strong>and</strong> that was not present or incubating at<br />
the time <strong>of</strong> admission to the hospital. 26<br />
Initially, our study comprised a total <strong>of</strong> 25 wards during<br />
the period 1998 to 2005. We excluded 1 ward beca<strong>use</strong><br />
infection <strong>rates</strong> were unusually high (burn<br />
patients, .50%) <strong>and</strong> an additional 4 wards beca<strong>use</strong> information<br />
on hospital stay (ie, not bed wards) or <strong>use</strong> <strong>of</strong><br />
<strong>h<strong>and</strong></strong> <strong>hygiene</strong> <strong>products</strong> was unknown, leaving data on<br />
27,248 patients from 32 prevalence surveys for<br />
analysis.<br />
H<strong>and</strong> <strong>hygiene</strong> performance<br />
H<strong>and</strong> <strong>hygiene</strong> was defined as any <strong>use</strong> <strong>of</strong> <strong>h<strong>and</strong></strong> soap<br />
or <strong>h<strong>and</strong></strong> disinfection. All <strong>h<strong>and</strong></strong> disinfectants from dispensers<br />
or pocket bottles were waterless <strong>and</strong> contained<br />
ethyl alcohol 70% <strong>and</strong> glycerine #2%. The dispensers<br />
for soap or <strong>h<strong>and</strong></strong> disinfectants provided the same dose,<br />
#2 mL. H<strong>and</strong> disinfectants were not <strong>use</strong>d for cleaning<br />
surfaces or medical instruments. For these purposes,<br />
technical alcohol without glycerine was required.<br />
In our hospital, sinks with dispensers for <strong>h<strong>and</strong></strong> soap<br />
<strong>and</strong> paper towels are available in every patient room<br />
<strong>and</strong> located near the door. Furthermore, <strong>h<strong>and</strong></strong> disinfection<br />
has been placed <strong>between</strong> the beds <strong>and</strong> on the respirators<br />
<strong>and</strong> in the staff rooms, the disinfection rooms,<br />
the kitchens, the wardrobes, <strong>and</strong> the corridors in addition<br />
to locations at which the health care workers have<br />
found it convenient. The availability <strong>of</strong> <strong>h<strong>and</strong></strong> soap <strong>and</strong><br />
disinfectant has increased over the years. Until 2004,<br />
pocket bottles <strong>of</strong> <strong>h<strong>and</strong></strong> disinfection were generally<br />
not available for the attending health personnel.<br />
H<strong>and</strong> <strong>hygiene</strong> campaigns<br />
In 2000 <strong>and</strong> 2005, large <strong>h<strong>and</strong></strong> <strong>hygiene</strong> campaigns<br />
were performed at the hospital. The campaign in 2000<br />
was conducted during 1 day (October 25) by the infection<br />
control personnel at the hospital. Four weeks before<br />
the campaign day, several posters about <strong>h<strong>and</strong></strong><br />
<strong>hygiene</strong> methods <strong>and</strong> interventions to increase compliance<br />
were distributed around the entire hospital together<br />
with the campaign program. During the<br />
campaign day, different lectures were given, not only<br />
emphasizing <strong>h<strong>and</strong></strong> <strong>hygiene</strong> but also pointing at the hospital’s<br />
infection control program, which was published<br />
as an electronic <strong>h<strong>and</strong></strong>book on the hospital’s Intranet<br />
during the spring 2001. The campaign also foc<strong>use</strong>d on<br />
st<strong>and</strong>ard precautions <strong>and</strong> on the health care workers attitude<br />
<strong>and</strong> behavior with respect to <strong>h<strong>and</strong></strong> <strong>hygiene</strong>.<br />
The campaign in 2005 was conducted for 8 months,<br />
from February to September, <strong>and</strong> was organized by the<br />
Norwegian Institute <strong>of</strong> Public Health, which invited all<br />
hospitals <strong>and</strong> nursing homes in Norway to participate.<br />
The main focus <strong>of</strong> the campaign was compliance <strong>of</strong><br />
<strong>h<strong>and</strong></strong> <strong>hygiene</strong>. Prior to the campaign, in 2004, the<br />
new national guideline for <strong>h<strong>and</strong></strong> <strong>hygiene</strong> for health<br />
care settings was released. According to this guideline,<br />
the recommended <strong>use</strong> <strong>of</strong> <strong>h<strong>and</strong></strong> <strong>hygiene</strong> <strong>products</strong> is<br />
<strong>h<strong>and</strong></strong> disinfection for 15 to 30 seconds. If <strong>h<strong>and</strong></strong>s are visible<br />
dirty, they should be washed with water <strong>and</strong> soap<br />
for 30 to 60 seconds.<br />
Statistical analyses<br />
All analyses were performed by using Statistical<br />
Analysis System (SAS) version 9.1 for Windows (SAS
www.ajicjournal.org<br />
Vol. 37 No. 4<br />
Institute, Inc., Cary, NC). All P values were 2-sided, <strong>and</strong><br />
values ,.05 were considered statistically significant.<br />
We quantified <strong>use</strong> <strong>of</strong> <strong>h<strong>and</strong></strong> <strong>hygiene</strong> <strong>products</strong> as the total<br />
amount (sum liters) <strong>of</strong> <strong>h<strong>and</strong></strong> disinfections <strong>and</strong> soap purchased<br />
during the whole study period, as well as by year,<br />
<strong>and</strong> by time periods for which the 32 point prevalence<br />
surveys were conducted. Use was further st<strong>and</strong>ardized<br />
by dividing the amount <strong>of</strong> <strong>use</strong> by the corresponding<br />
sum <strong>of</strong> patientsÕ days for the relevant time periods (liters/1000<br />
patient-days). Bootstrap method was <strong>use</strong>d to<br />
estimate the st<strong>and</strong>ard error <strong>of</strong> mean (SEM) <strong>of</strong> <strong>use</strong> by<br />
the st<strong>and</strong>ard deviation (SD) <strong>of</strong> estimates found by resampling<br />
from the observed data 200 times. 27 We <strong>use</strong>d<br />
unadjusted linear regression analysis to test whether infection<br />
<strong>rates</strong> <strong>and</strong> <strong>use</strong> <strong>of</strong> <strong>h<strong>and</strong></strong> <strong>hygiene</strong> <strong>products</strong> changed<br />
over time (ie, a test for trend). Similarly, we <strong>use</strong>d unadjusted<br />
linear regression analysis to examine a dose-response<br />
association <strong>between</strong> infection <strong>rates</strong> <strong>and</strong><br />
amount <strong>of</strong> <strong>h<strong>and</strong></strong> <strong>hygiene</strong> <strong>products</strong> <strong>use</strong>d.<br />
In Norwegian hospitals, infection <strong>rates</strong> above 9% are<br />
regarded as high. 28-30 Using this basis, we categorized<br />
wards into 2 groups: whether their infection <strong>rates</strong><br />
were above or under 9% on average during the first<br />
study year in 1998. We then performed separate linear<br />
regression analyses to examine whether the associations<br />
differed in magnitude <strong>between</strong> the 2 groups (9<br />
<strong>and</strong> 11 wards, respectively). Notably, 3 <strong>of</strong> the wards<br />
studied were established later than 1998 but were included<br />
in the latter group beca<strong>use</strong> they were registered<br />
with infection <strong>rates</strong> #9% during their first study year.<br />
RESULTS<br />
Characteristics <strong>of</strong> the 27,248 patients in the present<br />
study with infection status are shown in Table 1. Mean<br />
patient age was 51.8 (SD, 27.1) years. Approximately<br />
55% <strong>of</strong> the patients were women, over 25% had undergone<br />
a surgical operation, <strong>and</strong> 12% <strong>of</strong> the patients<br />
were using a urinary tract catheter. The proportion <strong>of</strong><br />
patients registered was evenly distributed across the 4<br />
time intervals for which the prevalence studies were<br />
conducted (25%). Mean number <strong>of</strong> patients per year<br />
was 3406 (SD, 236.1).<br />
The overall prevalence <strong>of</strong> health care-associated infections<br />
in 1998-2005 was estimated to be 7.1% (Table<br />
2). We observed no significant decline in infection <strong>rates</strong><br />
during these years (Table 2; P 5 .19). The lowest infection<br />
rate (5.7%) was observed in 2001.<br />
The overall mean <strong>use</strong> <strong>of</strong> <strong>h<strong>and</strong></strong> <strong>hygiene</strong> <strong>products</strong> in<br />
1998-2005 was 35.5 L per 1000 patient-days (Table 2).<br />
The <strong>use</strong> <strong>of</strong> <strong>h<strong>and</strong></strong> <strong>hygiene</strong> <strong>products</strong> increased from 28.5<br />
L per 1000 patients-days in 1998 to 43.3 L per 1000 patient-days<br />
in 2005 (Table 2; P , .001). Linear regression<br />
analysis further showed a significant increase in the <strong>use</strong><br />
<strong>of</strong> <strong>h<strong>and</strong></strong> disinfectants <strong>and</strong> a significant decline in the <strong>use</strong><br />
Table 1. Characteristics <strong>of</strong> 27,248 patients with infection<br />
status at Haukel<strong>and</strong> University Hospital, Norway, 1998<br />
2005<br />
Characteristics No. %<br />
Survey time interval<br />
January-March 6951 25.5<br />
April-June 6553 24.0<br />
July-October 6762 24.8<br />
November-December 6982 25.6<br />
Age<br />
Unknown 29 0.1<br />
,15 Yr 3486 12.8<br />
15-34 Yr 4141 15.2<br />
35-54 Yr 4912 18.0<br />
55-74 Yr 7775 28.5<br />
.74 Yr 6905 25.3<br />
Gender<br />
Woman 14,664 53.8<br />
Man 12,584 46.2<br />
Surgical operation<br />
No 20,033 73.5<br />
Yes 7215 26.5<br />
Urinary tract catheter<br />
No 23,949 87.9<br />
Yes 3299 12.1<br />
<strong>of</strong> <strong>h<strong>and</strong></strong> soaps (Table 2; P , .001 <strong>and</strong> P 5 .003, respectively).<br />
There was a strong increase in the <strong>use</strong> <strong>of</strong> <strong>h<strong>and</strong></strong><br />
disinfectants in 2005 <strong>and</strong> a top in the <strong>use</strong> <strong>of</strong> both <strong>h<strong>and</strong></strong><br />
soap <strong>and</strong> disinfectants in 2001.<br />
We examined the dose-response relation <strong>between</strong><br />
overall infection <strong>rates</strong> (from 32 prevalence surveys)<br />
<strong>and</strong> amount <strong>of</strong> <strong>h<strong>and</strong></strong> <strong>hygiene</strong> <strong>products</strong> <strong>use</strong>d (Fig 1).<br />
We observed a 25% decline on average <strong>of</strong> health<br />
care-associated infections (from approximately 8% to<br />
6%) with increased <strong>use</strong> <strong>of</strong> <strong>h<strong>and</strong></strong> <strong>hygiene</strong> <strong>products</strong><br />
from approximately 26 to 47 L per 1000 patient-days<br />
(P 5 .05). We also examined whether this association<br />
was different <strong>between</strong> wards with initially high <strong>and</strong><br />
low infection <strong>rates</strong> at study start (Fig 2). We observed<br />
a strong inverse relation <strong>between</strong> <strong>use</strong> <strong>of</strong> <strong>h<strong>and</strong></strong> <strong>hygiene</strong><br />
<strong>products</strong> <strong>and</strong> infection <strong>rates</strong> for wards with infection<br />
<strong>rates</strong> .9% <strong>and</strong> a nonsignificant relation for wards<br />
with <strong>rates</strong> below this cut point (P , .001 <strong>and</strong> P 5 .75,<br />
respectively).<br />
Finally, we tested the association <strong>between</strong> <strong>use</strong> <strong>of</strong><br />
<strong>h<strong>and</strong></strong> disinfectants alone <strong>and</strong> <strong>rates</strong> <strong>of</strong> health care-associated<br />
infections among all study wards (data not<br />
shown). There was a significant inverse relation <strong>between</strong><br />
<strong>use</strong> <strong>of</strong> alcohol-based <strong>h<strong>and</strong></strong> <strong>products</strong> <strong>and</strong> infection<br />
<strong>rates</strong> after adjusting for <strong>use</strong> <strong>of</strong> <strong>h<strong>and</strong></strong> soap<br />
(adjusted, P 5 .04).<br />
DISCUSSION<br />
Herud et al. 313<br />
In this study, we examined prevalence <strong>of</strong> health<br />
care–associated infection in relation to the <strong>use</strong> <strong>of</strong>
314 Herudetal. American Journal <strong>of</strong> Infection Control<br />
May 2009<br />
Table 2. Prevalence <strong>of</strong> health care–associated infections <strong>and</strong> <strong>use</strong> <strong>of</strong> <strong>h<strong>and</strong></strong> soap <strong>and</strong> disinfectants at Haukel<strong>and</strong> University<br />
Hospital, Norway, 1998-2005<br />
Year<br />
No. <strong>of</strong> subjects<br />
with infection status<br />
Health care-associated<br />
infections<br />
<strong>h<strong>and</strong></strong> <strong>hygiene</strong> <strong>products</strong> in a large university hospital in<br />
Norway from 1998 through 2005. Using linear dose-response<br />
analysis, we found that the percentage <strong>of</strong> hospital<br />
infection declined by 25% on average (ie, from 8%<br />
to 6%) with increased <strong>use</strong> <strong>of</strong> <strong>h<strong>and</strong></strong> <strong>hygiene</strong> <strong>products</strong><br />
from 26 to 47 L per 1000 patient-days. This association<br />
was borderline significant but appeared to be stronger<br />
for wards that were registered with initially high infection<br />
<strong>rates</strong> (.9%) at study start in 1998.<br />
The strength <strong>of</strong> the present study is that it was hospital<br />
based, comprising 27,248 patients from 32 pointprevalence<br />
surveys during 8 years. Information on infection<br />
status was reported by trained health personnel<br />
using a st<strong>and</strong>ardized electronic form for all wards. In<br />
addition, the criteria for health care-associated infections<br />
were the same for each survey during the study<br />
period.<br />
There are, however, some limitations <strong>of</strong> the present<br />
study. There are many factors that may have contributed<br />
to the changes in both infection <strong>rates</strong> <strong>and</strong> in <strong>use</strong><br />
<strong>of</strong> <strong>h<strong>and</strong></strong> <strong>hygiene</strong> <strong>products</strong>, including education, compliance,<br />
<strong>and</strong> frequency <strong>of</strong> <strong>use</strong>. However, beca<strong>use</strong> we<br />
do not have exact measures about such factors, they<br />
had to be assumed rather than tested in statistical<br />
models. Furthermore, we cannot exclude the possibility<br />
<strong>of</strong> bias in prevalence estimates for the entire hospital<br />
beca<strong>use</strong> several wards are not included in the study.<br />
In addition, we only had information on purchase <strong>of</strong><br />
<strong>h<strong>and</strong></strong> <strong>hygiene</strong> <strong>products</strong> <strong>and</strong> not the actual amount <strong>of</strong><br />
<strong>use</strong>. However, beca<strong>use</strong> <strong>of</strong> the limitations <strong>of</strong> storage capacity<br />
at our hospital, the <strong>products</strong> are purchased in<br />
small scales <strong>and</strong> are being continuously <strong>use</strong>d.<br />
Few studies have reported both prevalence <strong>of</strong> hospital<br />
infections <strong>and</strong> amount <strong>of</strong> <strong>h<strong>and</strong></strong> <strong>hygiene</strong> <strong>products</strong><br />
<strong>use</strong>d over a long-term period. A hospital-based study<br />
Use <strong>of</strong> <strong>h<strong>and</strong></strong><br />
<strong>hygiene</strong> <strong>products</strong> (liters/1000 patient-days)*<br />
No. % Any Soap Disinfectant<br />
All 27,248 1947 7.1 6 0.16 y<br />
35.5 6 0.16 z<br />
23.4 6 0.21 12.2 6 0.18<br />
1998 3171 250 7.9 6 0.48 28.5 6 0.93 25.5 6 0.89 2.9 6 0.27<br />
1999 3373 257 7.6 6 0.46 31.1 6 0.93 23.8 6 0.84 7.3 6 0.45<br />
2000 3052 245 8.0 6 0.49 31.9 6 0.96 22.7 6 0.84 9.2 6 0.52<br />
2001 3612 207 5.7 6 0.39 36.8 6 1.07 25.1 6 0.88 11.7 6 0.57<br />
2002 3386 236 7.0 6 0.44 35.6 6 1.06 23.1 6 0.90 12.5 6 0.54<br />
2003 3465 258 7.4 6 0.46 36.2 6 1.10 22.0 6 0.86 14.2 6 0.66<br />
2004 3381 222 6.6 6 0.43 39.8 6 1.08 23.1 6 0.88 16.7 6 0.66<br />
2005 3808 272 7.1 6 0.42 43.3 6 1.02 21.8 6 0.76 21.5 6 0.78<br />
P trend §<br />
.19 ,.001 .003 ,.001<br />
*Based on sum <strong>of</strong> liters <strong>of</strong> <strong>h<strong>and</strong></strong> <strong>hygiene</strong> <strong>products</strong> <strong>use</strong>d <strong>and</strong> sum <strong>of</strong> patient-days from 20 study wards similar to those registered for patients with infection status.<br />
y<br />
Percent 6 SEM.<br />
z<br />
Liters/1000 patient-days 6 SEM: bootstrap method was <strong>use</strong>d to estimate SEM by the st<strong>and</strong>ard deviation <strong>of</strong> estimates found by resampling from the original data 200 times.<br />
§<br />
P trend was estimated by incorporating year as a linear predictor in an unadjusted linear regression model: the linear predictor was negative for health care-associated infections<br />
<strong>and</strong> <strong>use</strong> <strong>of</strong> soap but positive for <strong>use</strong> <strong>of</strong> disinfectants as well as for the overall <strong>use</strong> <strong>of</strong> <strong>h<strong>and</strong></strong> <strong>hygiene</strong> <strong>products</strong>.<br />
Infections (%)<br />
15<br />
12<br />
9<br />
6<br />
3<br />
0<br />
24 29 34 39 44 49<br />
H<strong>and</strong> <strong>hygiene</strong> <strong>products</strong> (litres/1,000 patient days)<br />
Fig 1. Prevalence <strong>of</strong> health care–associated<br />
infections from 32 point prevalence surveys by <strong>use</strong><br />
<strong>of</strong> <strong>h<strong>and</strong></strong> disinfectants <strong>and</strong> soap (liters/1000 patientdays)<br />
at Haukel<strong>and</strong> University Hospital, Norway,<br />
1998-2005. Dots represent infection <strong>rates</strong>; solid line<br />
represents predicted infection rate based on<br />
unadjusted linear regression analysis.<br />
from Switzerl<strong>and</strong> reported a 41% decrease (ie, from<br />
17% to 10%) in health care–associated infections during<br />
a 4-year period. 19 During the same period, the overall<br />
<strong>use</strong> <strong>of</strong> alcohol-based <strong>h<strong>and</strong></strong>rub increased from<br />
approximately 4 to 15 L per 1000 patient-days. The observed<br />
rate changes in that study may be explained by<br />
the comprehensive information campaign that was<br />
conducted during the 4-year period. Notably, the campaign<br />
involved all staff members at the hospital, including<br />
senior members from all wards <strong>and</strong> departments.<br />
In addition, 2 unit-specific studies have reported decreased<br />
infection <strong>rates</strong> with increased <strong>use</strong> <strong>of</strong> <strong>h<strong>and</strong></strong>
www.ajicjournal.org<br />
Vol. 37 No. 4<br />
Infections (%)<br />
15<br />
12<br />
9<br />
6<br />
3<br />
0<br />
24 29 34 39 44 49<br />
H<strong>and</strong> <strong>hygiene</strong> <strong>products</strong> (litres/1,000 patient days)<br />
Fig 2. Ward-specific prevalence <strong>of</strong> health careassociated<br />
infections from 32 point prevalence<br />
surveys by <strong>use</strong> <strong>of</strong> <strong>h<strong>and</strong></strong> disinfectants <strong>and</strong> soap (liters/<br />
1000 patient-days) at Haukel<strong>and</strong> University Hospital,<br />
Norway, 1998-2005. Triangles <strong>and</strong> segmented line<br />
represent infection <strong>rates</strong> <strong>and</strong> predicted infection<br />
rate, respectively, for wards with infection <strong>rates</strong><br />
.9% in 1998; dots <strong>and</strong> solid line represent infection<br />
<strong>rates</strong> <strong>and</strong> predicted infection <strong>rates</strong>, respectively, for<br />
wards with infection <strong>rates</strong> #9% in 1998. Prediction<br />
<strong>of</strong> infection <strong>rates</strong> was based on unadjusted linear<br />
regression analysis.<br />
<strong>hygiene</strong> <strong>products</strong>. In an intervention study, <strong>use</strong> <strong>of</strong> <strong>h<strong>and</strong></strong>rub<br />
in a neonatal unit increased from 67 to 89 L per<br />
1000 patient-days after implementing a <strong>h<strong>and</strong></strong> <strong>hygiene</strong><br />
education program, while infection <strong>rates</strong> decreased<br />
by 38% (ie, from 13% to 8%). 31 In another intervention<br />
study, there was a 30% reduction in the infection <strong>rates</strong><br />
in the units <strong>of</strong> a health care facility in which alcoholbased<br />
<strong>h<strong>and</strong></strong> sanitizer was <strong>use</strong>d, compared with units<br />
in which no such sanitizer was <strong>use</strong>d. 32<br />
We observed that the <strong>use</strong> <strong>of</strong> <strong>h<strong>and</strong></strong> soap slightly decreased<br />
from 26 to 22 L per 1000 patient-days from<br />
1998 to 2005 but that the <strong>use</strong> <strong>of</strong> <strong>h<strong>and</strong></strong> disinfectants<br />
strongly increased from 3 to 22 L per 1000 patientdays.<br />
It is likely that the strong increase in <strong>h<strong>and</strong></strong> disinfection<br />
may be due to a gradual shift in the practice <strong>of</strong><br />
<strong>h<strong>and</strong></strong> <strong>hygiene</strong> performance, accompanied by better<br />
compliance, more frequent education, <strong>and</strong> increased<br />
availability <strong>of</strong> <strong>h<strong>and</strong></strong> <strong>hygiene</strong> <strong>products</strong>. A small portion<br />
<strong>of</strong> the increase in <strong>h<strong>and</strong></strong> disinfectants may also be related<br />
to the number <strong>of</strong> staff. From 2000 to 2005, there<br />
was an overall 8% increase in health care personnel at<br />
our hospital. The relative increase in the <strong>use</strong> <strong>of</strong> <strong>h<strong>and</strong></strong><br />
disinfectants was 135% (Table 2).<br />
Interestingly, we observed a strong linear doseresponse<br />
relation <strong>between</strong> <strong>use</strong> <strong>of</strong> <strong>h<strong>and</strong></strong> <strong>hygiene</strong> <strong>products</strong><br />
<strong>and</strong> infection <strong>rates</strong> for wards with infection <strong>rates</strong><br />
.9% (P , .001) at study start in 1998 but found no<br />
Herud et al. 315<br />
significant relation when analysis was restricted to<br />
wards with prevalence #9% at study start. This may indicate<br />
that excessive <strong>use</strong> <strong>of</strong> <strong>h<strong>and</strong></strong> <strong>hygiene</strong> <strong>products</strong> is<br />
not an efficient way <strong>of</strong> reducing infections in low-prevalence<br />
wards in hospitals. Notably, the volume range <strong>of</strong><br />
<strong>use</strong> <strong>of</strong> <strong>h<strong>and</strong></strong> <strong>hygiene</strong> <strong>products</strong> was the same for the 2<br />
categorized groups (see Fig 2); however, they differed<br />
slightly with respect to patient characteristics (see Appendix<br />
1). Our study should be repeated, preferably<br />
by intervention studies, for example, by comparing different<br />
amount <strong>of</strong> <strong>use</strong> in 2 low-prevalence hospital<br />
wards. However, in case <strong>of</strong> similarity, the need <strong>of</strong> other<br />
strategies, such as implementing <strong>and</strong> using St<strong>and</strong>ard<br />
Precautions, in addition to <strong>h<strong>and</strong></strong> <strong>hygiene</strong> performance<br />
is necessary to prevent infections in both low- <strong>and</strong><br />
high-prevalence wards.<br />
In most Norwegian hospitals, <strong>h<strong>and</strong></strong> disinfectants<br />
were introduced during the 1990s, but information as<br />
to whether this has improved the <strong>rates</strong> <strong>of</strong> health careassociated<br />
infections in Norway or in other countries<br />
is limited. We tested this hypothesis <strong>and</strong> found that<br />
<strong>use</strong> <strong>of</strong> alcohol-based <strong>h<strong>and</strong></strong> <strong>products</strong> was significantly<br />
associated with decreased infection <strong>rates</strong> at our hospital,<br />
after controlling for <strong>use</strong> <strong>of</strong> <strong>h<strong>and</strong></strong> soap. In particular,<br />
we found a strong increase in the <strong>use</strong> <strong>of</strong> <strong>h<strong>and</strong></strong> disinfectants<br />
during the campaign in 2005 <strong>and</strong> a top in the <strong>use</strong><br />
<strong>of</strong> both <strong>h<strong>and</strong></strong> soap <strong>and</strong> disinfectants after the campaign<br />
in 2000. Although information <strong>and</strong> education seem to<br />
have increased the <strong>use</strong> <strong>of</strong> <strong>h<strong>and</strong></strong> disinfectants, we did<br />
not see an immediate reduction in infection <strong>rates</strong> for<br />
2005. A closer examination, however, revealed an infection<br />
rate <strong>of</strong> 6.5% during the campaign months<br />
April-June 2005, which was approximately 1% lower<br />
than other prevalences this year (data not shown).<br />
There are several strategies for infection control. It is<br />
well-known that high level <strong>of</strong> <strong>h<strong>and</strong></strong> <strong>hygiene</strong> compliance<br />
lowers the risk <strong>of</strong> hospital infections. 19 Compliance<br />
can be improved through education, motivation,<br />
information campaigns, <strong>and</strong> audits, coaching, or feedback<br />
to health personnel. 33-40 However, to maintain<br />
high compliance over time, such interventions have<br />
to be repeated regularly. Although extensive <strong>h<strong>and</strong></strong> <strong>hygiene</strong><br />
performance is effective for disease control, a<br />
simpler but more indirect control method is surveillance<br />
<strong>and</strong> statistic process control <strong>of</strong> hospital infections.<br />
Whenever infection <strong>rates</strong> are unacceptable<br />
high, interventions may be directed at single wards or<br />
health personnel. 41,42 Given the observed inverse association<br />
<strong>between</strong> <strong>use</strong> <strong>of</strong> <strong>h<strong>and</strong></strong> <strong>hygiene</strong> <strong>products</strong> <strong>and</strong> infection<br />
<strong>rates</strong> in the present study, we believe that also<br />
screening the <strong>use</strong> <strong>of</strong> <strong>h<strong>and</strong></strong> <strong>hygiene</strong> <strong>products</strong> may be a<br />
tool for infection control. Whenever <strong>use</strong> <strong>of</strong> <strong>h<strong>and</strong></strong> disinfectants<br />
is decreasing, specific interventions may be<br />
performed to increase <strong>use</strong>, which may in turn lead to<br />
lower infection <strong>rates</strong>.
316 Herudetal. American Journal <strong>of</strong> Infection Control<br />
May 2009<br />
In conclusion, by using data from a low-prevalence<br />
hospital in Norway, we observed a modest inverse association<br />
<strong>between</strong> <strong>use</strong> <strong>of</strong> <strong>h<strong>and</strong></strong> <strong>hygiene</strong> <strong>products</strong> <strong>and</strong><br />
<strong>rates</strong> <strong>of</strong> infections. Quantifying <strong>use</strong> <strong>of</strong> such <strong>products</strong><br />
over time along with surveillance <strong>of</strong> hospital infections<br />
may serve as an indicator for <strong>h<strong>and</strong></strong> <strong>hygiene</strong> performance<br />
in hospitals.<br />
The authors thank Anne Dalheim at the Centre for Infection Control for administering<br />
the point prevalence surveys at our hospital <strong>and</strong> to Ketil Kvernerod for providing<br />
staff numbers.<br />
References<br />
1. Boyce J. It is time for action: improving <strong>h<strong>and</strong></strong> <strong>hygiene</strong> in hospitals. Ann<br />
Intern Med 1999;130:153-5.<br />
2. Pittet D, Boyce JM. H<strong>and</strong> <strong>hygiene</strong> <strong>and</strong> patient care: pursuing the Semmelweis<br />
legacy. Lancet 2001;5(Suppl):9-20.<br />
3. Pittet D, Simon A, Hugonnet S, Pessoa-Silva CL, Sauvan V, Perneger<br />
TV. H<strong>and</strong> <strong>hygiene</strong> among physicians: performance, beliefs <strong>and</strong> perceptions.<br />
Ann Intern Med 2004;141:1-8.<br />
4. Voss A, Widmer AF. No time for <strong>h<strong>and</strong></strong>washing! H<strong>and</strong>washing versus<br />
alcohol rub: can we afford 100% compliance?. Infect Control Hosp Epidemiol<br />
1997;18:205-8.<br />
5. Whitby M, Pessoa-Silva CL, McLaws ML, Allegranzi B, Sax H, Larson E,<br />
et al. Behavioural considerations for <strong>h<strong>and</strong></strong> <strong>hygiene</strong> practices: the basic<br />
building blocks. J Hosp Infect 2007;65:1-8.<br />
6. Boyce JM, Pittet D. Guideline for <strong>h<strong>and</strong></strong> <strong>hygiene</strong> in health-care settings.<br />
Healthcare Infection Control Practices Advisory Committee, recommendations.<br />
CDC. MMWR 2002;51(RR-16):1-44.<br />
7. The Norwegian Institute <strong>of</strong> Public Health: (in Norwegian) Nasjonal veileder<br />
for ha˚nd<strong>hygiene</strong>. Smittevern 2004; :11.fhi, NO-0403 Oslo, Norway.<br />
8. The Norwegian Institute <strong>of</strong> Public Health: (in Norwegian) Evaluering.<br />
Ren omsorg. Rapport 2006; 1.fhi, NO-0403 Oslo, Norway.<br />
9. Tvedt C, Bukholm G. Alcohol-based <strong>h<strong>and</strong></strong> disinfection: a more robust<br />
<strong>h<strong>and</strong></strong>-<strong>hygiene</strong> method in an intensive care unit. J Hosp Infect 2005;59:<br />
229-34.<br />
10. Pittet D. Compliance with <strong>h<strong>and</strong></strong> disinfection <strong>and</strong> its impact on hospitalacquired<br />
infections. J Hosp Infect 2001;48(Suppl A):S40-6.<br />
11. Gordin FM, Schultz ME, Huber RA, Gill JA. Reduction in nosocomial<br />
transmission <strong>of</strong> drug-resistant bacteria after introduction <strong>of</strong> an alcohol-based<br />
<strong>h<strong>and</strong></strong>rub. Infect Control Hosp Epidemiol 2005;26:650-3.<br />
12. Larson EL, Cimiotti J, Haas J, Parides M, Nesin M, Della-Latta PH, et al.<br />
Effect <strong>of</strong> antiseptic <strong>h<strong>and</strong></strong>washing vs alcohol sanitizer on health care-associated<br />
infections in neonatal intensive care units. Arch Pediatr Adolesc<br />
Med 2005;159:377-83.<br />
13. Girou E, Loyeau S, Legr<strong>and</strong> P, Oppein F, Brun-Buisson Chr. Efficacy <strong>of</strong><br />
<strong>h<strong>and</strong></strong> rubbing with alcohol-based solution versus st<strong>and</strong>ard <strong>h<strong>and</strong></strong>washing<br />
with antiseptic soap: r<strong>and</strong>omised clinical trial. BMJ 2002;325:362.<br />
14. Kac G, Podglajen I, Gueneret M, Vaupré S, Bissery A, Meyer G. Microbiological<br />
evaluation <strong>of</strong> two <strong>h<strong>and</strong></strong> <strong>hygiene</strong> procedures achieved by<br />
healthcare workers during routine patient care: a r<strong>and</strong>omized study.<br />
J Hosp Infect 2005;60:32-9.<br />
15. Lam BCC, Lee J, Lau YL. H<strong>and</strong> <strong>hygiene</strong> practices in a neonatal intensive<br />
care unit: a multimodal intervention <strong>and</strong> impact on nosocomial infection.<br />
Pediatrics 2004;114:e565-71.<br />
16. Rosenthal VD, Guzman S, Safdar N. Reduction in nosocomial infection<br />
with improved <strong>h<strong>and</strong></strong> <strong>hygiene</strong> in intensive care units <strong>of</strong> a tertiary care<br />
hospital in Argentina. Am J Infect Control 2005;33:392-7.<br />
17. Pittet D. Improving adherence to <strong>h<strong>and</strong></strong> <strong>hygiene</strong> practice: a multidisciplinary<br />
approach. Emerg Infect Dis 2001;7:234-40.<br />
18. Gould DJ, Drey NS, Maralejo D, Grimshaw J, Chudleigh J. Interventions<br />
to improve <strong>h<strong>and</strong></strong> <strong>hygiene</strong> compliance in patient care. J Hosp Infect<br />
2008;68:193-202.<br />
19. Pittet D, Hugonnet S, Harbarth S, Mourouga Ph, Sauvan V, Touveneau<br />
S, et al. Effectiveness <strong>of</strong> a hospital-wide programme to improve compliance<br />
with <strong>h<strong>and</strong></strong> <strong>hygiene</strong>. Lancet 2000;356:1307-12.<br />
20. Haley RW, Culver D, White JW, Morgan WM, Emori TG, Munn P,<br />
et al. The efficacy <strong>of</strong> infection surveillance <strong>and</strong> control programs in<br />
preventing nosocomial infections in us hospitals. Am J Epidemiol<br />
1984;121:182-205.<br />
21. Sartor C, Delchambre A, Pascal L, Drancourt M, De Micco P, Sambuc<br />
R. Assessment <strong>of</strong> the value <strong>of</strong> repeated point-prevalence surveys for<br />
analyzing the trend in nosocomial infections. Infect Control Hosp Epidemiol<br />
2005;26:369-73.<br />
22. Gastmeier P, Geffers C, Br<strong>and</strong>t C, Zuschneid I, Sohr D, Schwab F, et al.<br />
Effectiveness <strong>of</strong> a nationwide nosocomial infection surveillance system<br />
for reducing nosocomial infections. J Hosp Infect 2006;64:16-22.<br />
23. Orsi GB, Scorzolini L, Franchi C, Mondillo V, Rosa G, Venditti M. Hospital-acquired<br />
infection surveillance in a neurosurgical intensive care<br />
unit. J Hosp Infect 2006;64:23-9.<br />
24. Garner JS, Jarvis WR, Emori TG, Horan TC, Hughes JM. CDC definitions<br />
for nosocomial infections. Am J Infect Control 1988;16:128-40.<br />
25. Public health focus: surveillance, prevention, <strong>and</strong> control <strong>of</strong> nosocomial<br />
infections. MMWR 1992;41:783-7.<br />
26. Horan TC, Gaynes RP. Surveillance <strong>of</strong> nosocomial infections. In: Mayhall<br />
CG, editor. Hospital epidemiology <strong>and</strong> infection control. 3rd ed.<br />
Philadelphia: Lippincott Williams & Wilkins; 2004. p. 1659-702.<br />
27. Davison AC, Hinkley DV. Bootstrap methods <strong>and</strong> their application.<br />
New York: Cambridge University Press; 1997.<br />
28. Aavitsl<strong>and</strong> P, Stormark M, Lystad A. Hospital-acquired infections in<br />
Norway: a national prevalence survey in 1991. Sc<strong>and</strong> J Infect Dis<br />
1992;24:477-83.<br />
29. Scheel O, Stormark M. National prevalence survey on hospital infections<br />
in Norway. J Hosp Infect 1999;41:331-5.<br />
30. Eriksen HM, Iversen BG, Aavitsl<strong>and</strong> P. Prevalence <strong>of</strong> nosocomial infections<br />
in hospitals in Norway, 2002 <strong>and</strong> 2003. J Hosp Infect 2005;60:<br />
40-5.<br />
31. Pessoa-Silva CL, Hugonnet S, Pfister R, Touveneau S, Dharan S, Posfay-<br />
Barbe K, et al. Reduction <strong>of</strong> health care-associated infection risk in neonates<br />
by successful <strong>h<strong>and</strong></strong> <strong>hygiene</strong> promotion. Pediatrics 2007;120:<br />
e382-90.<br />
32. Fendler EJ, Ali Y, Hammond BS, Lyons MK, Kelley MB, Vowell NA. The<br />
impact <strong>of</strong> alcohol <strong>h<strong>and</strong></strong> sanitizer <strong>use</strong> on infection <strong>rates</strong> in an extended<br />
care facility. Am J Infect Control 2002;30:226-33.<br />
33. Rykkje L, Heggelund A, Harthug S. Improved <strong>h<strong>and</strong></strong> <strong>hygiene</strong> through<br />
simple interventions. Tidsskr Nor Laegeforen 2007;127:861-3.<br />
34. King S. Provision <strong>of</strong> alcohol <strong>h<strong>and</strong></strong> rub at the hospital bedside: a case<br />
study. J Hosp Infect 2004;56:S10-2.<br />
35. Duerink DO, Farida H, Nagelkerke NJ, Wahyono H, Keuter M, Lestari<br />
ES, et al. Preventing nosocomial infections: improving compliance with<br />
st<strong>and</strong>ard precautions in an Indonesian teaching hospital. J Hosp Infect<br />
2006;64:36-43.<br />
36. Creedon SA. Healthcare workersÕ <strong>h<strong>and</strong></strong> decontamination practices:<br />
compliance with recommended guidelines. J Adv Nurs 2005;51:<br />
208-16.<br />
37. Kampf G. The six golden rules to improve compliance in <strong>h<strong>and</strong></strong> <strong>hygiene</strong>.<br />
J Hosp Infect 2004;56:S3-5.<br />
38. Larson E. A tool to assess barriers to adherence to <strong>h<strong>and</strong></strong> <strong>hygiene</strong><br />
guideline. Am J Infect Control 2004;32:48-51.<br />
39. Scott AA, Hughes J, Hall D. Views <strong>and</strong> underst<strong>and</strong>ing <strong>of</strong> senior nursing<br />
staff in relation to infection control. Br J Infect Control 2005;6:23-6.<br />
40. Lankford M, Zembower TR, Trick WE, Hacek DM, Noskin GA, Peterson<br />
LR. Influence <strong>of</strong> role models <strong>and</strong> hospital design on <strong>h<strong>and</strong></strong> <strong>hygiene</strong><br />
<strong>of</strong> health care workers. Emerg Infect Dis 2003;9:217-33.<br />
41. R<strong>and</strong>le J, Clarke M, Storr J. H<strong>and</strong> <strong>hygiene</strong> compliance in healthcare<br />
workers. J Hosp Infect 2006;64:205-9.<br />
42. Pittet D. Infection control <strong>and</strong> quality health care in the new millennium.<br />
Am J Infect Control 2005;33:258-67.
www.ajicjournal.org<br />
Vol. 37 No. 4<br />
Appendix 1 Characteristics <strong>of</strong> 27,248 patients<br />
with infection status at Haukel<strong>and</strong> University Hospital,<br />
Norway, 1998-2005, among wards with infections<br />
<strong>rates</strong> .9% <strong>and</strong> wards with infection <strong>rates</strong> #9% at<br />
study start in 1998.<br />
Prevalence .9% Prevalence #9%<br />
Characteristics No. % No. %<br />
All 14,287 100.0 12,961 100.0<br />
Survey time interval<br />
January-March 3555 24.9 3396 26.2<br />
April-June 3398 23.8 3155 24.3<br />
July-October 3617 25.3 3145 24.3<br />
November-December 3717 26.0 3265 25.2<br />
Age<br />
Unknown 12 0.1 17 0.1<br />
,15 Yr 3087 21.6 399 3.1<br />
15-34 Yr 2650 18.5 1491 11.5<br />
35-54 Yr 2075 14.5 2837 21.9<br />
55-74 Yr 3252 22.8 4523 34.9<br />
.74 Yr 3211 22.5 3694 28.5<br />
Gender<br />
Woman 8510 59.6 6154 47.5<br />
Man 5777 40.4 6807 52.5<br />
Surgical operation<br />
No 9827 68.8 10,206 78.7<br />
Yes 4460 31.2 2755 21.3<br />
Urinary tract catheter<br />
No 12,500 87.5 11,449 88.3<br />
Yes 1787 12.5 1512 11.7<br />
Herud et al. 317


