
Create successful ePaper yourself
Turn your PDF publications into a flip-book with our unique Google optimized e-Paper software.
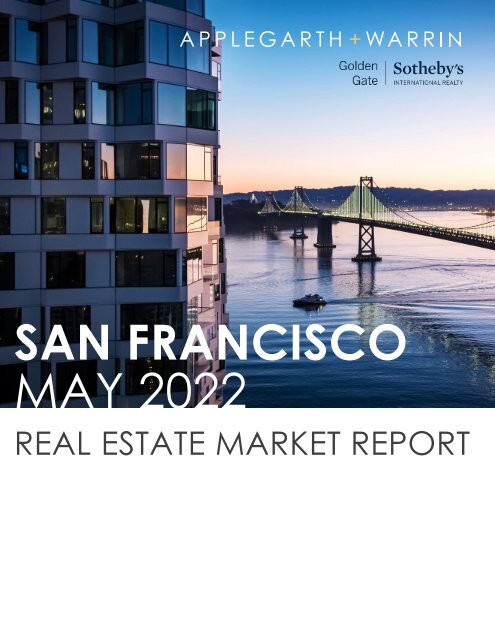
SAN FRANCISCO<br />
MAY <strong>2022</strong><br />
REAL ESTATE MARKET REPORT
MARKET REPORT | Q3 2021
PAUL WARRIN<br />
BROKER ASSOCIATE<br />
SAN FRANCISCO SPECIALIST<br />
The first five months of <strong>2022</strong> have seen prices continue to<br />
increase, with median prices up 14% for single family homes,<br />
and up 13% for condos. Inventory remains tight, with new<br />
listings down 39% for <strong>SF</strong>Hs and 26% for condos.<br />
April’s median <strong>SF</strong>H price of $2,120,000 is up 25% from the prepandemic<br />
high in June 2019. Meanwhile, condo prices are up<br />
just 1.5% from their pre-pandemic high in October 2019, with<br />
the median price now at $1,320,000.<br />
Districts 3, 4, and 5 continue to see the biggest gains in prices.<br />
High end homes continue to sell at a brisk pace, with 8 homes<br />
selling for over $10M so far this year, including 2518 Jackson<br />
($16.5M), 3747 Jackson ($15.75M), 50 Arguello ($15.5M), and<br />
2505 Pacific ($15M).<br />
Many buyers are anxious to buy before interest rates rise again,<br />
however <strong>May</strong> has seen a slowdown in buyer activity due to<br />
stock market fluctuations and impending summer travel plans.<br />
The Applegarth+Warrin team is off to another strong start, with<br />
$73M in homes sold thus far in <strong>2022</strong>.
TRENDING IN <strong>SF</strong><br />
ONE STEUART LANE LIGHTS UP THE<br />
EMBARCADERO<br />
The ultra-luxury condo development in the<br />
Embarcadero was developed by New York-based<br />
Paramount Group and Hong Kong-based SRE Group.<br />
The 20-story tower has 120 units ranging from $1.6M to<br />
$7M range and offers views from the Ferry Building to<br />
the Bay Bridge and includes private outdoor living<br />
spaces with wraparound terraces.<br />
STARTUP RAISING FUNDS TO HELP<br />
CORPORATONS GO CARBON NEUTRAL<br />
San Francisco startup Pachama raised $55 million this<br />
week in a series B to expand operations of its satellite<br />
imaging platform that can detect the carbon intake<br />
of forests. Pachama's platform uses third party satellite<br />
images of forests subject to renewal initiatives to<br />
detect how much carbon the forest is capturing based<br />
on the size and greenness of the foliage, and how it<br />
changes over time<br />
A WHOLE NEW WAY TO BUILD<br />
The construction industry has long been hesitant, if not<br />
skeptical, when it comes to technology. Agora<br />
Systems, is a construction materials procurement<br />
platform which fundamentally alters the way the<br />
construction industry deals with materials procurement<br />
through a digital platform. Agora’s technology plans<br />
to dramatically improve on existing construction<br />
systems in the $10 trillion industry in the US alone.
BEHIND THE SCENES<br />
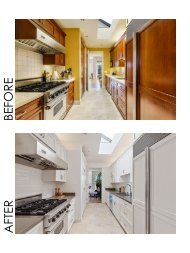
HOME TRAN<strong>SF</strong>ORMATION: FROM DRAB TO FAB<br />
A fresh and modern<br />
kitchen completely<br />
elevated this Corona<br />
Heights home. The<br />
original kitchen with its<br />
granite countertops<br />
tiled floor, was turned<br />
around with the<br />
incorporation of grey<br />
BEFORE veined quartz<br />
countertops, new<br />
hardwood flooring,<br />
paint and contemporary<br />
hardware. Stunning all<br />
the way around.
A+W SAN FRANCISCO<br />
FEATURED PROPERTIES<br />
FOR SALE<br />
PACIFIC HEIGHTS<br />
Pinnacle of Pacific Heights<br />
$4,950,000<br />
FOR SALE<br />
NOB HILL<br />
Luxury Views Condo<br />
$2,795,000<br />
OFF-MARKET<br />
RUSSIAN HILL<br />
Superb Views Condo<br />
$2,500,000<br />
SOLD<br />
NOE VALLEY<br />
Sold Over Asking<br />
$6,250,000<br />
SOLD<br />
NOE VALLEY<br />
Represented Buyer<br />
$5,800,000<br />
SOLD<br />
ASHBURY HEIGHTS<br />
Represented Buyer<br />
$5,505,000<br />
SOLD<br />
NOE VALLEY<br />
Sold Over Asking<br />
$2,650,000<br />
SOLD<br />
NOB HILL<br />
Represented Buyer<br />
$2,450,000<br />
SOLD<br />
RUSSIAN HILL<br />
Sold Over Asking<br />
$2,395,000<br />
FAST FACT : So far this year, the Applegarth + Warrin Team has already sold<br />
$73M in homes thus far in <strong>2022</strong>.
A+W MARIN<br />
FEATURED PROPERTIES<br />
COMING SOON<br />
KENTFIELD<br />
Graceful Kentfield Home<br />
Price Upon Request<br />
PENDING<br />
KENTFIELD<br />
Exceptional Kentfield Estate<br />
$6,450,000<br />
OFF MARKET<br />
TIBURON<br />
Tiburon Views Estate<br />
$6,495,000<br />
SOLD<br />
TIBURON<br />
Stunning Tiburon Views Estate<br />
$8,000,000<br />
SOLD<br />
KENTFIELD<br />
Represented Buyer<br />
$8,000,000<br />
SOLD<br />
MILL VALLEY<br />
Designer Mill Valley Home<br />
$7,050,000<br />
SOLD<br />
BELVEDERE<br />
Corinthian Island Stunner<br />
$5,050,000<br />
SOLD<br />
SAN ANSELMO<br />
Represented Buyer<br />
$3,200,000<br />
SOLD<br />
TIBURON<br />
Sold Over Asking<br />
$3,100,000
SINGLE FAMILY MARKET TRENDS<br />
MEDIAN<br />
$1,875,000<br />
HIGH<br />
$16,500,000<br />
LOW<br />
$750,000<br />
AVERAGE<br />
$2,355,231<br />
SALES BY DISTRICT ·SINGLE FAMILY HOMES · Q1 <strong>2022</strong><br />
533 homes<br />
City Average Median High Sale Price/<strong>SF</strong> # of Sales DOM<br />
District 1 $2,966,570 $2,360,000 $8,950,000 $1,135 47 21<br />
District 2 $1,854,953 $1,784,000 $3,450,000 $1,142 97 19<br />
District 3 $1,599,134 $1,400,000 $3,400,000 $903 41 25<br />
District 4 $2,450,711 $2,300,000 $5,300,000 $1,016 69 17<br />
District 5 $3,117,523 $2,650,000 $8,100,000 $1,198 77 19<br />
District 6 $3,136,200 $2,850,000 $5,300,000 $972 15 29<br />
District 7 $5,933,438 $4,987,500 $16,500,000 $1,457 24 31<br />
District 8 $3,471,071 $2,645,000 $7,700,000 $1,386 7 97<br />
District 9 $2,057,867 $1,825,000 $5,625,000 $1,027 59 18<br />
District 10 $1,300,090 $1,275,000 $2,190,000 $821 97 23<br />
San Francisco $2,355,231 $1,875,000 $16,500,000 $1,056 533 22<br />
DISTRICT 1<br />
Central Richmond, Inner<br />
Richmond, Outer Richmond,<br />
Jordan Park/Laurel Heights,<br />
Presidio, Lake Street, Sea Cliff,<br />
Lone Mountain<br />
DISTRICT 2<br />
Golden Gate Heights, Outer<br />
Parkside, Outer Sunset,<br />
Parkside, Central Sunset,<br />
Inner Sunset, Inner Parkside<br />
DISTRICT 3<br />
Lake Shore, Merced Heights,<br />
Pine Lake Park, Stonestown,<br />
Lakeside, Merced Manor,<br />
Ingleside, Ingleside Heights,<br />
Oceanview<br />
DISTRICT 4<br />
Balboa Terrace, Diamond Heights, Forest<br />
Hill, Forest Knolls, Ingleside Terrace,<br />
Midtown Terrace, Saint Francis Wood,<br />
Miraloma Park, Forest Hill Extension,<br />
Sherwood Forest, Mount Davidson<br />
Manor, Westwood Highlands, Westwood<br />
Park, Sunnyside, West Portal, Monterey<br />
Heights<br />
DISTRICT 5<br />
Glen Park, Haight Ashbury, Noe Valley,<br />
Twin Peaks, Cole Valley/Parnassus<br />
Heights, Buena Vista/Ashbury Heights,<br />
Castro, Corona Heights, Clarendon<br />
Heights, Duboce Triangle, Eureka<br />
Valley/Dolores Heights, Mission Dolores<br />
DISTRICT 6<br />
Anza Vista, Hayes Valley,<br />
Lower Pacific Heights,<br />
Western Addition, Alamo<br />
Square, North Panhandle<br />
DISTRICT 7<br />
Marina, Pacific Heights,<br />
Presidio Heights, Cow<br />
Hollow<br />
DISTRICT 8<br />
Downtown, Financial<br />
District/Barbary Coast, Nob<br />
Hill, North Beach, Russian<br />
Hill, Van Ness/Civic Center,<br />
Telegraph Hill, North<br />
Waterfront, Tenderloin<br />
DISTRICT 9<br />
Bernal Heights, Inner<br />
Mission, Mission Bay,<br />
Potrero Hill, South of<br />
Market, Yerba Buena,<br />
South Beach, Central<br />
Waterfront/Dogpatch<br />
DISTRICT 10<br />
Bayview, Crocker<br />
Amazon, Excelsior,<br />
Outer Mission,<br />
Visitacion Valley,<br />
Portola, Silver Terrace,<br />
Mission Terrace,<br />
Hunter’s Point, Bayview<br />
Heights, Candlestick,<br />
Little Hollywood
CONDO MARKET TRENDS<br />
MEDIAN<br />
$1,200,000<br />
HIGH<br />
$6,000,000<br />
LOW<br />
$330,163<br />
AVERAGE<br />
$1,386,495<br />
818 homes<br />
SALES BY DISTRICT · CONDOS · Q1 <strong>2022</strong><br />
City Average Median High Sale Price/<strong>SF</strong> # of Sales DOM<br />
District 1 $1,359,829 $1,255,000 $3,193,125 $1,145 46 29<br />
District 2 $1,312,433 $1,300,000 $1,659,900 $1,137 9 42<br />
District 3 $706,625 $707,500 $842,000 $835 8 42<br />
District 4 $787,608 $790,000 $1,240,000 $898 17 35<br />
District 5 $1,586,392 $1,500,000 $4,180,000 $1,186 121 23<br />
District 6 $1,357,059 $1,265,000 $3,100,000 $1,146 93 32<br />
District 7 $2,007,991 $1,562,000 $5,300,000 $1,340 74 34<br />
District 8 $1,282,800 $1,000,000 $6,000,000 $1,172 142 48<br />
District 9 $1,307,527 $1,115,000 $5,595,000 $1,146 283 48<br />
District 10 $872,296 $850,000 $1,200,000 $724 25 39<br />
San Francisco $1,386,495 $1,200,000 $6,000,000 $1,152 818 40<br />
DISTRICT 1<br />
Central Richmond, Inner<br />
Richmond, Outer Richmond,<br />
Jordan Park/Laurel Heights,<br />
Presidio, Lake Street, Sea Cliff,<br />
Lone Mountain<br />
DISTRICT 2<br />
Golden Gate Heights, Outer<br />
Parkside, Outer Sunset,<br />
Parkside, Central Sunset,<br />
Inner Sunset, Inner Parkside<br />
DISTRICT 3<br />
Lake Shore, Merced Heights,<br />
Pine Lake Park, Stonestown,<br />
Lakeside, Merced Manor,<br />
Ingleside, Ingleside Heights,<br />
Oceanview<br />
DISTRICT 4<br />
Balboa Terrace, Diamond Heights, Forest<br />
Hill, Forest Knolls, Ingleside Terrace,<br />
Midtown Terrace, Saint Francis Wood,<br />
Miraloma Park, Forest Hill Extension,<br />
Sherwood Forest, Mount Davidson<br />
Manor, Westwood Highlands, Westwood<br />
Park, Sunnyside, West Portal, Monterey<br />
Heights<br />
DISTRICT 5<br />
Glen Park, Haight Ashbury, Noe Valley,<br />
Twin Peaks, Cole Valley/Parnassus<br />
Heights, Buena Vista/Ashbury Heights,<br />
Castro, Corona Heights, Clarendon<br />
Heights, Duboce Triangle, Eureka<br />
Valley/Dolores Heights, Mission Dolores<br />
DISTRICT 6<br />
Anza Vista, Hayes Valley,<br />
Lower Pacific Heights,<br />
Western Addition, Alamo<br />
Square, North Panhandle<br />
DISTRICT 7<br />
Marina, Pacific Heights,<br />
Presidio Heights, Cow<br />
Hollow<br />
DISTRICT 8<br />
Downtown, Financial<br />
District/Barbary Coast, Nob<br />
Hill, North Beach, Russian<br />
Hill, Van Ness/Civic Center,<br />
Telegraph Hill, North<br />
Waterfront, Tenderloin<br />
DISTRICT 9<br />
Bernal Heights, Inner<br />
Mission, Mission Bay,<br />
Potrero Hill, South of<br />
Market, Yerba Buena,<br />
South Beach, Central<br />
Waterfront/Dogpatch<br />
DISTRICT 10<br />
Bayview, Crocker<br />
Amazon, Excelsior,<br />
Outer Mission,<br />
Visitacion Valley,<br />
Portola, Silver Terrace,<br />
Mission Terrace,<br />
Hunter’s Point, Bayview<br />
Heights, Candlestick,<br />
Little Hollywood
SAN FRANCISCO SINGLE FAMILY<br />
MARKET TRENDS<br />
Graphs show trends in market activity comparing this year (solid lines) with last year (dashed<br />
lines)for the same period. Data is for condo/townhomes only. Note: Totals in graphs on this<br />
page may differ from the following page due to differences in data processing from different<br />
sources.<br />
MA RK ET TRENDS<br />
Graphs show trends in market activity comparing this year (solid lines) with last year (dashed lines)<br />
for the same period. Data is for single family homes only. Note: Totals in graphs on this page show<br />
monthly data. The following page shows quarterly data.<br />
Last Year<br />
This Year<br />
Homes for Sale<br />
Last Year vs. This Year<br />
Median Sale Price<br />
Last Year vs. This Year<br />
500<br />
2020 2021<br />
$2.5M<br />
2020 2021<br />
450<br />
400<br />
350<br />
$2M<br />
$2.21M<br />
MAR <strong>2022</strong><br />
$1.8M<br />
MAR 2021<br />
300<br />
$1.5M<br />
250<br />
200<br />
150<br />
100<br />
50<br />
MAR 2021<br />
170<br />
152<br />
MAR <strong>2022</strong><br />
$1M<br />
$0.5M<br />
2021 <strong>2022</strong><br />
0<br />
Apr <strong>May</strong> Jun Jul Aug Sep Oct Nov Dec Jan Feb Mar<br />
2021 <strong>2022</strong><br />
$0M<br />
Apr <strong>May</strong> Jun Jul Aug Sep Oct Nov Dec Jan Feb Mar<br />
350<br />
300<br />
250<br />
200<br />
150<br />
100<br />
Homes Gone Pending and Homes Sold<br />
Last Year vs. This Year<br />
Sold<br />
Pending<br />
Sold Price as % of Original List Price<br />
Last Year vs. This Year<br />
120%<br />
2020 2021 2020 2021<br />
MAR 2021<br />
230<br />
210<br />
MAR <strong>2022</strong><br />
115%<br />
224MAR <strong>2022</strong> 110%<br />
223MAR 2021<br />
105%<br />
100%<br />
117%<br />
MAR <strong>2022</strong><br />
109%<br />
MAR 2021<br />
50<br />
95%<br />
2021 <strong>2022</strong> 2021 <strong>2022</strong><br />
0<br />
90%<br />
Apr <strong>May</strong> Jun Jul Aug Sep Oct Nov Dec Jan Feb Mar<br />
Apr <strong>May</strong> Jun Jul Aug Sep Oct Nov Dec Jan Feb Mar
SAN FRANCISCO CONDOS<br />
MARKET TRENDS<br />
Graphs show trends in market activity comparing this year (solid lines) with last year (dashed<br />
lines)for the same period. Data is for condo/townhomes only. Note: Totals in graphs on this<br />
page may differ from the following page due to differences in data processing from different<br />
sources.<br />
MA RK ET TRENDS<br />
Graphs show trends in market activity comparing this year (solid lines) with last year (dashed lines)<br />
for the same period. Data is for single family homes only. Note: Totals in graphs on this page show<br />
monthly data. The following page shows quarterly data.<br />
1600<br />
1400<br />
1200<br />
Homes for Sale<br />
Last Year vs. This Year<br />
2020 2021<br />
Median Sale Price<br />
Last Year vs. This Year<br />
$1.4M MAR <strong>2022</strong><br />
2020 2021<br />
$1.2M<br />
$1M<br />
Last Year<br />
This Year<br />
$1.29M<br />
$1.25M<br />
MAR 2021<br />
1000<br />
800<br />
600<br />
400<br />
200<br />
MAR <strong>2022</strong><br />
639<br />
612<br />
MAR 2021<br />
$0.8M<br />
$0.6M<br />
$0.4M<br />
$0.2M<br />
2021 <strong>2022</strong><br />
0<br />
Apr <strong>May</strong> Jun Jul Aug Sep Oct Nov Dec Jan Feb Mar<br />
2021 <strong>2022</strong><br />
$0M<br />
Apr <strong>May</strong> Jun Jul Aug Sep Oct Nov Dec Jan Feb Mar<br />
450<br />
400<br />
350<br />
300<br />
250<br />
200<br />
150<br />
100<br />
50<br />
Homes Gone Pending and Homes Sold<br />
Last Year vs. This Year<br />
Pending<br />
Sold<br />
Sold Price as % of Original List Price<br />
Last Year vs. This Year<br />
MAR 2021 108%<br />
2020 2021 2020 2021<br />
416<br />
400MAR 2021 106%<br />
396<br />
MAR <strong>2022</strong><br />
331<br />
104%<br />
102%<br />
100%<br />
98%<br />
96%<br />
94%<br />
106%<br />
MAR <strong>2022</strong><br />
102%<br />
MAR 2021<br />
2021 <strong>2022</strong> 2021 <strong>2022</strong><br />
0<br />
92%<br />
Apr <strong>May</strong> Jun Jul Aug Sep Oct Nov Dec Jan Feb Mar<br />
Apr <strong>May</strong> Jun Jul Aug Sep Oct Nov Dec Jan Feb Mar
DISTRICT 1 SALES<br />
RICHMOND/LAKE/SEA CLIFF<br />
SINGLE FAMILY<br />
.07% 8.1%<br />
$2,543,500<br />
MEDIAN SALES<br />
$1,208<br />
PER SQFT<br />
Q1 22 vs Q1 21<br />
.09%<br />
$1,402,500<br />
CONDO<br />
MEDIAN SALES<br />
16.1%<br />
$1,188<br />
PER SQFT<br />
222 El Camino Del Mar<br />
$5,900,000<br />
Sold April 29<br />
Address Subdistrict Sale Price Date DOM BR BA Sq Feet % Over List<br />
222 El Camino Del Mar Sea Cliff $5,900,000 29-Apr 13 4 4 3510 13.6%<br />
570 7th Inner Richmond $4,000,570 5-<strong>May</strong> 4 5 4 2742 14.4%<br />
104 3rd Lake Street $3,250,000 3-<strong>May</strong> 7 3 3 2034 20.6%<br />
215 El Camino Del Mar Sea Cliff $3,460,000 6-<strong>May</strong> 11 3 2 2160 28.4%<br />
425 24th Central Richmond $2,425,000 9-<strong>May</strong> 32 4 4 2374 -2.6%<br />
3633 Clement Outer Richmond $3,553,000 18-<strong>May</strong> 10 5 4 3528 48.4%<br />
169 25th Lake Street $3,500,000 9-<strong>May</strong> 3 3 3 2035 48.9%<br />
51 Parker Jordan Park/Laurel Hts $2,620,000 29-Apr 14 3 2 1925 21.9%<br />
765 42nd Outer Richmond $2,000,000 10-<strong>May</strong> 44 3 2 2296 0.1%<br />
807 42nd Outer Richmond $2,475,000 6-<strong>May</strong> 6 4 2 2166 24.1%<br />
647 11th Inner Richmond $2,400,088 2-<strong>May</strong> 16 3 2 2085 33.3%<br />
890 28th Central Richmond $2,025,000 11-<strong>May</strong> 12 4 2 2465 12.8%<br />
124 4th #A Lake Street $2,300,000 17-<strong>May</strong> 5 3 2 1441 28.1%<br />
8 Jordan #3 Jordan Park/Laurel Hts $1,637,500 6-<strong>May</strong> 15 2 2 1336 -2.2%<br />
617 3rd Inner Richmond $1,925,000 2-<strong>May</strong> 7 2 2 1740 16.7%<br />
7825 Geary Outer Richmond $1,568,000 12-<strong>May</strong> 11 5 2 2265 4.5%<br />
369 18th #301 Central Richmond $1,540,000 9-<strong>May</strong> 14 2 2 1174 10.2%<br />
2020 Clement #2 Central Richmond $1,725,000 29-Apr 14 3 2 1480 23.7%<br />
741 Clement #207 Inner Richmond $1,650,000 18-<strong>May</strong> 6 3 2 1566 27.4%<br />
736 36th Outer Richmond $1,720,000 10-<strong>May</strong> 14 3 1 1470 43.9%<br />
741 Clement #202 Inner Richmond $1,455,000 6-<strong>May</strong> 13 2 2 1322 44.1%<br />
36 6th Lake Street $1,365,000 2-<strong>May</strong> 8 2 1 976 37.2%<br />
195 20th #9 Lake Street $790,000 6-<strong>May</strong> 12 1 1 638 14.8%
DISTRICT 2 SALES<br />
SUNSET AND PARKSIDE<br />
SINGLE FAMILY<br />
12.4%<br />
$1,830,000<br />
MEDIAN SALES<br />
10.9%<br />
$1,193<br />
PER SQFT<br />
Q1 22 vs Q1 21<br />
22.3%<br />
$1,345,000<br />
CONDO<br />
MEDIAN SALES<br />
.03%<br />
$1,114<br />
PER SQFT<br />
1265 4th<br />
$3,750,000<br />
Sold <strong>May</strong> 16<br />
Address Subdistrict Sale Price Date DOM BR BA Sq Feet % Over List<br />
1265 4th Inner Sunset $3,750,000 16-<strong>May</strong> 8 4 3 2880 17.4%<br />
2577 21st Parkside $2,830,000 16-<strong>May</strong> 15 6 4 3500 41.9%<br />
1922 Funston Golden Gate Heights $2,650,000 13-<strong>May</strong> 66 5 4 2432 -3.6%<br />
1291 33rd Central Sunset $2,530,000 12-<strong>May</strong> 19 4 4 2350 26.8%<br />
1554 20th Central Sunset $2,525,000 9-<strong>May</strong> 20 5 4 2241 15.8%<br />
1318 11th Inner Sunset $2,330,000 12-<strong>May</strong> 0 3 2 1840 16.8%<br />
2554 Great Highway Outer Parkside $2,307,000 18-<strong>May</strong> 11 3 2 1517 44.6%<br />
1 Cascade Golden Gate Heights $2,250,000 18-<strong>May</strong> 60 5 2 1918 -10.0%<br />
2536 22nd Parkside $2,150,000 19-<strong>May</strong> 15 4 4 2308 43.8%<br />
1906 Funston Golden Gate Heights $2,100,000 13-<strong>May</strong> 6 2 2 1620 20.1%<br />
2723 39th Outer Parkside $2,057,000 12-<strong>May</strong> 11 3 3 1606 29.0%<br />
2550 19th Inner Parkside $1,960,000 6-<strong>May</strong> 12 4 2 2063 31.1%<br />
2723 37th Outer Parkside $1,955,000 17-<strong>May</strong> 16 4 2 1925 17.1%<br />
1866 45th Outer Sunset $1,905,000 13-<strong>May</strong> 17 3 3 2105 6.0%<br />
2090 36th Parkside $1,815,000 12-<strong>May</strong> 11 3 3 1350 41.8%<br />
1050 Noriega Inner Sunset $1,780,000 17-<strong>May</strong> 78 4 4 2365 -3.8%<br />
1526 Santiago Parkside $1,700,000 6-<strong>May</strong> 4 2 1 1250 55.3%<br />
1920 14th Golden Gate Heights $1,700,000 17-<strong>May</strong> 24 3 2 1540 -4.8%<br />
1746 33rd Central Sunset $1,700,000 9-<strong>May</strong> 2 2 1 1150 30.8%<br />
2262 26th Parkside $1,660,000 13-<strong>May</strong> 8 2 1 1425 20.3%<br />
3827 Moraga Outer Sunset $1,600,000 6-<strong>May</strong> 14 3 1 1125 6.8%<br />
1477 46th Outer Sunset $1,580,000 12-<strong>May</strong> 12 3 2 1350 13.0%<br />
1655 48th Outer Sunset $1,500,000 10-<strong>May</strong> 0 2 1 697 37.0%
DISTRICT 3 SALES<br />
OCEANVIEW TO LAKESHORE<br />
SINGLE FAMILY<br />
20.8% 7.6%<br />
$1,650,000<br />
MEDIAN SALES<br />
$993<br />
PER SQFT<br />
Q1 22 vs Q1 21<br />
33%<br />
$730,000<br />
CONDO<br />
MEDIAN SALES<br />
14.6%<br />
$858<br />
PER SQFT<br />
3020 26th<br />
$2,550,000<br />
Sold April 27<br />
Address Subdistrict Sale Price Date DOM BR BA Sq Feet % Over List<br />
3020 26th Merced Manor $2,550,000 27-Apr 11 4 3 2768 16.5%<br />
20 Stratford Lakeside $2,400,000 25-Apr 13 4 4 2180 27.7%<br />
155 Broadmoor Lakeside $2,318,000 18-Apr 7 3 3 2170 16.0%<br />
3055 23rd Merced Manor $2,070,000 29-Apr 13 3 2 2019 29.5%<br />
67 Middlefield Lake Shore $1,900,000 4-<strong>May</strong> 10 3 2 1481 46.4%<br />
67 Inverness Lake Shore $1,850,000 22-Apr 10 2 1 1665 16.0%<br />
293 Summit Stonestown $1,740,000 29-Apr 22 3 3 2001 -3.3%<br />
768 Junipero Serra Lakeside $1,739,000 6-<strong>May</strong> 13 2 1 1442 14.0%<br />
621 Sargent Ingleside Heights $1,615,000 21-Apr 13 3 3 1599 29.3%<br />
621 Shields Merced Heights $1,590,000 17-<strong>May</strong> 12 3 2 1350 45.2%<br />
120 Summit Stonestown $1,500,000 19-Apr 7 3 2 1547 25.2%<br />
135 Vale Pine Lake Park $1,450,000 17-<strong>May</strong> 12 2 3 1500 22.1%<br />
134 Ramsell Ingleside Heights $1,400,000 15-Apr 14 4 1 1476 33.3%<br />
242 Lake Merced Lake Shore $1,371,000 29-Apr 14 3 3 2062 24.6%<br />
126 Byxbee Ingleside Heights $1,288,000 15-Apr 13 2 1 812 17.1%<br />
132 Thrift Oceanview $1,280,000 17-<strong>May</strong> 6 4 3 1640 28.1%<br />
256 Sadowa Oceanview $1,228,000 27-Apr 10 3 1 1470 36.6%<br />
366 Louisburg Ingleside $1,225,000 13-<strong>May</strong> 11 2 2 1200 22.7%<br />
2211 San Jose Ingleside $1,200,000 18-<strong>May</strong> 6 3 2 1600 9.2%<br />
178 Ralston Ingleside Heights $1,175,000 3-<strong>May</strong> 23 2 1 907 18.9%<br />
121 Randolph Ingleside Heights $1,150,000 15-Apr 4 3 3 1139 27.9%<br />
8300 Oceanview #214 Ingleside Heights $725,000 2-<strong>May</strong> 64 2 2 984 0.0%<br />
8100 Oceanview #416 Ingleside Heights $700,000 25-Apr 49 2 2 948 0.1%
DISTRICT 4 SALES<br />
FOREST KNOLLS TO WESTWOOD PK<br />
SINGLE FAMILY<br />
21.9% 12.5%<br />
$2,317,000<br />
MEDIAN SALES<br />
$1,188<br />
PER SQFT<br />
Q1 22 vs Q1 21<br />
11.6%<br />
$804,000<br />
CONDO<br />
MEDIAN SALES<br />
2.6%<br />
$922<br />
PER SQFT<br />
196 Castenada<br />
$5,200,000<br />
Sold <strong>May</strong> 12<br />
Address Subdistrict Sale Price Date DOM BR BA Sq Feet % Over List<br />
196 Castenada Forest Hill $5,200,000 12-<strong>May</strong> 7 4 4 3829 40.7%<br />
990 Monterey Westwood Highlands $4,150,000 10-<strong>May</strong> 14 4 4 4655 3.9%<br />
637 Darien Mount Davidson Manor $3,800,000 3-<strong>May</strong> 10 5 4 3691 11.8%<br />
240 Santa Ana Balboa Terrace $3,525,000 4-<strong>May</strong> 13 5 5 3066 31.0%<br />
50 Juanita Miraloma Park $2,876,000 13-<strong>May</strong> 13 4 4 2438 30.8%<br />
1476 Portola West Portal $2,750,000 12-<strong>May</strong> 24 3 2 2800 10.1%<br />
315 Vicente West Portal $2,600,000 6-<strong>May</strong> 8 3 2 2504 18.5%<br />
184 Lunado Ingleside Terrace $2,550,000 11-<strong>May</strong> 2 5 6 2331 2.0%<br />
553 Wildwood Westwood Park $2,480,000 16-<strong>May</strong> 9 5 4 2146 30.6%<br />
465 Castenada Forest Hill $2,275,000 13-<strong>May</strong> 11 3 2 1874 3.5%<br />
349 Dellbrook Midtown Terrace $2,140,000 11-<strong>May</strong> 6 3 2 1675 22.3%<br />
27 Los Palmos Miraloma Park $2,125,000 5-<strong>May</strong> 2 3 2 1540 6.3%<br />
255 crestmont Forest Knolls $2,062,631 2-<strong>May</strong> 49 4 3 2739 -6.2%<br />
347 Oak Park Forest Knolls $2,015,000 6-<strong>May</strong> 0 3 3 1564 26.3%<br />
225 Detroit Sunnyside $1,875,000 17-<strong>May</strong> 9 2 2 1170 34.4%<br />
243 Bella Vista Miraloma Park $1,800,000 3-<strong>May</strong> 15 3 2 1557 20.2%<br />
706 Faxon Westwood Park $1,750,000 9-<strong>May</strong> 8 2 2 1396 25.4%<br />
239 Crestmont Forest Knolls $1,700,000 12-<strong>May</strong> 6 3 3 1705 36.0%<br />
289 Marietta Miraloma Park $1,625,000 12-<strong>May</strong> 12 4 2 1463 48.4%<br />
416 Melrose Miraloma Park $1,550,000 5-<strong>May</strong> 12 2 1 1050 14.9%<br />
723 Monterey Sunnyside $1,495,000 16-<strong>May</strong> 50 4 2 1724 0.0%<br />
5040 Diamond Heights Diamond Heights $1,158,000 6-<strong>May</strong> 7 2 2 1052 15.9%<br />
990 Duncan #205G Diamond Heights $850,000 17-<strong>May</strong> 26 2 2 1175 -5.5%
DISTRICT 5 SALES<br />
HAIGHT ASHBURY TO GLEN PARK<br />
SINGLE FAMILY<br />
10% 12.9%<br />
$2,750,000<br />
MEDIAN SALES<br />
$1,307<br />
PER SQFT<br />
Q1 22 vs Q1 21<br />
10.1%<br />
$1,545,000<br />
CONDO<br />
MEDIAN SALES<br />
7.2%<br />
$1,178<br />
PER SQFT<br />
125 Belgrave<br />
$5,505,000<br />
Sold <strong>May</strong> 9<br />
Address Subdistrict Sale Price Date DOM BR BA Sq Feet % Over List<br />
125 Belgrave Cole Valley/Parnassus $5,505,000 9-<strong>May</strong> 14 4 3 2888 11.2%<br />
117 Lyon Haight Ashbury $4,500,000 16-<strong>May</strong> 7 5 4 2352 66.7%<br />
259 Randall Glen Park $4,185,000 13-<strong>May</strong> 0 4 3 2515 4.7%<br />
126 Grattan Cole Valley/Parnassus $4,050,000 10-<strong>May</strong> 12 4 2 2172 35.0%<br />
45 Hartford Eureka Valley/Dolores $3,600,000 9-<strong>May</strong> 19 5 4 3235 0.1%<br />
118 Lyon Haight Ashbury $3,400,000 18-<strong>May</strong> 3 3 3 2470 19.5%<br />
560 Hill Eureka Valley/Dolores $2,988,888 12-<strong>May</strong> 35 4 3 2671 6.9%<br />
3572 19th Mission Dolores $2,925,000 17-<strong>May</strong> 4 3 3 1904 12.7%<br />
156 Henry Duboce Triangle $2,650,000 9-<strong>May</strong> 10 2 2 1305 39.8%<br />
9 Walter Duboce Triangle $2,625,000 11-<strong>May</strong> 8 3 2 1765 22.1%<br />
1159 Church Noe Valley $2,600,000 16-<strong>May</strong> 15 3 3 1862 30.3%<br />
851 Corbett Twin Peaks $2,400,851 13-<strong>May</strong> 4 3 3 2069 20.3%<br />
38 Mars Corona Heights $2,338,000 18-<strong>May</strong> 6 2 1 1300 37.9%<br />
4150 17th #1 Corona Heights $2,300,000 16-<strong>May</strong> 8 2 2 1670 9.8%<br />
303 Guerrero Mission Dolores $1,960,000 9-<strong>May</strong> 7 3 3 1622 22.9%<br />
204 Grand View Eureka Valley/Dolores $1,900,000 11-<strong>May</strong> 10 3 2 1392 19.1%<br />
1115 Bosworth Glen Park $1,800,000 10-<strong>May</strong> 19 4 2 1825 -1.6%<br />
52 Saturn Corona Heights $1,750,000 17-<strong>May</strong> 26 3 2 1642 -2.5%<br />
17 Abbey Mission Dolores $1,685,000 13-<strong>May</strong> 19 3 4 1415 -0.2%<br />
189 Belvedere Cole Valley/Parnassus $1,650,000 12-<strong>May</strong> 74 3 1 1700 0.0%<br />
147 Day #3 Noe Valley $1,200,000 16-<strong>May</strong> 11 1 1 1107 20.6%<br />
1523 Guerrero Noe Valley $1,150,000 13-<strong>May</strong> 28 1 1 804 4.6%<br />
2222 15th #B Duboce Triangle $945,000 13-<strong>May</strong> 43 1 1 852 0.0%
DISTRICT 6 SALES<br />
LOWER PAC HTS TO HAYES VALLEY<br />
SINGLE FAMILY<br />
12.5%<br />
$2,875,000<br />
MEDIAN SALES<br />
2.7%<br />
$1,118<br />
PER SQFT<br />
Q1 22 vs Q1 21<br />
1.7%<br />
$1,260,000<br />
CONDO<br />
MEDIAN SALES<br />
11.2%<br />
$1,232<br />
PER SQFT<br />
2105 Pine<br />
$4,750,000<br />
Sold <strong>May</strong> 10<br />
Address Subdistrict Sale Price Date DOM BR BA Sq Feet % Over List<br />
2105 Pine Lower Pacific Heights $4,750,000 10-<strong>May</strong> 35 5 4 3495 4.4%<br />
850 Steiner Alamo Square $4,600,000 9-<strong>May</strong> 178 4 6 4125 -4.1%<br />
1743 Hayes North Panhandle $2,900,000 29-Apr 16 3 3 2703 5.5%<br />
928 Broderick North Panhandle $2,500,000 9-<strong>May</strong> 5 4 3 2513 25.1%<br />
790 Lyon North Panhandle $2,312,000 6-<strong>May</strong> 7 4 2 1849 15.9%<br />
1753 Hayes North Panhandle $1,860,000 6-<strong>May</strong> 15 3 2 1300 16.6%<br />
408 Stanyan North Panhandle $1,775,000 29-Apr 31 3 3 2249 -1.3%<br />
1933 Divisadero #1 Lower Pacific Heights $1,759,999 13-<strong>May</strong> 20 3 2 1739 -1.9%<br />
1884 Mcallister North Panhandle $1,750,000 29-Apr 45 3 2 1731 1.2%<br />
614 Broderick North Panhandle $1,585,000 29-Apr 70 3 1 1498 0.0%<br />
560 Haight #102 Hayes Valley $1,575,000 29-Apr 7 2 2 1195 18.0%<br />
1303 Buchanan Western Addition $1,500,000 3-<strong>May</strong> 12 3 2 1900 9.1%<br />
1663 Turk Western Addition $1,475,000 12-<strong>May</strong> 20 3 2 1559 2.8%<br />
1180 Broderick #302 Anza Vista $1,460,000 18-<strong>May</strong> 16 2 2 1218 6.2%<br />
1546 Baker Lower Pacific Heights $1,410,000 4-<strong>May</strong> 16 2 1 1228 1.1%<br />
619 Haight Hayes Valley $1,310,000 29-Apr 40 3 2 1083 1.2%<br />
2010 Eddy #C Anza Vista $1,225,000 9-<strong>May</strong> 11 2 1 1154 22.7%<br />
707 Central North Panhandle $1,200,000 13-<strong>May</strong> 11 3 1 1186 14.3%<br />
1950 Hayes #3 North Panhandle $1,125,000 6-<strong>May</strong> 0 2 2 950 12.7%<br />
230 Clayton #1 North Panhandle $1,050,000 29-Apr 8 1 1 841 40.2%<br />
1916 Pine #4 Lower Pacific Heights $1,050,000 18-<strong>May</strong> 21 1 2 1190 5.5%<br />
720 Presidio #201 Lower Pacific Heights $895,000 29-Apr 11 2 2 751 1.8%<br />
45 Lottie Bennett #6 Western Addition $580,000 10-<strong>May</strong> 61 2 1 850 0.0%
DISTRICT 7 SALES<br />
MARINA TO PACIFIC HEIGHTS<br />
SINGLE FAMILY<br />
0%<br />
$4,995,000<br />
MEDIAN SALES<br />
12.9%<br />
$1,731<br />
PER SQFT<br />
Q1 22 vs Q1 21<br />
13%<br />
$1,386,944<br />
CONDO<br />
MEDIAN SALES<br />
4.2%<br />
$1,180<br />
PER SQFT<br />
2505 Pacific<br />
$15,000,000<br />
Sold <strong>May</strong> 18<br />
Address Subdistrict Sale Price Date DOM BR BA Sq Feet % Over List<br />
2505 Pacific Pacific Heights $15,000,000 18-<strong>May</strong> 75 6 6 6514 -3.2%<br />
2422 Clay Pacific Heights $5,600,000 18-<strong>May</strong> 32 3 4 3051 14.3%<br />
3532 Webster Marina $4,300,000 16-<strong>May</strong> 11 5 3 2876 4.9%<br />
1960 Vallejo #7 Pacific Heights $3,950,000 11-<strong>May</strong> 26 3 3 2376 -1.1%<br />
2771 Union Cow Hollow $3,375,000 9-<strong>May</strong> 10 3 3 2800 5.6%<br />
37 Capra Marina $3,100,000 17-<strong>May</strong> 9 3 2 1360 34.8%<br />
408 Laurel #2 Presidio Heights $2,880,000 6-<strong>May</strong> 25 3 4 1875 4.7%<br />
2328 Francisco Marina $2,725,000 11-<strong>May</strong> 0 2 2 1743 -0.9%<br />
1670 Green Pacific Heights $2,700,000 19-<strong>May</strong> 45 3 3 1790 -3.6%<br />
2169 Green #1 Pacific Heights $2,500,000 10-<strong>May</strong> 16 2 2 1550 -5.7%<br />
2360 Union #1 Cow Hollow $2,400,000 13-<strong>May</strong> 38 2 2 1736 26.6%<br />
2900 Pierce #5 Cow Hollow $2,400,000 13-<strong>May</strong> 9 2 2 1620 33.4%<br />
2039 Green Pacific Heights $2,300,000 10-<strong>May</strong> 11 4 2 2133 24.3%<br />
1570 Chestnut Marina $2,300,000 16-<strong>May</strong> 1 2 1 1325 15.3%<br />
2030 Green Pacific Heights $2,195,000 4-<strong>May</strong> 34 3 2 1665 0.0%<br />
2100 Green #104 Pacific Heights $1,995,000 13-<strong>May</strong> 155 3 3 2173 0.0%<br />
1859 Vallejo #1 Pacific Heights $1,800,000 9-<strong>May</strong> 13 2 2 1557 20.4%<br />
2900 Pierce #6 Cow Hollow $1,700,000 16-<strong>May</strong> 10 1 2 1131 13.4%<br />
1998 Broadway #507 Pacific Heights $1,510,000 4-<strong>May</strong> 21 2 2 1155 -5.3%<br />
1840 Washington #602 Pacific Heights $1,400,000 6-<strong>May</strong> 243 2 2 1040 0.0%<br />
1970 Sacramento #201 Pacific Heights $1,325,000 9-<strong>May</strong> 40 2 2 1358 6.0%<br />
1734 Bay #201 Marina $1,315,000 11-<strong>May</strong> 7 2 2 1047 10.0%<br />
1945 Washington #606 Pacific Heights $1,225,000 4-<strong>May</strong> 7 2 2 975 2.3%
DISTRICT 8 Sales<br />
NORTH BEACH TO DOWNTOWN<br />
SINGLE FAMILY<br />
4.9%<br />
$2,602,500<br />
MEDIAN SALES<br />
5%<br />
$1,334<br />
PER SQFT<br />
Q1 22 vs Q1 21<br />
$1,22,500<br />
CONDO<br />
4.2% 1.9%<br />
MEDIAN SALES<br />
$1,148<br />
PER SQFT<br />
1039 Vallejo<br />
$4,200,000<br />
Sold <strong>May</strong> 12<br />
Address Subdistrict Sale Price Date DOM BR BA Sq Feet % Over List<br />
1039 Vallejo Russian Hill $4,200,000 12-<strong>May</strong> 3 3 3 2611 0.0%<br />
1137 Green Russian Hill $3,125,000 10-<strong>May</strong> 2 3 3 1868 11.8%<br />
1623 Hyde Nob Hill $2,900,000 16-<strong>May</strong> 6 3 3 1741 16.2%<br />
1536 Pacific #1 Nob Hill $2,425,000 13-<strong>May</strong> 3 3 2 1407 1.3%<br />
733 Front #608 Financial District $2,200,000 12-<strong>May</strong> 7 2 2 1610 0.2%<br />
170 Pacific #37 Financial District $2,160,000 6-<strong>May</strong> 12 3 3 1826 8.1%<br />
101 Lombard #408W North Waterfront $1,750,000 10-<strong>May</strong> 54 3 2 1790 -2.5%<br />
101 Lombard #602W North Waterfront $1,575,000 6-<strong>May</strong> 59 2 2 1532 -1.3%<br />
1591 Jackson #301 Nob Hill $1,556,000 6-<strong>May</strong> 4 2 2 1290 20.2%<br />
1688 Pine #W1001 Van Ness/Civic Center $1,515,000 6-<strong>May</strong> 2 2 2 955 -0.7%<br />
1177 California #1214 Nob Hill $1,350,000 6-<strong>May</strong> 55 2 3 1399 0.0%<br />
225 Bay #302 North Beach $1,300,000 11-<strong>May</strong> 26 2 2 1641 0.4%<br />
1257 Chestnut #1 Russian Hill $1,290,000 10-<strong>May</strong> 17 1 1 1248 7.5%<br />
1464 Broadway Nob Hill $1,250,000 17-<strong>May</strong> 29 2 2 1355 -3.5%<br />
1933 Jones Russian Hill $1,175,000 10-<strong>May</strong> 64 2 1 1255 -9.6%<br />
111 Chestnut #405 North Waterfront $1,080,000 6-<strong>May</strong> 30 2 2 1301 -1.4%<br />
1234 Washington Nob Hill $1,065,000 18-<strong>May</strong> 11 2 1 1071 7.6%<br />
1688 Pine #W1104 Van Ness/Civic Center $1,000,000 12-<strong>May</strong> 1 1 1 727 5.3%<br />
851 Van Ness #107 Van Ness/Civic Center $850,000 19-<strong>May</strong> 86 2 2 1067 0.0%<br />
1868 Van Ness #405 Nob Hill $835,000 9-<strong>May</strong> 8 1 1 600 4.6%<br />
1050 North Point #906 Russian Hill $805,000 19-<strong>May</strong> 11 1 1 554 1.3%<br />
240 Lombard #228 North Waterfront $612,500 10-<strong>May</strong> 33 1 1 582 -2.0%<br />
1 Daniel Burnham #508 Van Ness/Civic Center $549,000 6-<strong>May</strong> 37 0 1 562 0.0%
DISTRICT 9 SALES<br />
SOUTH BEACH TO BERNAL HEIGHTS<br />
SINGLE FAMILY<br />
8.4% 15%<br />
$1,832,500<br />
MEDIAN SALES<br />
$1,224<br />
PER SQFT<br />
Q1 22 vs Q1 21<br />
6.8%<br />
$1,202,000<br />
CONDO<br />
MEDIAN SALES<br />
4.8%<br />
$1,147<br />
PER SQFT<br />
706 Wisconsin<br />
$3,710,000<br />
Sold <strong>May</strong> 12<br />
Address Subdistrict Sale Price Date DOM BR BA Sq Feet % Over List<br />
706 Wisconsin Potrero Hill $3,710,000 12-<strong>May</strong> 21 4 6 3746 6.2%<br />
1817 19th Potrero Hill $3,250,000 19-<strong>May</strong> 3 3 3 2500 20.6%<br />
480 Mission Bay #1105 Mission Bay $2,950,000 13-<strong>May</strong> 7 3 2 1921 0.0%<br />
188 Minna #28F Yerba Buena $2,850,000 12-<strong>May</strong> 94 2 3 1527 -4.8%<br />
744 Potrero Inner Mission $2,495,000 13-<strong>May</strong> 18 4 4 2483 0.0%<br />
567 Kansas Potrero Hill $2,200,000 12-<strong>May</strong> 10 3 2 1450 37.9%<br />
201 Folsom #15A South Beach $1,890,000 17-<strong>May</strong> 45 2 2 1368 -3.1%<br />
2101 Bryant #304 Inner Mission $1,850,000 13-<strong>May</strong> 9 2 3 1301 23.7%<br />
3280 Folsom Bernal Heights $1,805,000 18-<strong>May</strong> 9 3 2 1648 47.3%<br />
506 Gates Bernal Heights $1,802,000 12-<strong>May</strong> 26 2 2 1750 6.3%<br />
656 Vermont Potrero Hill $1,520,000 13-<strong>May</strong> 28 2 2 1249 1.7%<br />
50 Benton Bernal Heights $1,484,000 12-<strong>May</strong> 5 2 1 1430 0.3%<br />
69 Clementina #802 Yerba Buena $1,175,000 18-<strong>May</strong> 27 2 3 1225 2.3%<br />
1403 De Haro Potrero Hill $1,150,000 18-<strong>May</strong> 31 3 2 1331 15.6%<br />
4107 Folsom #A Bernal Heights $1,126,000 16-<strong>May</strong> 7 2 1 929 12.7%<br />
255 Berry #313 Mission Bay $1,095,000 13-<strong>May</strong> 71 2 2 1050 -4.8%<br />
708 Long Bridge #616 Mission Bay $1,010,000 12-<strong>May</strong> 41 1 1 723 -1.3%<br />
1001 17th #103 Potrero Hill $950,000 12-<strong>May</strong> 36 1 1 835 5.7%<br />
175 Bluxome #204 South of Market $950,000 16-<strong>May</strong> 47 2 2 1065 0.2%<br />
250 King #572 Mission Bay $925,000 13-<strong>May</strong> 53 2 2 1144 -2.5%<br />
77 Dow #1104 Yerba Buena $908,000 19-<strong>May</strong> 8 1 2 1065 6.9%<br />
261 Bartlett Inner Mission $907,000 19-<strong>May</strong> 35 2 1 4850 3.7%<br />
655 5th #18 South of Market $810,000 12-<strong>May</strong> 95 1 2 955 1.4%
San<br />
Francisco<br />
Market Snapshot | by District<br />
Price Ratio<br />
by District<br />
{Median Final Sale vs. Original List}<br />
-25% -20% -15% -10% -5% 0%<br />
+5%<br />
+10%<br />
+15%<br />
+20%<br />
+25%
TEST YOUR<br />
SAN FRANCISCO IQ<br />
Where am I?<br />
Last issue’s answer:<br />
The Wave Organ
POWER OF THE BRAND<br />
T R U S T E D T O S E L L Y O U R M O S T V A L U E D A S S E T<br />
SOTHEBY’S<br />
Sotheby’s Auction House has over 200 years of history selling our clients’<br />
treasures. Our association with the brand ensures stellar representation,<br />
brings cachet to your property and allows us access to affluent buyers<br />
around the world.<br />
SOTHEBY’S INTERNATIONAL REALTY<br />
With our distinguished global referral network we can find qualified buyers<br />
or quality agents for your next purchase from around the globe. Our listings<br />
achieve maximum sale price.<br />
950<br />
OFFICES<br />
22,000<br />
SALES<br />
ASSOCIATES<br />
70<br />
COUNTRIES<br />
118M<br />
ANNUAL PAGE<br />
VIEWS SIR.COM<br />
58M<br />
YOUTUBE VIDEO<br />
VIEWS<br />
2.5M<br />
AVERAGE<br />
MONTHLY VISITS<br />
SIR.COM
BAY AREA AND BEYOND<br />
FEATURED LISTING<br />
ST. HELENA, CA<br />
$26,000,000<br />
Refined elegance and tranquility define this unique Napa Valley estate with sweeping Lake<br />
Hennessey, vineyard, valley and mountain views. Situated on 41 acres of stunning hillside,<br />
this architectural gem is a study in unparalleled beauty. A striking harmony of contemporary<br />
design and nature, this property boasts exquisite views, serenity, and privacy, setting the bar<br />
for luxury and sophistication in the Napa Valley.<br />
For more information on this listing and others in wine country, call us at 415-383-5200.
BAY AREA AND BEYOND<br />
FEATURED LISTING<br />
ST. HELENA, CA<br />
$35,000,000<br />
This picturesque Villa of nearly 10,000sf. of living space is perched on its own promontory with<br />
panoramic views of vineyards, lush gardens, and Napa Valley. The custom-built Main<br />
Residence and Guest House boast quality finishes and high ceilings showcasing grand<br />
proportions and scale including 7 bedrooms, 6 baths, wine cellar, tasting room, a grand motor<br />
court, an 80ft pool, outdoor kitchen with pizza oven, meandering gardens, koi ponds, stone<br />
terraces, vegetable gardens, flower gardens covering the sprawling grounds. The guest house<br />
has one bedroom and bath. The property has its own self-sustaining water source - a rarity in<br />
Napa Valley. Don't miss the opportunity to own this breathtaking view property that is<br />
synonymous with the quintessential wine country lifestyle and only minutes away from the<br />
vibrant downtown St. Helena.<br />
For more information on this listing and others in wine country, call us at 415-383-5200.
BAY AREA AND BEYOND<br />
FEATURED LISTING<br />
GREAT NECK, NY<br />
$55,000,000<br />
Situated on 8+ Acres of sprawling waterfront property with unobstructed views of the<br />
bridges and the New York City skyline, Three Bridges is one of the last remaining<br />
generational property on Long Island's Gold Coast. The Compound boasts 3 separate<br />
estate homes, a deep water dock, 100'+ waterfront pool/hot tub, tennis court, multiple<br />
gardens, multiple indoor pools, a lazy river, multiple spas, a movie theater and more.<br />
For more information on this listing and others from our East Coast Sotheby’s partners,<br />
call us at 415-383-5200.
BAY AREA AND BEYOND<br />
FEATURED LISTING<br />
SOUTHAMPTON, NY<br />
$69,950,000<br />
Exquisite grace and grandeur hallmark this magnificent masterpiece - beautifully preserving<br />
its authentic original details - offering 18,000+ square feet on three floors, including 8 principal<br />
bedrooms, 8 full and three half baths, and separate staff quarters. Basking in 10 +/- acres of<br />
park-like privacy on exclusive Ox Pasture Road, Linden sits in the heart of the Estate Section.<br />
The property offers a 60' x 20' outdoor and indoor pool, spa, pool house, grass tennis court,<br />
paddle court, two pavilions with full kitchens, arbors, fountain, carriage house with<br />
connecting greenhouse and an equipment house. Top systems and mechanical, two<br />
detached four-car garages.<br />
For more information on this listing and others from our East Coast Sotheby’s partners,<br />
call us at 415-383-5200.
BAY AREA AND BEYOND<br />
FEATURED LISTING<br />
GENEVA, SWITZERLAND<br />
PRICE UPON REQUEST<br />
This sublime, exceptional property, as we see it today, was built in 1625 on a vast estate of<br />
about 50 hectares (about 500,000 m²) of farmland. Historic property of noble families over the<br />
centuries, then of the Italian royalty, the castle has 8 bedrooms and numerous reception<br />
rooms spread over approximately 1'500 m² of living space. Its formal gardens are lush and<br />
green and provide unparalleled peace and privacy. A 24-metre-long swimming pool,<br />
bordered by a large terrace, completes the art of relaxation.<br />
For more information on this listing and others from our global Sotheby’s partners,<br />
call us at 415-383-5200.
BAY AREA AND BEYOND<br />
FEATURED LISTING<br />
CANNES, FRANCE<br />
$126,943,827<br />
A stunning residence inspired by the architecture of Byzantium and Venice, the Palais Vénitien<br />
overlooks a magnificent panorama of Cannes and the blue waters of the Mediterranean<br />
stretching as far as the eye can see. Its 2,4 hectares encompass a wealth of luxurious amenities,<br />
including a lake, a tennis court, secluded woodlands, and an expansive outdoor pool. The<br />
luxuriant terraced grounds are a worthy setting for the villa’s sumptuous interior. Featuring<br />
monumental columns and exquisite moldings, this home - which boasts over 3000 m2 of living<br />
space - faithfully reflects the elegance and grandeur so characteristic of Venetian design. The<br />
ultimate expression of contemporary refinement, this exquisite structure seamlessly and invisibly<br />
incorporates the very latest high-tech controls.<br />
For more information on this listing and others from our global Sotheby’s partners,<br />
call us at 415-383-5200.
APPLEGARTH
+ WARRIN
PAUL WARRIN<br />
415.407.8019<br />
PAUL@<strong>AW</strong>-<strong>SF</strong>.COM<br />
O V E R $ 1 . 5 B I L L I O N I N S A L E S<br />
74