T Cell Research Brochure - BD Biosciences
T Cell Research Brochure - BD Biosciences
T Cell Research Brochure - BD Biosciences

You also want an ePaper? Increase the reach of your titles
YUMPU automatically turns print PDFs into web optimized ePapers that Google loves.
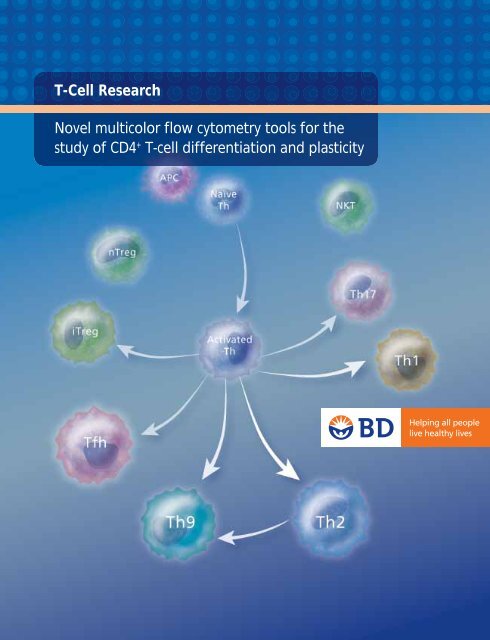
T-<strong>Cell</strong> <strong>Research</strong><br />
Novel multicolor flow cytometry tools for the<br />
study of CD4 + T-cell differentiation and plasticity
A Solid Commitment to <strong>Research</strong>: Flexible Ways<br />
to Study CD4 T-<strong>Cell</strong> Differentiation and Plasticity<br />
T cells have become a dynamic area of research. Among the methods used<br />
to characterize this major lymphocyte subset, multicolor flow cytometry is<br />
preeminent. Additionally, the complexity of the CD3 + T-cell population—both<br />
functionally and phenotypically—makes multiparametric flow cytometry a<br />
necessary and powerful platform.<br />
For more than two decades, researchers have made thousands of advances in<br />
T-cell study using <strong>BD</strong> flow cytometry products. And many of today’s discoveries<br />
involving T cells also involve <strong>BD</strong> <strong>Biosciences</strong> platforms, reagents, instruments,<br />
and protocols.<br />
<strong>BD</strong> continues to build on this commitment with new, quality reagents and kits,<br />
including IL-17F and T-bet monoclonal antibodies, Th17/Treg phenotyping kits,<br />
the Regulatory T <strong>Cell</strong> Sorting Kit, Th1/Th2/Th17 CBA kits, and the<br />
<strong>BD</strong> Phosflow T <strong>Cell</strong> Activation Kit.<br />
T-cell subtypes can be defined by the combinations of cell surface markers<br />
and transcription factors they express and the cytokines they secrete. These<br />
proteins are regulated through signaling pathways. For example, the binding<br />
of IL-6 to its receptor leads to the phosphorylation of Stat3, which can then<br />
lead to the expression of IL-17A.<br />
T-cell plasticity, the ability of a cell to change its phenotype in response to its<br />
environment, is of particular interest—especially for Th17 and regulatory<br />
T cells. This brochure discusses and demonstrates how the following platforms<br />
can be used to study T-cell differentiation:<br />
<strong>Cell</strong> Surface Markers to identify cells from heterogenous samples<br />
Intracellular Cytokine Staining (ICS) to measure cytokines within individual cells<br />
<strong>BD</strong> Phosflow technology to measure the phosphorylation of key proteins<br />
<strong>BD</strong> Cytometric Bead Array (CBA) to measure secreted cytokines within a sample<br />
<strong>BD</strong> <strong>Biosciences</strong> continuously updates our portfolio of products for the analysis<br />
and enrichment of T cells. <strong>BD</strong> <strong>Biosciences</strong> reagents are backed by a world-class<br />
service and support organization to help customers take full advantage of our<br />
products to advance their research. Comprehensive services include technical<br />
application support and customer assay services provided by experienced<br />
scientific and technical experts.<br />
For <strong>Research</strong> Use Only. Not for use in diagnostic or therapeutic procedures.<br />
3
4<br />
T <strong>Cell</strong>s: An Overview<br />
Summary of T-cell Subsets<br />
T cells can be separated into three major groups based on<br />
function: cytotoxic T cells, helper T cells (Th), and regulatory<br />
T cells (Tregs). Differential expression of markers on the cell<br />
surface, as well as their distinct cytokine secretion profiles,<br />
provide valuable clues to the diverse nature and function of<br />
T cells. 1<br />
For example, CD8 + cytotoxic T cells destroy infected<br />
target cells through the release of perforin, granzymes,<br />
and granulysin, whereas CD4 + T helper cells (ie, Th1, Th2,<br />
Th9, Th17, and Tfh cells) have little cytotoxic activity and<br />
secrete cytokines that act on other leucocytes such as B cells,<br />
macrophages, eosinophils, or neutrophils to clear pathogens.<br />
Tregs suppress T-cell function by several mechanisms including<br />
binding to effector T-cell subsets and preventing secretion of<br />
their cytokines.<br />
This table summarizes major known T-cell markers.<br />
Markers can be altered as a result of cellular environment, differentiation<br />
state, and other factors. Key cytokines appear in bold. <strong>BD</strong> <strong>Biosciences</strong> offers<br />
reagents for molecules in red.<br />
A dynamic area of research<br />
To support the use of multicolor flow cytometry for the<br />
study of T cells, <strong>BD</strong> offers a deep portfolio of reagents,<br />
which are highlighted in red in the table below. <strong>BD</strong> now<br />
also offers more choice. Many of these specificities are<br />
available in multiple formats including <strong>BD</strong> Horizon V450<br />
and V500 formats for use with the violet laser.<br />
Tregs: Essential Regulators of Immunity<br />
Tregs play an important role in maintaining immune<br />
homeostasis and have also been implicated in a number<br />
of autoimmune diseases. 4 Flow cytometry is a particularly<br />
useful application for the sorting and analysis of Tregs.<br />
Two major classes of CD4 + Tregs have been identified to<br />
date: “natural” Tregs (nTregs) that constitutively express<br />
CD25 and FoxP3, and adaptive or inducible Tregs (iTregs)<br />
in which CD25 and FoxP3 expression is activated. 5 CD25<br />
expression differs between human and mouse Tregs. In mice<br />
all CD25 + cells are considered Tregs, compared to humans,<br />
for whom only those cells expressing the highest levels of<br />
CD25 are considered to be Tregs. 6<br />
Type of <strong>Cell</strong> Cytotoxic Th1 Th2 Th9 2 Th17 Tfh 3 Treg<br />
Main Function Kill virus-infected cells<br />
Pathogens Targeted<br />
Viruses and some<br />
intracellular bacteria<br />
Activate microbicidal function of<br />
infected macrophages, and help B cells<br />
to produce antibody<br />
Help B cells and switch antibody isotype<br />
production<br />
T cell proliferation and<br />
enhanced IgG and IgE<br />
production by B cells<br />
Enhance neutrophil response<br />
Intracellular pathogens Parasites Parasites Fungi and extracellular bacteria<br />
Harmful Function Transplant rejection Autoimmune disease Allergy, asthma Allergy<br />
Organ-specifi c autoimmune<br />
disease<br />
Regulate development of antigen<br />
specifi c B cell development and<br />
antibody production<br />
Autoimmune disease<br />
Immune regulation<br />
Autoimmune disease,<br />
cancer<br />
Extracellular Markers CD8 CD4 CXCR3 CD4 CCR4, Crth2 (human) CD4 CD4, CCR6 CD4, CXCR5 CD4, CD25<br />
Differentiation Cytokines IFN-γ, IL-2, IL-12, IL-18, IL-27 IL-4, IL-2, IL-33 IL-4, TGF-β TGF-β, IL-6, IL-1, IL-21, IL-23 IL-12, IL-6 TGF-β, IL-12<br />
Effector Cytokines IFN-γ, TNF, LT-α IFN-γ, LT-α, TNF IL-4, IL-5, IL-6, IL-13 IL-9, IL-10<br />
IL-17A, IL-17F, IL-21, IL-22,<br />
IL-26, TNF, CCL20<br />
IL-21 TGF-β, IL-10<br />
Transcription Factors T-bet, Stat1, Stat6 GATA3, Stat5, Stat6 GATA3, Smads, Stat6 RORγt, RORα, Stat3 Bcl-6, MAF FoxP3, Smad3, Stat5<br />
For <strong>Research</strong> Use Only. Not for use in diagnostic or therapeutic procedures.
DIFFERENTIATION<br />
Adaptive or inducible Tregs originate from the thymus<br />
as single-positive CD4 cells. They differentiate into CD25<br />
and FoxP3 expressing Tregs following adequate antigenic<br />
stimulation in the presence of cognate antigen and<br />
specialized immunoregulatory cytokines such as TGF-β, IL-10,<br />
and IL-2. The iTreg population is also reported to be more<br />
plastic, with the ability to convert to other T-cell subtypes<br />
such as Th1 and Th17 cells. 7<br />
FoxP3 is currently the most definitive marker for Tregs,<br />
although there have been reports of small populations of<br />
FoxP3 - Tregs. The discovery of the transcription factor FoxP3<br />
as a marker for Tregs has allowed scientists to better define<br />
these populations, leading to the discovery of additional<br />
Treg markers, including CD127. Several published reports in<br />
addition to data generated at <strong>BD</strong> have demonstrated that<br />
CD127 expression is inversely correlated with FoxP3. 6,8 The<br />
sorting strategy of collecting CD4 + , CD25 + , and CD127 - cells<br />
is useful for obtaining viable, expandable Tregs.<br />
CD127 Alexa Fluor® 647<br />
10 5<br />
10 4<br />
10 3<br />
10 2<br />
0<br />
A<br />
0<br />
10 2<br />
10<br />
CD25 PE<br />
3 10 4<br />
10 5<br />
6.81<br />
Relative <strong>Cell</strong> Number<br />
100<br />
80<br />
60<br />
40<br />
20<br />
0<br />
B<br />
10 0<br />
Enrichment of Tregs<br />
Studies by Miyara 9,10 and Hoffmann 11 have found that<br />
CD45RA is a useful marker to identify and isolate naïve<br />
Treg subpopulations. CD45RA + Tregs may be less plastic,<br />
maintaining FoxP3 status, post-expansion. CD45RA<br />
antibodies are an optimized drop-in in <strong>BD</strong> <strong>Biosciences</strong><br />
new sorting kit.<br />
In the experiment below, the CD45RA + Treg subpopulation<br />
(left histogram, solid blue) showed no tendency to lose<br />
its FoxP3 expression. However, unexpectedly, the CD45RA -<br />
Treg subpopulation (right histogram) did show reduced<br />
expression of FoxP3 in some cells. Further research is needed<br />
to explore these Treg subsets.<br />
Four-color analysis of the expression of CD4, CD25, CD127, and CD45RA on<br />
sorted peripheral blood mononuclear cells (PBMCs).<br />
PBMCs were stained with the <strong>BD</strong> Human Regulatory T <strong>Cell</strong> Sorting Kit (Cat.<br />
No. 560753) and then sorted on a <strong>BD</strong> FACSAria cell sorter. Lymphocytes<br />
were identifi ed by light scatter profi le and CD4 + expression and sorted for<br />
CD4 Treg profi le (panel A). The CD45RA negative and positive fractions (data<br />
not shown) were sorted, then separately expanded. Fractions were stained<br />
with isotype control (Cat. No. 557732) and conjugated anti-human FoxP3<br />
monoclonal antibody (Cat. No. 560045).<br />
A Data representing the CD25 and CD127 expression profi le of the CD4<br />
positive cells prior to gating on CD45RA populations for sorting.<br />
B Data showing hFoxP3 expression on sorted CD25 high CD127 low Tregs (blue<br />
solid histogram) and isotype control (dashed line) for the CD45RA + and<br />
CD45RA - fractions, respectively. Acquisition and analysis were performed on a<br />
<strong>BD</strong> LSR II system.<br />
10 1<br />
10 2<br />
10 3 10 4<br />
Alexa Fluor® 647 hFoxP3<br />
Relative <strong>Cell</strong> Number<br />
100<br />
80<br />
60<br />
40<br />
20<br />
0<br />
10 0<br />
10 1<br />
10 2<br />
10 3 10 4<br />
Alexa Fluor® 647 hFoxP3<br />
For <strong>Research</strong> Use Only. Not for use in diagnostic or therapeutic procedures.<br />
5
Measure phosphorylation status of key<br />
proteins with <strong>BD</strong> Phosflow antibodies<br />
6<br />
Leading tools to support and streamline T-cell research<br />
Tools and Techniques for T-cell Analysis<br />
Use BrdU, Annexin V, and other methods<br />
to examine proliferation and apoptosis<br />
Use optimized buffers and<br />
antibodies to look at transcription<br />
factor expression by flow cytometry<br />
Measure one secreted cytokine<br />
with ELISA or ELISPOT<br />
Use flow cytometry to sort cells or<br />
examine expression of cell<br />
surface markers<br />
Examine cytokines expressed from<br />
a particular cell type with intracellular<br />
flow cytometry<br />
Measure the levels of several<br />
cytokines simultaneously with <strong>BD</strong> CBA<br />
A variety of tools from <strong>BD</strong> allow the detailed study of cell populations.<br />
<strong>BD</strong> products facilitate the detection of cell surface markers, phosphorylated<br />
proteins, transcription factors, apoptosis markers, and cytokines. Secreted<br />
cytokines can be measured with ELISA or ELISPOT for single cytokines or by<br />
<strong>BD</strong> CBA for multiplexed assays to measure several cytokines in the same well.<br />
Using these techniques, researchers can learn the percentage of a certain type<br />
of cell along with its activation status, allowing the effect of minute changes<br />
(in protein phosphorylation status, cytokine levels, etc) to be determined<br />
within populations of cells.<br />
Donor variability caused by factors such as differences in<br />
age or antigen exposure can contribute significantly to<br />
heterogeneity in peripheral lymphoid cell populations,<br />
including those found in peripheral blood.<br />
<strong>BD</strong>’s comprehensive portfolio of reagents includes products<br />
for surface marker analysis for phenotyping cells, and for<br />
intracellular flow cytometry for detecting effector molecules<br />
(such as cytokines and chemokines) and cell signaling molecules<br />
(such as transcription factors and phosphorylated proteins).<br />
<strong>BD</strong> also provides optimized buffers, fluorescent antibody<br />
cocktails, and kits combining surface staining with<br />
intracellular flow cytometry to enable researchers to<br />
maximize the information obtained from analysis of<br />
individual samples.<br />
Tool/Technology Flow Cytometry/Surface Flow Cytometry/Intracellular <strong>BD</strong> Cytometric Bead Array (CBA) ELISPOT ELISA In Vivo Capture Assay<br />
Molecules detected Surface Intracellular and surface Secreted or intracellular Secreted (in situ) Secreted Secreted (in vivo)<br />
Multiparameter Yes Yes Yes No No No<br />
Single cell/cell subset<br />
information<br />
Yes Yes No<br />
Frequencies, no subset<br />
information<br />
No No<br />
Antigen specifi c Yes Yes Yes Yes Yes Yes<br />
Post-assay viability Yes No Yes, for secreted molecules No Yes Yes<br />
Quantitation of protein Possible* Possible* Yes No Yes Yes<br />
Instrumentation Flow cytometer Flow cytometer Flow cytometer ELISPOT reader Spectrophotometer Spectrophotometer<br />
For <strong>Research</strong> Use Only. Not for use in diagnostic or therapeutic procedures.<br />
*With a standard such as <strong>BD</strong> Quantibrite beads
MULTIPARAMETER<br />
Phenotyping of <strong>Cell</strong>s with Unique Surface Marker Profiles<br />
T cells and their subsets can be defined by differential<br />
expression of cell surface markers, including CD3, CD4, CD8,<br />
and CD25. Adding markers such as CCR7, CD62L, or CD69<br />
to an analysis provides important information about the<br />
potential for cells to home and localize within the body, as<br />
well as the activation status of the T-cell subset of interest.<br />
<strong>Cell</strong> surface markers can also be used with cell sorters, such<br />
as the <strong>BD</strong> FACSAria III and <strong>BD</strong> Influx systems. Purified,<br />
viable cell populations can be expanded, differentiated, and<br />
maintained in culture.<br />
Intracellular Flow Cytometry<br />
Intracellular flow cytometry, especially when combined with<br />
cell surface staining, is a powerful tool for the detection of<br />
cytokines and transcription factors from both homogenous<br />
and mixed cell populations. For intracellular protein<br />
detection, cells must be fixed and permeabilized to allow a<br />
fluorescent antibody to enter and detect the target protein of<br />
interest. Different antigens have different sensitivities to and<br />
requirements for fixation and permeabilization, requiring<br />
additional optimization of protocols. To detect cytokines,<br />
which are secreted proteins, protein transport inhibitors such<br />
as <strong>BD</strong> GolgiStop (monensin) or <strong>BD</strong> GolgiPlug (brefeldin A)<br />
inhibitors are used to trap proteins inside the cell.<br />
IL-17A Alexa Fluor® 647<br />
10 2 10 3 10 4 10 5<br />
8.3%<br />
82%<br />
6 Days<br />
2.7%<br />
103 102 104 105 IL-17A and IL-17F staining using a <strong>BD</strong> Cytofi x/Cytoperm protocol.<br />
IL-17A and IL-17F are both members of the IL-17 cytokine family. While both<br />
are believed to be involved in infl ammatory responses, IL-17A and IL-17F<br />
are expressed in separate but overlapping T-cell populations. 12 Human cells<br />
polarized toward a Th17 phenotype were characterized for IL-17A and IL-17F<br />
expression, using the <strong>BD</strong> Cytofi x/Cytoperm protocol. <strong>Cell</strong>s were cultured<br />
in the presence of Th17-polarizing cytokines and with a protein transport<br />
7%<br />
10 2 10 3 10 4 10 5<br />
14.1%<br />
74%<br />
10 Days<br />
1.4%<br />
<strong>BD</strong> <strong>Biosciences</strong> offers two different reagent systems,<br />
<strong>BD</strong> FastImmune and <strong>BD</strong> Cytofix/Cytoperm, that have<br />
been optimized for intracellular cytokine staining.<br />
<strong>BD</strong> FastImmune kits are complete, optimized systems for<br />
the detection of cytokines, cell surface markers, and other<br />
molecules from human whole blood and PBMC samples.<br />
To maximize flexibility and quality of results, <strong>BD</strong> Cytofix/<br />
Cytoperm buffer systems and protocols allow researchers to<br />
design flow cytometry experiments such as the comparison<br />
of IL-17A and IL-17F shown below.<br />
10.5%<br />
103 102 104 105 10 2 10 3 10 4 10 5<br />
15.4%<br />
72.9%<br />
14 Days<br />
1.6%<br />
inhibitor, such as <strong>BD</strong> GolgiStop (monensin) or <strong>BD</strong> GolgiPlug (brefeldin A) to<br />
prevent secretion and thus allow accumulation of the cytokine inside the<br />
cell. <strong>Cell</strong>s were fi xed and permeabilized with <strong>BD</strong> Cytofi x/Cytoperm fi xation/<br />
permeabilization solution to allow fl uorescent antibodies to enter the cell and<br />
bind to their target cytokines. <strong>Cell</strong>s were then stained with antibodies to CD4,<br />
IL-17A, and IL-17F and then detected by multicolor fl ow cytometry.<br />
10%<br />
103 102 104 105 IL-17F PE<br />
For <strong>Research</strong> Use Only. Not for use in diagnostic or therapeutic procedures.<br />
7
8<br />
B<br />
Beads Sample<br />
Wash<br />
D<br />
C<br />
E<br />
F<br />
A<br />
Detector Antibodies<br />
Obtain the complete picture<br />
Techniques for the Detection of<br />
Secreted Cytokines<br />
Detection of cytokines on an intracellular level provides<br />
one useful set of data. To obtain a more complete picture<br />
of T-cell cytokine profiles, it is also helpful to quantitate<br />
cytokines secreted into the medium.<br />
Cytokines from cell populations can be quantified by<br />
techniques such as <strong>BD</strong> Cytometric Bead Array (CBA) and<br />
ELISA. <strong>BD</strong> CBA can simultaneously quantify multiple<br />
cytokines from the same sample, while ELISA is a useful<br />
assay for measuring levels of single cytokines.<br />
CAPABILITY <strong>BD</strong> CBA ELISA ICS<br />
Allows detection of multiple<br />
cytokines in same experiment � �<br />
Can obtain phenotype of<br />
specifi c cells expressing<br />
cytokine of interest<br />
Can measure quantity of<br />
cytokine secreted � �<br />
Comparison of <strong>BD</strong> CBA vs <strong>BD</strong> ICS for the study of<br />
cytokine secretion<br />
<strong>BD</strong> CBA technology: Detection of secreted cytokines.<br />
<strong>BD</strong> CBA products, designed for easy and effi cient multiplexing, require no assay formulation regardless of<br />
plex size. The products deliver quantitative results from a single small-volume sample, and require less time,<br />
compared with competitive bead-based immunoassays.<br />
For <strong>Research</strong> Use Only. Not for use in diagnostic or therapeutic procedures.<br />
�<br />
<strong>BD</strong> CBA is a flow cytometry application that allows users<br />
to quantify multiple proteins simultaneously. The <strong>BD</strong> CBA<br />
system uses the broad dynamic range of fluorescence<br />
detection offered by flow cytometry and antibody-coated<br />
beads to efficiently capture analytes. Each bead in the array<br />
has a unique fluorescence intensity so that beads can be<br />
mixed and run simultaneously in a single tube. This method<br />
significantly reduces sample requirements and time to<br />
results in comparison with traditional ELISA and Western<br />
blot techniques.<br />
Combining <strong>BD</strong> CBA and the <strong>BD</strong> Cytofix/Cytoperm System to<br />
Determine Th1/Th2/Th17 Cytokine Profiles<br />
Both <strong>BD</strong> CBA and intracellular flow cytometry techniques<br />
reveal useful information about a sample. The strength of<br />
intracellular flow cytometry is its ability to determine the<br />
number and phenotype of cells expressing a cytokine from<br />
a heterogenous population. The advantage of <strong>BD</strong> CBA is<br />
the ability to quantitate the levels of multiple cytokines<br />
simultaneously. Since <strong>BD</strong> CBA detects secreted cytokines<br />
in the medium surrounding the cells, the cells can be used<br />
for additional experiments. This makes the two methods<br />
complementary to one another.<br />
NIR<br />
Analyze by<br />
Flow Cytometry<br />
Red<br />
MFI<br />
Concentration<br />
PE MFI<br />
Concentration (pg/mL)<br />
Standard Curve
DETECTION<br />
Combining <strong>BD</strong> CBA and Intracellular Flow Cytometry to<br />
Examine Th17-cell Differentiation<br />
With both <strong>BD</strong> CBA and intracellular cytokine staining (ICS)<br />
available, scientists at <strong>BD</strong> performed an experiment to<br />
examine T-cell differentiation, which can be induced by<br />
activation and treatment with cytokines. To study Th1/<br />
Th2/Th17-cell differentiation, CD4 + -panned human T cells<br />
isolated from normal donors were co-stimulated with CD3/<br />
CD28 and:<br />
IL-2, IL-12, and a neutralizing mAb to IL-4<br />
(Th1 polarization)<br />
IL-2, IL-4, and a neutralizing mAb to IFN-γ<br />
(Th2 polarization)<br />
IL-2, IL-6, IL-1β, TGF-β, IL-23, and neutralizing mAb to<br />
IL-4 and IFN-γ (also tested with and without IL-2, IL-6,<br />
and TGF-β) (Th17 polarization)<br />
Samples from whole cells and supernatant were collected<br />
at the time points indicated, stimulated with PMA/<br />
ionomycin, and analyzed by ICS and <strong>BD</strong> CBA. Data from the<br />
Th17 polarization is shown as an example of ICS, and all<br />
three conditions are shown for <strong>BD</strong> CBA. Combining these<br />
techniques, similar trends were observed when comparing<br />
the increase in number of cells expressing the cytokine to<br />
the total amount of secreted cytokines.<br />
pg/mL<br />
25000<br />
20000<br />
15000<br />
10000<br />
5000<br />
0<br />
IFN-γ<br />
Day 6 Day 10 Day 14<br />
Data comparing cytokine levels as a result of different polarization conditions.<br />
Supernatants from cells were polarized toward a Th1, Th2, or Th17 phenotype and cytokine levels were<br />
measured by <strong>BD</strong> CBA. As anticipated, each polarized condition resulted in the production of the signature<br />
cytokine associated with each Th cell type.<br />
pg/mL<br />
16000<br />
14000<br />
12000<br />
10000<br />
8000<br />
6000<br />
4000<br />
2000<br />
0<br />
2 10 103 104 105<br />
2 10 103 104 105<br />
2 10 103 104 105<br />
IL-4<br />
0.9%<br />
48.2%<br />
6 Days<br />
Representative data from Th17 polarized cell ICS experiments comparing<br />
levels of IL-17A with CD4, IFN-γ, and IL-4.<br />
<strong>Cell</strong>s were treated under the Th17 polarizing conditions described for the<br />
indicated time points. They were treated with <strong>BD</strong> GolgiStop (monensin)<br />
inhibitor, fi xed and permeabilized with <strong>BD</strong> Cytofi x/Cytoperm buffer, and<br />
then stained with antibodies against the indicated cytokines. At 6 days<br />
there were signifi cant numbers of cells expressing IL-17A, with numbers<br />
of cells increasing at day 10 and then leveling off.<br />
Day 6 Day 10 Day 14<br />
8.2%<br />
42.7%<br />
103 102 104 105<br />
7.2%<br />
60.1%<br />
2.0%<br />
30.7%<br />
103 102 104 105<br />
9.1%<br />
90.6%<br />
0.0%<br />
0.3%<br />
103 102 104 105<br />
Time Course Study of Th17 <strong>Cell</strong> Population<br />
2 10 103 104 105<br />
2 10 103 104 105<br />
2 10 103 104 105<br />
1.3%<br />
51.5%<br />
pg/mL<br />
3500<br />
3000<br />
2500<br />
2000<br />
1500<br />
1000<br />
500<br />
0<br />
10 Days<br />
12.1%<br />
35%<br />
103 102 104 105<br />
9.8%<br />
46.9%<br />
3.7%<br />
39.6%<br />
103 102 104 105<br />
13.4%<br />
86.1%<br />
0.0%<br />
0.4%<br />
103 102 104 105<br />
2 10 103 104 105<br />
2 10 103 104 105<br />
2 10 103 104 105<br />
0.8%<br />
57.8%<br />
IL-17<br />
14 Days<br />
10.8%<br />
30.5%<br />
103 102 104 105<br />
9.7%<br />
48.0%<br />
2.0%<br />
40.3%<br />
103 102 104 105<br />
11.6%<br />
87.6%<br />
0.0%<br />
0.7%<br />
103 102 104 105<br />
Day 6 Day 10 Day 14<br />
For <strong>Research</strong> Use Only. Not for use in diagnostic or therapeutic procedures.<br />
IL-17A PE<br />
CD4 PerCP-Cy5.5<br />
IFN-� FITC<br />
IL-4 APC<br />
Th1<br />
Th2<br />
Th17<br />
9
10<br />
The importance of phosphoprotein detection<br />
Tools for Analysis of T-cell Signaling<br />
Cytoplasm<br />
Nucleus<br />
<strong>BD</strong> <strong>Cell</strong> Pathways tool<br />
GP130<br />
SHC<br />
To support signaling research, the <strong>BD</strong> <strong>Biosciences</strong> website includes the <strong>BD</strong> <strong>Cell</strong><br />
Pathways tool, powered by Ingenuity Systems, to help researchers explore the<br />
pathways that involve target molecules of interest. This image (adapted from<br />
Ingenuity) illustrates the mechanisms leading to the commitment of CD4 T<br />
cells to Th17 cell lineage.<br />
Step 1: Fix cells with one of the<br />
<strong>BD</strong> Phosflow fixation buffers.<br />
JAK2<br />
IL17A<br />
IL-6<br />
STAT3<br />
STAT3<br />
STAT3<br />
STAT3<br />
STAT3<br />
IL-6R<br />
SOCS1<br />
For <strong>Research</strong> Use Only. Not for use in diagnostic or therapeutic procedures.<br />
Step 2: Permeabilize cells with one<br />
of the <strong>BD</strong> Phosflow permeabilization<br />
buffers.<br />
T cells are activated and regulated by complex pathways<br />
involving a number of signal transduction molecules,<br />
including receptors for antigens and cytokines, kinases, and<br />
transcription factors. When foreign antigens enter the body,<br />
they are recognized by the innate immune system, which in<br />
turn responds with the expression of surface co-stimulatory<br />
molecules and the release of cytokines.<br />
These expressed molecules inform the adaptive immune<br />
system about the type and strength of the offending<br />
pathogen. As a result, naïve CD4 + T cells differentiate into<br />
Th1, Th2, Th9, Th17, Tfh, or Treg cells.<br />
T-cell differentiation can be mediated by protein<br />
phosphorylation. Different cytokines bind to their cognate<br />
receptors expressed by naïve T cells, which leads to the<br />
phosphorylation and dimerization of activating proteins,<br />
including Signal Transducers and Activator of Transcription<br />
(Stat) proteins. 6,13 Upon phosphorylation and dimerization,<br />
activated Stat proteins enter the nucleus and bind to<br />
the promoters of many different genes, resulting in the<br />
expression of other transcription factors and cytokines<br />
specific to a particular T-cell phenotype.<br />
Step 3: Stain cells with directly conjugated<br />
<strong>BD</strong> Phosflow antibodies in<br />
<strong>BD</strong> Pharmingen stain buffer.<br />
Step 4: Analyze cells on a <strong>BD</strong> FACS<br />
Instrument.
PHOSPHORYLATION<br />
<strong>BD</strong> Phosfl ow Technology: Detecting Transient<br />
Phosphorylation Events<br />
Innovative <strong>BD</strong> Phosfl ow technology is the fi rst complete<br />
fl ow cytometry solution to reveal intracellular data on<br />
basal and induced protein phosphorylation events in both<br />
cell lines and primary cells. The <strong>BD</strong> Phosfl ow approach is<br />
especially informative with T cells, in which phosphorylation<br />
of signaling pathway proteins—such as Stat transcription<br />
factors—leads to the expression of particular T-cell<br />
phenotypes.<br />
<strong>BD</strong> <strong>Biosciences</strong> provides reagents and kits for the study of<br />
protein phosphorylation by fl ow cytometry, including the<br />
<strong>BD</strong> Phosfl ow T <strong>Cell</strong> Activation Kit, as well as <strong>BD</strong> Phosfl ow<br />
antibodies such as anti-Stat3 (pY705).<br />
Activator (response modifi er) Phosphorylation marker<br />
PMA ERK 1/2, p38MAPK<br />
hIFN-α Stat1<br />
hIL-6 Stat3<br />
hIL-2 Stat5<br />
hIL-4 Stat6<br />
Control<br />
Treated<br />
Control<br />
Treated<br />
Specialized Antibodies and Buffers<br />
Developed collaboratively by <strong>BD</strong> and researchers at<br />
Stanford University, <strong>BD</strong> Phosfl ow technology consists of<br />
phosphoprotein-specifi c, fl uorochrome-labeled, monoclonal<br />
antibodies, along with a system of optimized buffers.<br />
These buffers fi x the cellular proteins to maintain their<br />
phosphorylation state, and then permeabilize the cell<br />
membrane to allow the antibodies to be introduced.<br />
Flow cytometry can then capture an intracellular snapshot<br />
of protein phosphorylation events.<br />
Used in combination with cell surface markers, <strong>BD</strong> Phosfl ow<br />
technology can evaluate phosphoprotein activation from<br />
populations within heterogenous samples, such as whole<br />
blood. It is an ideal solution when removal of red blood cells<br />
may unintentionally activate stress-induced signaling (p38/<br />
MAPK) pathways. Even rare cell subtypes can be identifi ed<br />
without upfront enrichment.<br />
T-cell activation profi les monitored with the <strong>BD</strong> Phosfl ow T <strong>Cell</strong> Activation Kit<br />
The <strong>BD</strong> Phosfl ow T <strong>Cell</strong> Activation Kit is a comprehensive research system that<br />
uses fl ow cytometry to reliably determine the level of key phosphorylated<br />
signaling proteins involved in T-cell activation. The ready-to-use kit includes<br />
pre-titrated fl uorochrome-conjugated antibodies, optimized buffers,<br />
experiment setup beads, lyophilized human control cells, validated protocols,<br />
and access to Cytobank software for storing, sharing, and analysis of data.<br />
The kit offers a total solutions approach that minimizes assay-to-assay<br />
variability to help both experienced and novice fl ow cytometry users produce<br />
more dependable, comparable results faster.<br />
The histogram overlays below (using Cytobank software) show CD4 + and CD8 +<br />
T-cell signaling responses to treatment, monitored using the <strong>BD</strong> Phosfl ow T <strong>Cell</strong><br />
Activation Kit. Response modifi ers are described in the chart to the left.<br />
p-ERK<br />
p-ERK<br />
CD4<br />
p-p38 p-Stat1<br />
+ cells, activation profiles<br />
p-Stat3 p-Stat5 p-Stat6<br />
CD8<br />
p-p38 p-Stat1<br />
+ cells, activation profiles<br />
p-Stat3 p-Stat5 p-Stat6<br />
Fold Change<br />
-25.0 -12.5 0.0<br />
12.5 25.0<br />
For <strong>Research</strong> Use Only. Not for use in diagnostic or therapeutic procedures.<br />
11
12<br />
The importance of differentiation<br />
Tools for Measuring Treg/Th17 Plasticity<br />
The differentiation of naïve T cells into unique subsets<br />
was once thought to be irreversible. In the last few years,<br />
published reports have demonstrated plasticity among<br />
different T-cell subtypes, particularly Tregs and Th17 cells.<br />
Because flow cytometry can look inside the cell, it is well<br />
suited to study T-cell plasticity. The data on these two pages<br />
shows how ICS, <strong>BD</strong> CBA, and <strong>BD</strong> Phosflow technology<br />
together can paint a detailed picture of the mechanisms<br />
contributing to Treg/Th17 plasticity.<br />
For <strong>Research</strong> Use Only. Not for use in diagnostic or therapeutic procedures.<br />
Treg and Th17 Differentiation Mechanisms<br />
Both Tregs and Th17 cells require TGF-β for induction. Mice<br />
lacking TGF-β do not have Foxp3 + Tregs or IL-17 cells, resulting<br />
in severe autoimmunity. 14 When antigen activated, naïve T<br />
cells are exposed to TGF-β, and the key transcription factors,<br />
Foxp3 for Tregs and RORγT for Th17, are both expressed.<br />
These cells produce less IL-17 compared to cells that do<br />
not express Foxp3. One proposed mechanism is that Foxp3<br />
antagonizes IL-17 production induced by RORγT. Direct<br />
intermolecular interactions between a motif on exon 2 of<br />
Foxp3 and a conserved domain of both RORα and RORγT have<br />
been demonstrated. 15<br />
The amount of TGF-β present in combination with other<br />
cytokines in the local milieu can influence T-cell fate. High<br />
levels of TGF-β tend to favor Treg differentiation while<br />
lower levels of TGF-β in combination with proinflammatory<br />
cytokines (eg, IL-1, IL-6) favor Th17 differentiation. 16 These<br />
proinflammatory cytokines act through Stat3. Forced<br />
expression of the activated form of Stat3 leads to enhanced<br />
activation of IL-17. Stat5 is important for Treg development.<br />
Experimental Design<br />
To illustrate the utility of <strong>BD</strong> products for the study of<br />
Treg/Th17 plasticity, an experiment was performed using<br />
intracellular flow cytometry, <strong>BD</strong> CBA, and <strong>BD</strong> Phosflow<br />
markers for Th17 and Tregs. CD4 + -enriched mouse splenocytes<br />
were activated with anti-CD3/CD28 and polarized toward a<br />
Th17 phenotype by treating them with cytokines as illustrated<br />
on the next page. While it is possible to detect Tregs and Th17<br />
cells in the same tube, under these experimental conditions<br />
cell polarization toward a Th17 phenotype was observed. <strong>Cell</strong>s<br />
co-expressing both Foxp3 and IL-17A were not observed.<br />
Comparable studies of Treg/Th17 plasticity<br />
A <strong>Cell</strong>s were cultured under the indicated conditions and times, then treated<br />
with <strong>BD</strong> GolgiStop (monensin) inhibitor prior to fi xation and permeabilization<br />
with mouse Foxp3 buffer. <strong>Cell</strong>s were stained with CD4, IL-17A, and Foxp3.<br />
Data is shown starting from day 2.<br />
B Shows data from the measurement of IL-17A by <strong>BD</strong> CBA from cell<br />
supernatants from the indicated culture conditions and time points.<br />
No protein transport inhibitor was added to allow secretion of cytokines.<br />
C Samples were treated as indicated. On day 4 cells were stimulated with<br />
PMA/Ionomycin, and phosphorylated Stat5 was measured with <strong>BD</strong> Phosfl ow<br />
technology using <strong>BD</strong> Phosfl ow permeabilization buffer III. Flow cytometry<br />
was performed on a <strong>BD</strong> LSR II system. Data was analyzed with Cytobank<br />
software, a partner of <strong>BD</strong> (cytobank.org). No protein transport inhibitor was<br />
added to measure the effects of secreted cytokines.
A<br />
IL-17-PE<br />
103 102 104 105 103 102 104 105 103 102 104 105 Day 2<br />
0.9% 0.4%<br />
92.4% 6.3%<br />
103 102 104 105 5.0% 0.3%<br />
88.2% 6.5%<br />
103 102 104 105 6.2% 0.3%<br />
87.8% 5.8%<br />
103 102 104 105 Condition 1: Anti-CD3/CD28 only<br />
Condition 2: Anti-CD3/CD28, IL-1β, IL-6, and TGF-β<br />
Condition 3: Anti-CD3/CD28, IL-1β, IL-6, TGF-β, and IL-23<br />
B<br />
Concentration (pg/mL)<br />
4000<br />
3500<br />
3000<br />
2500<br />
2000<br />
1500<br />
1000<br />
500<br />
0<br />
Day 1 Day 2 Day 3 Day 4<br />
Day<br />
Condition 1 Condition 2 Condition 3<br />
POLARIZATION<br />
103 102 104 105 103 102 104 105 103 102 104 105 Day 3<br />
0.2% 0.1%<br />
94.3% 5.4%<br />
103 102 104 105 3.5% 0.1%<br />
92.9% 3.5%<br />
103 102 104 105 9.8% 0%<br />
87% 3.2%<br />
103 102 104 105 Foxp3 Alexa Fluor® 647<br />
C<br />
No PMA/ionomycin<br />
PMA/ionomycin<br />
103 102 104 105 103 102 104 105 103 102 104 105 Day 4<br />
0.1% 0.3%<br />
93.7% 5.8%<br />
103 102 104 105 3.2% 0.1%<br />
94.5% 2.2%<br />
103 102 104 105 5.4% 0.1%<br />
92.1% 2.4%<br />
103 102 104 105 Stat5 (pY694) Alexa Fluor® 647<br />
Median Fluorescence Intensity<br />
350 2,750<br />
Condition 1<br />
Condition 2<br />
Condition 3<br />
Ms IL-17 Condition 1 Condition 2 Condition 3<br />
For <strong>Research</strong> Use Only. Not for use in diagnostic or therapeutic procedures.<br />
13
14<br />
Service and Support<br />
<strong>BD</strong> <strong>Biosciences</strong> instruments and reagents are backed<br />
by a world-class service and support organization with<br />
unmatched flow cytometry experience. For more than<br />
20 years, <strong>BD</strong> has actively worked with T-cell researchers<br />
to develop tools that help improve workflow, ease of use,<br />
and performance.<br />
References<br />
1. Zhu J, Yamane H, Paul WE. Differentiation of<br />
effector CD4 T cell populations. Annu Rev<br />
Immunol. 2010;28:445-489.<br />
2. Soroosh P, Doherty TA. Th9 and allergic disease.<br />
Immunology. 2009;127:450-458.<br />
3. Fazilleau N, Mark L, McHeyzer-Williams LJ,<br />
McHeyzer-Williams MG. Follicular helper T cells:<br />
lineage and location. Immunity. 2009;30:324-335.<br />
4. Cools N, Ponsaerts P, Van Tendeloo VF, Berneman<br />
ZN. Regulatory T cells and human disease. Clin<br />
Dev Immunol. 2007;891-895.<br />
5. Chatenoud L, Bach JF. Adaptive human regulatory<br />
T cells: myth or reality? J Clin Invest. 2006;116:<br />
2325-2327.<br />
6. Liu W, Putnam AL, Xu-Yu Z, et al. CD127 expression<br />
inversely correlates with FoxP3 and suppressive<br />
function of human CD4+ T reg cells. J Exp Med.<br />
2006;203:1701-1711.<br />
For <strong>Research</strong> Use Only. Not for use in diagnostic or therapeutic procedures.<br />
SERVICES<br />
7. Egwuagu CE. STAT3 in CD4+ T helper cell differentiation<br />
and infl ammatory diseases. Cytokine. 2009;47:<br />
149-156.<br />
8. Seddiki N, Santner-Nanan B, Martinson J, et al.<br />
Expression of interleukin (IL)-2 and IL-7 receptors<br />
discriminates between human regulatory and<br />
activated T cells. J Exp Med. 2006;203:1693-1700.<br />
9. Miyara M, Wing K, Sakaguchi S. Therapeutic<br />
approaches to allergy and autoimmunity based on<br />
FoxP3+ regulatory T cell activation and expansion.<br />
J Allergy Clin Immunol. 2009;123:749-755.<br />
10. Miyara M, Yoshioka Y, Kitoh A, et al. Functional<br />
delineation and differentiation dynamics of<br />
human CD4+ T cells expressing the FoxP3<br />
transcription factor. Immunity. 2009;30:899-911.<br />
11. Hoffmann P, Boeld TJ, Eder R, et al. Loss of FOXP3<br />
expression in natural human CD4 + CD25 + regulatory<br />
T cells upon repetitive in vitro stimulation. Eur J<br />
Immunol. 2009;39:1088-1097.<br />
<strong>Research</strong>ers come to <strong>BD</strong> <strong>Biosciences</strong> not only for quality<br />
products, but as a trusted lab partner. Our repository of<br />
in-depth, up-to-date knowledge and experience is available<br />
to customers through comprehensive training, application<br />
and technical support, and expert field service.<br />
For example, our website, bdbiosciences.com, now<br />
incorporates <strong>BD</strong> <strong>Cell</strong> Pathways, a collection of detailed,<br />
interconnected, interactive maps of biological signaling and<br />
metabolic pathways. <strong>Research</strong>ers can look up specific genes<br />
or molecules in the knowledge database, trace the pathways<br />
that involve them, and find <strong>BD</strong> products related to them.<br />
Technical Applications Support<br />
<strong>BD</strong> <strong>Biosciences</strong> technical applications support specialists<br />
are available to provide field- or phone-based assistance<br />
and advice. Expert in a diverse array of topics, <strong>BD</strong> technical<br />
application specialists are well equipped to address customer<br />
needs in both instrument and applications support.<br />
12. Chang SH, Dong C. IL-17F: regulation, signaling and<br />
function in infl ammation. Cytokine. 2009;46:7-11.<br />
13. Adamson AS, Collins K, Laurence A, O’Shea JJ. The<br />
Current STATus of lymphocyte signaling: new roles<br />
for old players. Curr Opin Immunol. 2009;21:<br />
161-166.<br />
14. Zhou L, Chong MM, Littman DR. Plasticity of CD4 +<br />
T cell lineage differentiation. Immunity. 2009;<br />
30:646-655.<br />
15. Lee YK, Mukasa R, Hatton RD, Weaver CT.<br />
Developmental plasticity of Th17 and Treg cells.<br />
Curr Opin Immunol. 2009;21:274-280.<br />
16. Mitchell P, Afzali B, Lombardi G, Lechler RI. The<br />
T helper 17-regulatory T cell axis in transplant<br />
rejection and tolerance. Curr Opin Organ Transplant.<br />
2009;14:326-331.
Regional Offices bdbiosciences.com/offices<br />
Asia Pacific<br />
Singapore<br />
Tel 65.6861.0633<br />
Fax 65-6860-1590<br />
China<br />
Tel 86.21.3210.4610<br />
Fax 86.21.5292.5191<br />
India<br />
Tel 0091.124.2383566<br />
Fax 0091.124.2383224/25/26<br />
Cy is a trademark of Amersham <strong>Biosciences</strong>.<br />
Alexa Fluor® is a registered trademark of Molecular Probes, Inc.<br />
For <strong>Research</strong> Use Only. Not for use in diagnostic or therapeutic procedures.<br />
© 2010 Becton, Dickinson and Company. All rights reserved. No part of this publication may be reproduced, transmitted, transcribed, stored in retrieval systems, or translated into any language or computer language, in<br />
any form or by any means: electronic, mechanical, magnetic, optical, chemical, manual, or otherwise, without prior written permission from <strong>BD</strong> <strong>Biosciences</strong>.<br />
<strong>BD</strong>, <strong>BD</strong> Logo and all other trademarks are property of Becton, Dickinson and Company. © 2010 <strong>BD</strong><br />
<strong>BD</strong> <strong>Biosciences</strong><br />
2350 Qume Drive<br />
San Jose, CA 95131<br />
bdbiosciences.com<br />
23-11591-00<br />
Australia/New Zealand<br />
Australia<br />
Toll Free: 1800 656 100<br />
Tel 61.2.8875.7000<br />
Fax 61.2.8875.7200<br />
bd_anz@bd.com<br />
New Zealand<br />
Toll Free: 0800 572.468<br />
Tel 64.9.574.2468<br />
Fax 64.9.574.2469<br />
bd_anz@bd.com<br />
Europe<br />
<strong>BD</strong> <strong>Biosciences</strong><br />
Tel 32.2.400.98.95<br />
Fax 32.2.401.70.94<br />
help.biosciences@europe.bd.com<br />
Canada<br />
<strong>BD</strong> <strong>Biosciences</strong><br />
Toll Free 888.259.0187<br />
Tel 905.542.8028<br />
Fax 888.229.9918<br />
canada@bd.com<br />
Japan<br />
Nippon Becton Dickinson<br />
Toll Free 0120.8555.90<br />
Tel 81.24.593.5405<br />
Fax 81.24.593.5761<br />
United States<br />
<strong>BD</strong> <strong>Biosciences</strong><br />
Customer/Technical Service<br />
Toll Free 877.232.8995<br />
Discovery Labware<br />
Fax 978.901.7490<br />
Immunocytometry Systems<br />
Fax 800.325.9637<br />
Pharmingen<br />
Fax 800.325.9637<br />
bdbiosciences.com