THE BRAZILIAN DECADE - Roland Berger
THE BRAZILIAN DECADE - Roland Berger
THE BRAZILIAN DECADE - Roland Berger
Create successful ePaper yourself
Turn your PDF publications into a flip-book with our unique Google optimized e-Paper software.
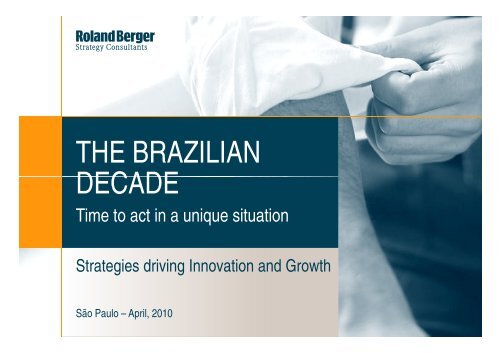
<strong>THE</strong> <strong>BRAZILIAN</strong><br />
<strong>DECADE</strong><br />
Time to act in a unique situation<br />
Strategies driving Innovation and Growth<br />
São Paulo – April, 2010
BRAZIL 2010 – Time to act in a unique situation<br />
Th The global l b l crisis i i –<br />
Where are we after year one<br />
Unique strengths –<br />
A Brazilian decade –<br />
page 3<br />
Why Brazil is doing so much better page 11<br />
Yes, but no time to lay back<br />
Innovation oatois skey ey–<br />
Joint public and private effort required<br />
Corporate p Brazil as innovation driver –<br />
page 17<br />
page 26<br />
Strategies for global growth page 36<br />
2
The global crisis –<br />
Where are we after<br />
year one<br />
3
Situation at start of 2010 – All the key indicators move upwards<br />
COLLAPSE<br />
ECONOMY FINANCE MOOD<br />
Global GDP Dow Jones (index) Ifo global business climate<br />
(index)<br />
-3.1% -54% -64<br />
points<br />
RECOVERY +3.0% +58% +49<br />
points<br />
Source: IMF, Bloomberg, Ifo Institute, <strong>Roland</strong> <strong>Berger</strong> analysis<br />
As at start of 2008 Down 47% compared<br />
to 06/07 average<br />
TODAY COMPARED TO BEFORE <strong>THE</strong> CRISIS<br />
Down 16 pts. compared<br />
to 06/07 average<br />
4
Global GDP has recovered quickly – V-shaped trend<br />
Global GDP, indexed (Q2 2008 = 100) and global GDP<br />
growth quarter-on-quarter<br />
98.6<br />
Q4<br />
+1 +1.0% 0%<br />
2007<br />
Source: IMF<br />
100.0<br />
+0.4% +1.0%<br />
-0.1%<br />
-1.4% 14%<br />
-1.6%<br />
96.9<br />
+0.9%<br />
+1.1%<br />
Q1 Q2 Q3 Q4 Q1 Q2 Q3<br />
2008 2009<br />
99.9<br />
Q4<br />
OUR CRISIS SCENARIOS<br />
> Turning point mid-2009<br />
> Strong recovery<br />
> Our predicted likelihood in<br />
2009 2009: 75%<br />
> Scenario realized<br />
> Turning point 2010<br />
> Almost zero growth until then<br />
> Our predicted likelihood in<br />
2009: 23%<br />
> Scenario not realized<br />
> Depression continues until<br />
2010<br />
> Our predicted likelihood in<br />
2009: 2%<br />
> Scenario not realized<br />
5
Stock markets have made partial recoveries<br />
Key share indexes<br />
(highs, lows and index at start of month)<br />
Dow Jones Dax Shanghai Composite<br />
14,165 8,106 6,092<br />
+58%<br />
10,326<br />
+54%<br />
5,653 ,<br />
6,547 3,666 1,707<br />
+81%<br />
3,088<br />
10/07 02/09 03/10 06/07 03/09 03/10 10/07 11/08 03/10<br />
Source: Bloomberg<br />
Are stock markets a<br />
good indicator?<br />
YES<br />
> They react immediately to<br />
company figures, shifts in<br />
the market, etc.<br />
> They reflect growth<br />
potential and general<br />
economic outlook<br />
NO<br />
> Market speculation p and<br />
irrationality ignore<br />
fundamental data<br />
> Not all companies are<br />
listed on stock markets –<br />
not the full story<br />
6
Other key indicators are also pointing toward recovery<br />
Brent oil price<br />
(U$/barrel 1) )<br />
Global exports<br />
(U$ bn)<br />
140 4,321<br />
115<br />
42<br />
+88%<br />
79<br />
+31% 31%<br />
2,685<br />
3,517<br />
Ifo global business climate<br />
(index)<br />
+96%<br />
08/08 02/09 03/10 Q2 2008 Q1 2009<br />
Q4 2009 Q3 2007 Q1 2009 Q1 2010<br />
1) At start of month<br />
Source: Bloomberg, Ifo Institute<br />
51<br />
100<br />
7
But it ain't over yet …<br />
Economic growth is still below pre-crisis levels<br />
(IMF 2010 forecast is +3 +3.9%, 9% compared to +5 +5.2% 2% in 2007)<br />
Lagging indicators have not yet bottomed out<br />
(unemployment (unemployment, insolvency rate, rate state indebtedness)<br />
Causes of the crisis have not been dealt with<br />
(regulation of financial markets, markets structural problems in some industries, industries etc etc.) )<br />
Risk of flash in the pan effects<br />
(economic ( stimulus programs, p g , trust) )<br />
Boom markets fuelled not just by fundamental data, but also cheap money<br />
from central banks<br />
8
HOW LONG WILL <strong>THE</strong> CRISIS LAST?<br />
Forecasts are difficult and still vary widely<br />
GDP growth [%]<br />
Source: IMF, Consensus Economics<br />
IMF forecasts for development of global GDP 2010 growth forecasts<br />
in 2009<br />
3.0<br />
WORLD<br />
2.2 IMF 3.9<br />
World Bank 2.7<br />
0.5<br />
OECD 19 1.9<br />
-1.3<br />
-1.1<br />
-0.8<br />
Ot Oct 08 N Nov 08 J Jan 09 A Apr 09 Ot Oct 09 J Jan 10<br />
BRAZIL<br />
OECD 4.8<br />
IMF 4.7<br />
World Bank 36 3.6<br />
9
OUR ASSESSMENT – Three countries have the key for global<br />
economic recovery<br />
Global share [%]<br />
Source: CIA World Factbook<br />
Population 1) GDP 2)<br />
Recovery in 2010<br />
possible, if<br />
CHINA 19 11 CHINA > 7% GDP growth th<br />
INDIA 17 5<br />
USA 4 21<br />
TOTAL 40 37<br />
1) World population 2008: 6.7 bn 2) World GDP 2008: USD 70.7 tr<br />
AND<br />
INDIA keeps up<br />
AND<br />
USA show first signs of<br />
recoveryy<br />
10
Unique strengths –<br />
Why Brazil is doing so<br />
much better<br />
11
According to the IMF forecast, Brazil will be the only BRIC country to<br />
grow at a pre-crisis rate in 2010<br />
Average annual GDP growth: 2004-2007, 2009 and forecast for 2010 [%]<br />
4.9<br />
-0.8<br />
World<br />
7.4<br />
4.7<br />
39 3.9<br />
4.7<br />
36 3.6<br />
-0.2<br />
Annual average 2004-2007 2009 2010 (IMF forecast)<br />
Source: IWF<br />
-9.0<br />
9.1<br />
5.6<br />
7.7<br />
11 11.3 3<br />
Brazil Russia India China<br />
8.7<br />
10.0<br />
12
Ibovespa has nearly reached its all-time high again – It has<br />
recovered much better than RTS and Shanghai Composite<br />
Ibovespa [Index] RTS [Index]<br />
Shanghai Composite [Index]<br />
All-time<br />
high<br />
May 2008<br />
38,383<br />
All-time low<br />
October 2008<br />
73,438<br />
29,435<br />
67,228<br />
1,126<br />
All-time All time<br />
high<br />
Jun 2008<br />
All-time low<br />
Jan 2009<br />
2,464<br />
492<br />
1,430<br />
All-time All time<br />
high<br />
Sep 2007<br />
6,124<br />
11,707 707<br />
1,161<br />
Nov 2008<br />
All-time low Jan 2006<br />
Jan 1, 2006 Mar 1, 2010 Jan 1, 2006 Mar 1, 2010 Jan 1, 2006 Mar 1, 2010<br />
Source: Bloomberg<br />
3,088<br />
13
Brazil is already an economic heavyweight<br />
Brazil's global ranking in selected areas<br />
Economy (according to<br />
purchasing power<br />
Agricultural land<br />
parity) it )<br />
Size, population<br />
10<br />
9<br />
Currency stocks<br />
8<br />
7<br />
6<br />
5<br />
4<br />
Exports of sugar,<br />
ethanol, soy and<br />
bbeef f<br />
Ethanol<br />
production<br />
3<br />
2<br />
1<br />
14
Brazil's potential is based on unique strengths and on strong<br />
opportunities<br />
> Young, dynamic population<br />
> SService-oriented i i t d attitude ttit d and d flexibility fl ibilit<br />
> Large, partially unexploited offshore oil fields near the coast<br />
> The world's world s largest land reserves<br />
(200 million hectares of unused agricultural land)<br />
> Largest rainforests on earth<br />
(enormous CO CO2 sink sink, source of biodiversity and natural substances)<br />
> Technology leaders in ethanol-driven engines and in offshore oil extraction<br />
> Globally, growing demand for ethanol and ethanol ethanol-based based technologies<br />
> Major upcoming events: World Cup in 2014 and Olympic Games in 2016<br />
BRAZIL'S OPPORTUNITIES<br />
15
Brazil has a unique combination of four strengths to foster<br />
sustainable economic growth<br />
POLICY CAPITAL MARKETS<br />
> Stable domestic and foreign policies – stabilizing<br />
institutions, balancing competing stakeholders'<br />
interests, acting responsively on international scale<br />
> Overcoming O e co ghistorical sto ca economic eco o c volatilities oat tes<br />
(inflation, exchange rates, etc.) – weathering the<br />
economic crisis well, better than most other<br />
countries<br />
> Verylarge domestic market – public sector,<br />
companies, households<br />
> Growing middleclass, with increasing buying<br />
power<br />
> Enthusiastic consumers – also in "crisis year"<br />
2009<br />
> Conservative banking regulation prevented the<br />
collapse of the financial system (compared to US,<br />
Europe, etc.)<br />
> Net et foreign oeg cedto creditor – recent ece t eelevation e at o to<br />
investment grade status<br />
> Solid, transparent and efficient stock-market<br />
> Brazil investing heavily in its future<br />
– Energy sector 2010-2030: BRL 1.960 bn<br />
– World Cup/Olympics: BRL 97 bn<br />
– Transportation Transportation, ee.g. g TAV High Speed Train:<br />
BRL 35 bn<br />
> Positive secondary effects on supplier industries,<br />
e.g. shipyards: > 40,000 new jobs created<br />
DOMESTIC DEMAND INFRASTRUCTURE PROGRAMS<br />
16
A Brazilian decade –<br />
Yes Yes, but no time<br />
to lay back<br />
17
Brazil's future: The window is open for strong growth<br />
EIKE BATISTA, Business Week,<br />
February 22 22, 2010<br />
"We believe that in five years Brazil will<br />
be the fifth-largest economy in<br />
th the world." ld "<br />
DB RESEARCH, report<br />
"Brazil 2020", January 20, 2010<br />
"In 2020 Brazil will have outrun<br />
France and the UK and will be<br />
the seventh seventh-largest largest economy in 2020 2020.<br />
"<br />
18
However, the look from the outside on Brazil shows the areas of<br />
concern for the country's future<br />
The most problematic factors for doing business [% of responses]<br />
Tax regulations 19.0<br />
Tax rates<br />
Restrictive labor regulations<br />
Inefficient government g bureaucracy y<br />
Access to financing<br />
Inadequate supply of infrastructure 9.5<br />
11.0<br />
10.4<br />
14.0<br />
18.5<br />
–<br />
Corruption 7.0<br />
Inadequately educated workforce 49 4.9<br />
Policy instability 1.1<br />
Inflation<br />
1.0<br />
Poor work ethic in national labor force 0.9<br />
Foreign currency regulations 09 0.9<br />
Crime and theft 0.7<br />
+<br />
Poor public health 0.6<br />
Government instability/coups 0.3<br />
From a list of 15 factors, respondents were asked to select the five most problematic for doing business in their country/economy and to rank them between 1 (most<br />
problematic) and 5. The bars in the figure show the responses weighted according to their rankings<br />
Source: WEF, Global Competitiveness Report 2009-2010<br />
19
The Brazilian economy in early 2010 – some signs of concern<br />
Observations<br />
1. Limited value added on products – in 2009, for the first<br />
time since 1978, export of basic products was higher than<br />
manufactured ones<br />
2. Not enough savings – only 14,6% of GDP in 2009, the<br />
lowest o estlevel e e ssince ce2001 00 (a (and dvs. s 45% 5% for o CChina) a)<br />
3. First time since 2001 current account is negative – Central<br />
Bank estimates deficit of USD 49 bn in 2010<br />
4. Not investing enough in innovation – only 0,82% of GDP<br />
(vs (vs. 33,40% 40% for Japan and 11,42% 42% for China)<br />
Source: World Bank; Brazilian Central Bank; Associação de Comércio Exterior do Brasil<br />
QUESTION<br />
How do these<br />
weaknesses<br />
interrelate and what<br />
is the key for<br />
solution?<br />
20
There is a strong correlation between innovation and the share of<br />
value added products in exports<br />
CORRELATION BETWEEN INNOVATION AND<br />
SHARE OF VALUE ADDED PRODUCTS IN EXPORTS IMPACTS FOR BRAZIL<br />
Share VA<br />
Products 1) [%]<br />
> Brazil's low investment in R&D highly<br />
correlates with its low degree of value<br />
100 added dd d products–huge d t h gap to t leading l di<br />
economies<br />
90<br />
80<br />
70<br />
60<br />
50<br />
0<br />
Brazil<br />
USA<br />
Germany<br />
Japan<br />
Expenditures<br />
on R&D/GDP2) [%] [ ]<br />
0 1 2 3 4<br />
1) Data for 2008 2) Data for 2006, except for Brazil (2005)<br />
Source: World Bank; OECD; UN-TradeCom<br />
> Low share of value added products means<br />
th that t exports t revenues are very sensible ibl to t<br />
market price of commodities<br />
> Conclusion: Brazil has to invest in<br />
inno innovation ation to develop de elop a ssustainable stainable<br />
position as a world-leading economy<br />
21
Brazil is not investing enough in innovation<br />
Expenditures on R&D (public and private) as share of GDP<br />
3.40%<br />
261% 2.61% 2.52%<br />
142% 1.42%<br />
Japan USA Germany China<br />
1.08%<br />
Russia<br />
0.82%<br />
0.69%<br />
Brazil India<br />
(2006) (2006) (2006) (2006) (2006) (200 (2005) ) (200 (2004) )<br />
Source: World Bank<br />
22
As a result, Brazil dropped down 18 positions in global innovation<br />
ranking<br />
Results from the survey Global Innovation Index 2010<br />
According to the Global Innovation Index 2010 Brazil fell from 50th to<br />
68th position in the world rankings for innovation in 2010<br />
Among Latin American countries, the country was only the 7th place<br />
compared to the 3rd highest rank last year<br />
In the group of BRIC countries, Brazil was the one who recorded the<br />
worst result this year<br />
Source: Global Innovation Index 2010 (INSEAD, Confederation of Indian Industry)<br />
23
Brazil has to overcome structural weaknesses to take advantage of<br />
its opportunities – Innovation becomes key<br />
> Only few innovative competence<br />
clusters so far<br />
– Oil exploration in deep waters<br />
– TTropical i l agriculture i lt<br />
– Aircraft manufacturing<br />
> Overall, Brazil's ranking in innovation<br />
is low "WE NEED<br />
MORE EMBRAERS"<br />
EMBRAERS<br />
INNOVATION AS KEY TO BRAZIL'S FUTURE<br />
Source: Press research<br />
J. Stiglitz et al.<br />
Economics Nobel Prize Winner & Team<br />
24
Close the innovation gap – The areas for action are clear<br />
Brazil's world ranking in innovation categories<br />
INNOVATION CATEGORY WORLD RANK 1)<br />
Capacity Capac y for o innovation o a o<br />
Company spending on R&D<br />
University-industry collaboration in R&D<br />
Quality of scientific research institutions<br />
Utility patents<br />
GGovernment t procurement t of f advanced d d ttech h products d t<br />
Availability of scientists and engineers<br />
Competitive disadvantage<br />
1) Of 132 countries<br />
Source: WEF, Global Competitiveness Report 2009-2010<br />
28<br />
29<br />
34<br />
41<br />
59<br />
60<br />
60<br />
25
Innovation is key –<br />
Joint public and private<br />
effort required<br />
26
To stimulate innovation, joint public and private effort is needed<br />
Prerequisites to stimulate innovation<br />
GOVERNMENT<br />
> Allocate the resources needed for innovation<br />
from public and private sources<br />
> Stimulate the creation of technology clusters<br />
and networks, also between universities and<br />
companies<br />
> Foster the creative class/creative cities<br />
<strong>Roland</strong> <strong>Berger</strong> Creative Cities Approach<br />
COMPANIES<br />
> "Key Innovation Drivers" push innovation in the<br />
world's most innovative companies<br />
> The CEO has paramount influence on both<br />
innovation performance and innovation culture<br />
> There are many barriers to innovation that<br />
need to be overcome by CEOs and their<br />
colleagues<br />
Results from "Innovating at the Top" – A joint<br />
study from <strong>Roland</strong> <strong>Berger</strong> and INSEAD<br />
27
GOVERNMENT<br />
Foster the creative class/creative cities – Example: USA<br />
Economic success and creativity<br />
High<br />
Low<br />
Economic success 1)<br />
–<br />
LOSERS<br />
–<br />
– Detroit<br />
Cleveland<br />
– Milwaukee<br />
– New Orleans<br />
Buffalo<br />
1) GDP, growth, per capita income, etc. 2) Technology, talent, tolerance<br />
Source: Richard Florida, <strong>Roland</strong> <strong>Berger</strong><br />
+<br />
+<br />
+ San Francisco<br />
+ Seattle<br />
Boston<br />
WINNERS<br />
Creativity index 2)<br />
Austin CREATIVITY INDEX<br />
High<br />
Technology (innovation)<br />
Talent (human capital)<br />
Tolerance (openness)<br />
28
GOVERNMENT<br />
To enable and stimulate innovation you need the creative class<br />
Definition of the creative class 1) SHARE OF CREATIVE PEOPLE IN <strong>THE</strong> USA<br />
Members of the creative class<br />
develop new, useful things<br />
through their work<br />
> IT & mathematical th ti l professions f i<br />
> Engineers, architects, scientists<br />
> Art, media, entertainment<br />
> Managers<br />
50% Share of working population<br />
45%<br />
40%<br />
35%<br />
30%<br />
25%<br />
20%<br />
15%<br />
SERVICE<br />
class<br />
CREATIVE<br />
class<br />
WORKING<br />
class<br />
10%<br />
FARMING,<br />
5%<br />
FORESTRY<br />
0%<br />
& FISHING<br />
1900 1910 1920 1930 1940 1950 1960 1970 1980 1991 1999<br />
1) The data in this section is based largely on research by Prof. Richard Florida of Carnegie Mellon University, who looks mainly at US cities<br />
Source: Richard Florida, <strong>Roland</strong> <strong>Berger</strong><br />
29
GOVERNMENT<br />
The creativity index of a region or city consists of the three elements<br />
technology, talent and tolerance<br />
The three "Ts" in detail<br />
Technology gy<br />
Talent<br />
Tolerance<br />
Source: Richard Florida, <strong>Roland</strong> <strong>Berger</strong><br />
How much high tech is in the region?<br />
Patents, technical universities, expenditures for<br />
R&D, etc.<br />
How many creative people live in the region?<br />
Scientists Scientists, engineers engineers, architects architects, advertising<br />
people, etc.<br />
How tolerant is a region?<br />
Share of different ways of life, artists, immigrants,<br />
ethnical mixture, openness for new cultures, etc.<br />
30
GOVERNMENT<br />
Our successful "growing city" strategy for Hamburg suggests<br />
pursuing a "combination strategy" of technology and talent<br />
Creativity strategy Hamburg<br />
Innovation<br />
cycle<br />
Short<br />
Long<br />
Source: <strong>Roland</strong> <strong>Berger</strong><br />
Regenerative<br />
energy<br />
IT Media<br />
Nanotechnology<br />
Life sciences<br />
"COMBINED STRATEGY"<br />
Technology/<br />
talent<br />
> Highly innovative and more<br />
traditional clusters exist side<br />
by side<br />
> Fewer "natural" interfaces<br />
between clusters<br />
> Creative sector forms its own<br />
cluster thanks to its economic<br />
importance<br />
Maritime<br />
Need for talent<br />
and d way of f<br />
> Maintain the existing creative<br />
class l and d artistic/cultural ti ti / lt l scene<br />
attracting it > Strong focus on strengthening<br />
Aviation Logistics/ports<br />
the technology base to attract<br />
"innovators"<br />
High R&D invest<br />
Low<br />
Very successful cluster<br />
Successful cluster Being developed<br />
Planning stage<br />
31
GOVERNMENT<br />
Successful cities in Europe driving innovation – Strategic options for<br />
Brazil?<br />
STRATEGY DESCRIPTION<br />
PEOPLE COPENHAGEN<br />
> Established high-tech g cluster<br />
FOLLOW<br />
INNOVATIVE<br />
TECHNOLOGY<br />
DUBLIN<br />
Technology<br />
Talent<br />
Tolerance<br />
> Creative diversity (tolerance)<br />
being developed: used as<br />
image<br />
JOBS FOLLOW<br />
CREATIVE<br />
DIVERSITY<br />
COMBINATION<br />
OF <strong>THE</strong> TWO<br />
BARCELONA<br />
AMSTERDAM<br />
VIENNA<br />
Berlin and Hamburg have no clear strategy targeting the creative class<br />
Source: <strong>Roland</strong> <strong>Berger</strong>, Project Team<br />
Technology<br />
Technology<br />
Talent<br />
Talent<br />
Tolerance<br />
Tolerance<br />
> High-tech cluster being<br />
developed<br />
> Established creative diversity<br />
used as breeding ground<br />
> Hi High-tech h t h should h ld b be expanded dd<br />
> Creative diversity plays different<br />
role for different clusters: catalyst<br />
for creative sector, less important<br />
as an i image ffactor t<br />
32
COMPANIES<br />
What drives innovation on company level – Findings of our joint<br />
study with INSEAD<br />
WHAT WE WANTED TO FIND OUT<br />
> How leading companies drive innovation – and achieve<br />
higher growth and profits<br />
> How CEOs personally push innovation –<br />
and implement innovation policies and practices<br />
> What other companies p can learn from top p innovators –<br />
across regions and across different industries<br />
Source: <strong>Roland</strong> <strong>Berger</strong>, INSEAD<br />
WHAT WE<br />
DISCOVERED<br />
SCO<br />
> Ten "Key Innovation<br />
Drivers" push innova-<br />
tion in the world world's s most<br />
innovative companies<br />
> TheCEO has paramount<br />
influence on both innovation<br />
performance and<br />
innovation culture<br />
> Th There are many bbarriers i<br />
to innovation that need to<br />
be overcome by CEOs and<br />
their colleagues<br />
33
COMPANIES<br />
The global perspective – We talked with the CEOs of the world's<br />
most innovative companies<br />
Source: <strong>Roland</strong> <strong>Berger</strong>, INSEAD<br />
George Buckley,<br />
CEO<br />
Jim Balsillie,<br />
Co-CEO<br />
Olli-Pekka Kallasvuo,<br />
CEO<br />
Patrick Cescau,<br />
Group CEO<br />
Fujio Cho,<br />
Chairman<br />
Art Levinson,<br />
Franz Fehrenbach,<br />
N.R. Narayana<br />
Murthy,<br />
CEO CEO<br />
Chairman<br />
HHenning i Kagermann,<br />
K<br />
CEO<br />
34
COMPANIES<br />
The outcome of our study – Innovation at the top needs strong<br />
leadership, ten key innovation drivers<br />
1. Appoint the CEO as the innovation champion<br />
22. Celebrate an innovation culture<br />
3. Engage more innovation partners by sharing knowledge<br />
4. Organize g diversity yto ppromote ppositive<br />
friction and cross-fertilization<br />
5. Use customer needs to drive simultaneous R&D and business<br />
model innovation<br />
66. Set high standards and demanding challenges<br />
7. Encourage youth and keep a challenger mentality<br />
8. Appoint pp appropriate pp p decision-makers and encourage g transparent p<br />
information sharing<br />
9. Use processes judiciously<br />
10 10. Incentivize to innovate continuously<br />
Source: <strong>Roland</strong> <strong>Berger</strong>, INSEAD<br />
35
Corporate Brazil<br />
as innovation driver –<br />
Strategies for global growth<br />
36
Starting point 2010 – Why strategy and innovation in turbulent<br />
times?<br />
> Most companies have been reacting remarkably quick and decisive on the crisis –<br />
stopping investments investments, reducing capacity, capacity cutting costs<br />
> They are now navigating "at sight and with low speed" – continuously observing<br />
their markets markets, clients, clients competitors<br />
> Now is the time for smart and fundamental strategic moves<br />
– Consolidating the competitive landscape, landscape taking over (undervalued) competitors<br />
– Reshaping the industry, investing in new business models and innovation<br />
> Shaping the future competitive position of Brazil's companies now! … while<br />
(international) competitors are busy about cost cutting<br />
Source: <strong>Roland</strong> <strong>Berger</strong><br />
37
Brazilian companies are increasingly successful in global markets<br />
Selected multinationals from Brazil<br />
PETROBRAS – One of the largest oil companies in the world, a major<br />
exporter of offshore oil extraction technology<br />
VALE – World's largest exporter of f iron ore and second largest mining<br />
company<br />
EMBRAER – World's third largest passenger aircraft manufacturer<br />
GERDAU – Largest g manufacturer of long gsteel<br />
in the Americas with<br />
26 production sites in North and South America<br />
CAMARGO CORRÊA – Dynamic conglomerate, with operations in<br />
engineering i i & construction, t ti cement, t steel, t l concessions, i among others<br />
th<br />
38
Brazilian companies are outperforming their international peers in<br />
key industries<br />
Performance of top players<br />
Brazil vs. Global Leaders (EBITDA Margin 2008)<br />
1 Aerospace<br />
2 Cosmetics<br />
3 Mining<br />
4 Oil & Gas<br />
5 Steel<br />
BR<br />
EU<br />
US<br />
BR<br />
EU<br />
US<br />
BR<br />
EU<br />
BR<br />
EU<br />
US<br />
BR<br />
IN<br />
JP<br />
6 BBreweries i BR<br />
EU<br />
JP<br />
12%<br />
10%<br />
9%<br />
10%<br />
20% 24%<br />
20%<br />
23%<br />
15%<br />
18%<br />
22%<br />
20%<br />
19%<br />
15%<br />
25%<br />
29%<br />
42%<br />
43%<br />
Share price evolution of top players<br />
from selected sectors 2008-today<br />
1 Aerospace<br />
2 Cosmetics<br />
3 Mining<br />
Europe US Brazil<br />
-29%<br />
-23%<br />
-25%<br />
-21%<br />
+7%<br />
4 Oil & Gas -32% 32% -20% 20%<br />
5 Steel<br />
-38% 1)<br />
-48% 2)<br />
-51%<br />
+106%<br />
-2%<br />
-12% 12%<br />
+8%<br />
6 B i<br />
+7% 16% 2)<br />
6 Breweries +7% -16% +34%<br />
2) +34%<br />
Brazilian industries gain g competitive p advantage g on a global g Weak global g markets create take-over opportunities<br />
pp<br />
scale<br />
1) Indian Company 2) Japanese Companies<br />
Sources: Thomson Reuters<br />
39
Brazilian companies can now act out of the position of strength to<br />
become global leaders<br />
1 Keep pyyour focus on creating gp profitable growth g<br />
2<br />
Align your corporate strategy to a changing environment<br />
3 Innovate and invest in new business models<br />
4<br />
5<br />
Consolidate the industry on international scale<br />
Secure access to capital markets<br />
6 Rethink the role of the corporate p headquarter q<br />
7<br />
And become a truly global player<br />
40
1<br />
Keep your focus on creating profitable growth<br />
Profitable Growth : Example Camargo Corrêa<br />
Evolution of net operating revenues [BRL bn]<br />
Growth of top 100 companies and Bovespa Index<br />
5.2<br />
19.9%<br />
2002<br />
6.2<br />
18.5%<br />
2003<br />
EBITDA margin<br />
6.0<br />
19.9%<br />
2004<br />
Source : <strong>Roland</strong> <strong>Berger</strong>, Company Annual Report<br />
CAGR +17%<br />
6.6<br />
18.1%<br />
2005<br />
8.4<br />
19.2%<br />
2006<br />
10.5<br />
18.2%<br />
2007<br />
13.2<br />
18.4%<br />
2008<br />
> Brazilian companies have been managing<br />
profitable growth<br />
– EBTIDA growth 07-08: + 129%<br />
– Bovespa Index CAGR06-08: + 38%<br />
> For o the e yea years s aahead ead these ese co companies pa es aare e<br />
pursuing ambitious growth plans with high<br />
investment budgets<br />
> Effective, , value-based portfolio p manage- g<br />
ment becomes key to success<br />
> The principle for true value creation is<br />
simple: p the return on capital p must be<br />
higher than the cost of capital!<br />
41
2<br />
Align your corporate strategy to a changing environment<br />
Conglomerate Discount<br />
Brazilian conglomerates ROE performance [BRL bn ; 2004 2004-2008] 2008]<br />
Net revenues<br />
CAGR 04-08 [%]<br />
Top 1000<br />
Brazilian<br />
companies2) average net<br />
revenues<br />
CAGR 07-08<br />
55<br />
50<br />
45<br />
40<br />
35<br />
30<br />
25<br />
20<br />
15<br />
10<br />
5<br />
0<br />
Top 1.000 Brazilian companies 2)<br />
average Ebitda 2008<br />
Underperformers<br />
Overperformers<br />
ROE 1) [%]<br />
-25 -20 -15 -10 -5 0 5 10 15 20 25 30 35 40 45<br />
Net revenues in 2008 [BRL bn]<br />
2) Return on Equity (net results/shareholder equity)<br />
2) Average of Top 1 000 companies in 2008 in the industrial sectors (no Banking & Insurance sector) – valor 1000<br />
Source: Annual Report s 2008, press research, Valor 1000, Valor 200 Grandes Grupos, <strong>Roland</strong> <strong>Berger</strong><br />
> Brazilian conglomerates have been<br />
remarkably successful managing diversified<br />
business portfolios<br />
> In a changing domestic and global economy<br />
these portfolios p should be reassessed<br />
– Clearly defining the portfolio logic:<br />
related vs. unrelated diversification,<br />
industry focus, competence clusters<br />
– Id Identifying tif i ffuture t core bbusinesses i t to<br />
invest in, and businesses to be divested<br />
> Making the overall stock market the<br />
bbenchmark h k for f the th portfolio tf li performance f<br />
42
3<br />
Innovate and invest in new business models<br />
Innovation made in Brazil<br />
Example Natura Cosmeticos SS.A. A<br />
INNOVATIVE BUSINESS MODEL<br />
> Innovation is the key challenge for the<br />
> Direct sales model for cosmetics Brazilian economy for the next decade<br />
> Full sustainability appeal<br />
> Although overall ranking on innovation is<br />
INNOVATION MANAGEMENT<br />
> BRL 104 m investment in R&D 2008 (2 (2,9% 9% of revenue)<br />
> Around 180 new products on average per year<br />
low and even decreasing, there are positive<br />
Brazilian a a eexamples a pes to obu build d oon – oil o<br />
exploration in deep waters, tropical<br />
agriculture, aircraft manufacturing<br />
INNOVATION BENEFITS<br />
> Market share from 8% in 2002 to leadership with 13%<br />
in 2008<br />
> 17% sales increase 2008-2009<br />
> 19% EBITDA increase 2008-2009<br />
> Beyond y that also in other key y industries, ,<br />
such as consumer goods, international high<br />
performers evolve – Natura as one Brazilian<br />
example for innovation<br />
Source: <strong>Roland</strong> <strong>Berger</strong>, INSEAD, Clippings, Annual Report<br />
43
4<br />
Consolidate the industry on international scale<br />
Consolidation path: Brazilian companies<br />
Examples<br />
Meat Processing<br />
Breweries<br />
Petrochemicals<br />
Ethanol<br />
Source: <strong>Roland</strong> <strong>Berger</strong>, INSEAD, Clippings, Annual Report<br />
JBS acquires Australian Tatiara Meat Company<br />
(Dec 2009) and Pilgrim's Pride (Dec 2009) and<br />
merges g with Bertin ( (Sep p 2009), ) becoming g#1<br />
meat producer and #1 tanning company<br />
Inbev (through AmBev) acquires Anheuser-<br />
Busch (Nov 2008), becoming the #1 brewer in<br />
the world and #2 beverage company<br />
Braskem acquires Sunoco Chemicals division<br />
(Feb 2010) and Quattor (Jan 2010)<br />
Cosan acquires Exxon Mobile Brazilian distribution<br />
(Esso; Dec 2008) and merges its ethanol<br />
and fuel distribution unit with Royal Dutch Shell<br />
(Feb 2010)<br />
> Synergies of scale and scope are the<br />
driving factors for global M&A activities<br />
– M&As totals USD 1.810 bn globally in<br />
2009, a 27% drop from 2008<br />
– Latin American deals declined only 9.5%<br />
between 2008 and 2009 to USD 115 bn<br />
> The competitive strength of Brazilian<br />
companies now allows them to play a major<br />
role in the consolidation of industries on a<br />
global scale<br />
> And Brazilian companies do not hesitate to<br />
take their chances<br />
44
5<br />
Secure access to capital markets<br />
Recent track record of IPOs<br />
Examples of recent IPOs<br />
OSX Brasil S.A.<br />
Ship construction<br />
firm<br />
BR Properties<br />
Real estate firm<br />
Renova Energia<br />
Renewable energies<br />
firm<br />
International Meal<br />
Company<br />
HHolding ldi of f<br />
restaurants<br />
Source: Clippings, Annual Reports, <strong>Roland</strong> <strong>Berger</strong><br />
> Company raised BRL 2,8 bn, less<br />
than 30% of initially expected<br />
> Stock price down 12,5% on the<br />
first day of trade<br />
> Raised 7% less money that<br />
minimum price expected<br />
> Stock price down 2,7% 2 7% on the<br />
first day of trade<br />
discounts<br />
> IPO suspended due to low<br />
demand<br />
> IPO cancelled due to low demand<br />
even after price lowering<br />
> After an IPO boom in 2007, there were only 10<br />
IPOs in 2008-2009 due to the effects of the<br />
ffinancial<br />
crisis<br />
> In 2010, IPOs are back, but investors are much<br />
more selective and demanding significant<br />
di t<br />
– More critical, especially with greenfield<br />
companies<br />
– A Averse to t risk i k correlation l ti (i (ie. OSX and d<br />
OGX, two strongly linked companies)<br />
– Focusing only on big operations (more than<br />
BRL 500 m)<br />
45
6<br />
Rethink the role of the corporate headquarter<br />
Corporate headquarter: A decisive element to create value<br />
Business portfolio<br />
Relatedness of the business in the portfolio<br />
High LOST<br />
SYNERGIES<br />
Low<br />
KKR<br />
Portfolio<br />
investor<br />
Low<br />
Source: <strong>Roland</strong> <strong>Berger</strong><br />
Hutchison<br />
Swire 3M<br />
Hanson<br />
Strategic<br />
architect<br />
Shell<br />
Emerson ICI<br />
CCanon<br />
Strategic<br />
controller<br />
Unilever<br />
Role of the center<br />
(involvement in operative decisions)<br />
Singapore<br />
Airlines<br />
DESTRUCTION<br />
OF VALUE<br />
Operator<br />
High<br />
> Sustainable growth, internationalization and<br />
new businesses increase the requirements<br />
ffor<br />
Brazilian corporate headquarters<br />
> The ability of the corporate headquarter to<br />
contribute to business development depends<br />
on the h portfolio f li llogic i<br />
– Related diversification: facilitating<br />
synergies<br />
– Unrelated diversification: allocating<br />
(financial) resources<br />
> Not aligning the corporate headquarter to the<br />
business specifics destroys corporate value<br />
46
7<br />
And become a truly global player<br />
Global Leader from Brazil<br />
Company Global Market Position % Internat Rev 1)<br />
Company<br />
Global Market Position % Internat. Rev. 1)<br />
Anheuser-Busch<br />
InBev<br />
#1 Brewery 80%<br />
JBS #1 Food Products 33%<br />
Cosan #1 Sugar Cane & Ethanol 55%<br />
Embraco #1 Compressors N.A.<br />
Marcopolo #1 Bus Body Building 39%<br />
Vale #2 Mining 83%<br />
Embraer #3 Aerospace Commercial<br />
Planes<br />
1) 2008 values<br />
Source : Thomson Reuters, Annual reports<br />
96%<br />
> Different industries with different success<br />
factors require different strategies for growth<br />
> However, there is one common pattern for<br />
successfully becoming a global leader<br />
– First creating g a national champion in<br />
Brazil<br />
– Then, based on a strong national<br />
footprint, pursuing global expansion<br />
> The global leaders cannot and will not stand<br />
still – looking for global opportunities,<br />
reinventing their business models and<br />
aligning their corporate structures<br />
47
CONCLUSION<br />
Brazil – creating the ffuture<br />
with its<br />
entrepreneurial p spirit p and courage g<br />
"By itself, resolution is an<br />
act of courage and, if it<br />
develops into a personal<br />
trait, becomes a habit of<br />
the soul"<br />
Carl Philipp pp Gottfried<br />
von Clausewitz<br />
48
Hauke Moje<br />
PARTNER<br />
Corporate Strategy<br />
Portfolio Management,<br />
Mergers & Acquisitions,<br />
Post Merger Integration<br />
Rodrigo Dantas<br />
PARTNER<br />
Financial Services<br />
Head of Financial Services<br />
and Co-Managing Partner of<br />
Brazilian Office<br />
Avenida Presidente Juscelino Kubitschek, Kubitschek 510 Avenida Presidente Juscelino Kubitschek, Kubitschek 510<br />
04543-906 São Paulo I Brazil<br />
Phone +55 11 3046-7039<br />
Fax +55 11 3046-7222<br />
Mobile +5511 7203-7222<br />
hauke_moje@de.rolandberger.com<br />
04543-906 São Paulo I Brazil<br />
Phone +55 11 3046-7111<br />
Fax +55 11 3046-7222<br />
Mobile +5511 7203-7322<br />
rodrigo_dantas@br.rolandberger.com<br />
49


