European database for cartonboard and carton production, 2023

You also want an ePaper? Increase the reach of your titles
YUMPU automatically turns print PDFs into web optimized ePapers that Google loves.
BIOECONOMY<br />
Unit<br />
<strong>European</strong> <strong>database</strong> <strong>for</strong> <strong><strong>carton</strong>board</strong> <strong>and</strong><br />
<strong>carton</strong> <strong>production</strong>, <strong>2023</strong><br />
Report prepared by RISE Bioeconomy<br />
on behalf of Pro Carton<br />
RISE Bioeconomy Report No: Not applicable<br />
Restricted distribution until approved by Pro Carton<br />
Amended 15th December <strong>2023</strong>
2<br />
Contents<br />
Contents ..................................................................................................... 2<br />
Corrigendum .............................................................................................. 4<br />
Foreword ................................................................................................... 5<br />
Executive summary .................................................................................... 7<br />
Description of the product system .............................................................. 8<br />
Overview ...................................................................................................................... 8<br />
About <strong><strong>carton</strong>board</strong> ....................................................................................................... 8<br />
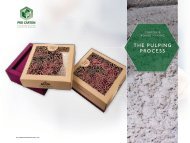
Cartonboard <strong>production</strong> process ................................................................................. 9<br />
Carton <strong>production</strong>....................................................................................................... 12<br />
Methodology questions ............................................................................. 14<br />
Boundaries <strong>and</strong> declared unit – <strong><strong>carton</strong>board</strong> .............................................................. 14<br />
System boundaries <strong>for</strong> <strong>carton</strong> <strong>production</strong> .................................................................. 17<br />
System boundaries <strong>for</strong> the aggregated results ............................................................ 19<br />
Data description ........................................................................................ 21<br />
Questionnaire .............................................................................................................. 21<br />
Data collection <strong>for</strong> <strong><strong>carton</strong>board</strong> ................................................................................... 21<br />
Data collection <strong>for</strong> <strong>carton</strong> <strong>production</strong>......................................................................... 22<br />
Weighted averages ...................................................................................................... 22<br />
Material inputs ............................................................................................................ 23<br />
Material outputs ......................................................................................................... 25<br />
Energy input <strong>and</strong> output ............................................................................................. 26<br />
Water inputs <strong>and</strong> outputs ............................................................................................ 27<br />
Transport .................................................................................................................... 28<br />
Emissions to air .......................................................................................................... 29<br />
Emissions to water ...................................................................................................... 30<br />
Data ......................................................................................................... 32<br />
Coverage <strong>and</strong> comparability of the datasets ............................................................... 32<br />
Relationship to the Product Environmental Footprint (PEF).................................... 32<br />
Results ..................................................................................................... 33<br />
Life cycle inventory <strong>for</strong> <strong><strong>carton</strong>board</strong> <strong>and</strong> <strong>carton</strong>s 2021 ............................................. 33<br />
Additional in<strong>for</strong>mation on energy <strong>and</strong> fuels ............................................................... 42<br />
Internal fuels .............................................................................................................. 42<br />
Year-on-year trends .................................................................................................... 43<br />
Improvements to the questionnaires ......................................................................... 43<br />
Trends in key environmental parameters ................................................................. 44<br />
© RISE Research Institutes of Sweden
3<br />
Sustainable <strong>for</strong>est management ................................................................................. 45<br />
Conclusions .............................................................................................. 45<br />
Peer review .............................................................................................. 47<br />
Definitions ............................................................................................... 48<br />
Annex 1: Peer review statement ................................................................ 49<br />
© RISE Research Institutes of Sweden
4<br />
Corrigendum<br />
This report replaces the previously issued version of the report. Whilst working with one<br />
of the virgin board manufacturers, it became apparent that they had overstated<br />
purchased electricity consumption by a factor of 10. There<strong>for</strong>e the weighted average<br />
electricity consumption <strong>for</strong> virgin <strong><strong>carton</strong>board</strong> <strong>production</strong> is restated in Table 1. In the<br />
original publication the value was stated at 2.255GJ of purchased electricity per tonne of<br />
virgin <strong><strong>carton</strong>board</strong>. The value has been recalculated <strong>and</strong> restated at 2.093GJ per tonne<br />
of <strong><strong>carton</strong>board</strong>. Subsequently, the value <strong>for</strong> purchased electricity <strong>for</strong> Aggregated average<br />
board <strong>production</strong> <strong>and</strong> <strong>carton</strong> conversion has also been restated from 2.595GJ per tonne<br />
of <strong>carton</strong>s to 2.499GJ per tonne of <strong>carton</strong>s<br />
© RISE Research Institutes of Sweden
5<br />
Foreword<br />
Pro Carton, the <strong>European</strong> Association of Cartonboard <strong>and</strong> Carton Manufacturers is<br />
pleased to present the latest edition of the <strong>European</strong> Environmental Database <strong>for</strong><br />
<strong><strong>carton</strong>board</strong> <strong>and</strong> <strong>carton</strong> <strong>production</strong>. The report contains gate-to-gate life cycle inventory<br />
data <strong>for</strong> the <strong>production</strong> of <strong><strong>carton</strong>board</strong> <strong>and</strong> conversion of <strong><strong>carton</strong>board</strong> into <strong>carton</strong>s. The<br />
intention is to make available high quality <strong>and</strong> transparent LCI data <strong>for</strong> use in life cycle<br />
studies.<br />
The data has been collected, processed, checked <strong>and</strong> compiled by LCA experts from RISE<br />
(Research Institutes of Sweden). Over the course of multiple iterations of the project a<br />
robust process has been developed in which the data provided is processed <strong>and</strong> checked<br />
by both industry experts <strong>and</strong> independent LCA. A working group of technical<br />
representatives from the <strong><strong>carton</strong>board</strong> mills <strong>and</strong> convertors worked closely with RISE to<br />
validate the data. The process <strong>and</strong> data are then subjected to an independent peer review<br />
by ifeu – Institute <strong>for</strong> Energy <strong>and</strong> Environmental Research Heidelberg GmbH,<br />
Heidelberg, Germany, a leading research institution with experience of life cycle data <strong>and</strong><br />
methods as applied in the paper <strong>and</strong> board sector.<br />
The life cycle inventories presented in Table 2 of this report contain environmental data<br />
<strong>for</strong> the <strong>production</strong> of:<br />
• Cartonboard manufactured primarily from primary fibres: Folding Box Board<br />
(FBB) <strong>and</strong> Solid Bleached Board/Solid Unbleached Board (SBB/SUB) (based on<br />
data supplied by members of Pro Carton)<br />
• Cartonboard manufactured primarily from recovered fibres: White Lined Chip<br />
(WLC) (based on data supplied by members of Pro Carton)<br />
• Conversion of <strong><strong>carton</strong>board</strong> into blank <strong>carton</strong>s, including die cutting, creasing,<br />
printing <strong>and</strong> where applicable folding/gluing (based on data supplied by members<br />
of the <strong>European</strong> Carton Manufacturers Association (ECMA))<br />
• An aggregated dataset, which considers the <strong>production</strong> of average <strong>European</strong><br />
<strong><strong>carton</strong>board</strong> <strong>and</strong> the conversion of this average <strong><strong>carton</strong>board</strong> into <strong>carton</strong>s.<br />
The data in this edition of the report represents the weighted averages of the inputs <strong>and</strong><br />
outputs from the <strong>production</strong> sites per tonne of <strong><strong>carton</strong>board</strong> paper <strong>and</strong> per tonne of<br />
<strong>carton</strong>s <strong>for</strong> the year 2021. The <strong>database</strong> h<strong>and</strong>les the <strong>production</strong> sites as a black box.<br />
Details of the different processes in the <strong>production</strong> sites are not provided. Emissions etc.<br />
originating from <strong>production</strong> of resources consumed, energy <strong>production</strong> outside the mill<br />
or converting plant, transport <strong>and</strong> waste treatment are not included in the datasets, but<br />
the impacts of these additional unit processes can be added by the user to facilitate full<br />
cradle-to-gate, cradle-to-grave, or cradle-to-cradle life cycle studies.<br />
The data collected <strong>for</strong> this study covers a significant proportion of the sector:<br />
• For FBB, the collected data represents approximately 93% of the total <strong>European</strong><br />
<strong>production</strong> in 2021<br />
• For SBB/SUB, the collected data represents approximately 62% of the total <strong>European</strong><br />
<strong>production</strong> in 2021<br />
© RISE Research Institutes of Sweden
6<br />
• For WLC, the collected data represents approximately 53% of the total <strong>European</strong><br />
<strong>production</strong> in 2021<br />
• For <strong>carton</strong> converting, the collected data represents approximately 8% of the total<br />
<strong>European</strong> <strong>production</strong> in 2021.<br />
The high levels of data provision <strong>for</strong> <strong><strong>carton</strong>board</strong> <strong>production</strong> mean that the datasets<br />
presented are highly representative of the practices <strong>and</strong> subsequent overall<br />
environmental per<strong>for</strong>mance of the sector.<br />
The report is available <strong>for</strong> interested parties on the condition that the data<br />
in this report may only be used <strong>for</strong> environmental studies such as Life Cycle<br />
Inventory Analysis, Life Cycle Impact Assessment as separate steps or as a<br />
whole Life Cycle Assessment.<br />
The <strong>database</strong> may only be used <strong>for</strong> environmental studies regarding product<br />
development <strong>and</strong> improvement <strong>and</strong> the comparison of the entire system of <strong>carton</strong><br />
packaging with that of other materials. The <strong>database</strong> should be used <strong>for</strong> making<br />
generalised statements on the relative per<strong>for</strong>mance of all primary fibre <strong>and</strong><br />
all recovered fibre-based materials.<br />
When LCA data is used to make comparative studies, a specific scenario is chosen <strong>and</strong><br />
the result can <strong>and</strong> will vary depending on various parameters. It should be clearly<br />
understood that, whatever the outcome of a comparative study, the conclusion should<br />
not <strong>and</strong> cannot be generalized. If specific in<strong>for</strong>mation on a particular <strong><strong>carton</strong>board</strong> grade<br />
is required, then this should be requested directly from the manufacturers.<br />
Pro Carton is committed to ongoing <strong>and</strong> regular updates of the <strong>database</strong>. The user of the<br />
<strong>database</strong> should there<strong>for</strong>e check whether it is the latest edition of the <strong>database</strong> report<br />
prior to using the in<strong>for</strong>mation enclosed. The latest version will always be available<br />
through direct contact with Pro Carton.<br />
We would like to thank all participants from the industry <strong>for</strong> providing the necessary<br />
input from their plants. Collecting, processing <strong>and</strong> checking the data is a significant<br />
undertaking. The high level of ongoing participation of the membership base of both Pro<br />
Carton <strong>and</strong> ECMA is highly appreciated.<br />
We are also grateful <strong>for</strong> the positive response <strong>and</strong> valuable feedback <strong>and</strong> comments we<br />
have received from users of the previous editions of the <strong>database</strong> <strong>and</strong> reports. We<br />
welcome comments on this report <strong>and</strong> feedback on the experiences of users<br />
of the <strong>database</strong>. Such feedback can only help to further improve the quality<br />
<strong>and</strong> value of future updates!<br />
February <strong>2023</strong><br />
Horst Bittermann/Winfried Muehling<br />
Pro Carton<br />
© RISE Research Institutes of Sweden
7<br />
Executive summary<br />
This report is the outcome of a major study initiated by Pro Carton (the <strong>European</strong><br />
Association of Cartonboard <strong>and</strong> Carton Manufacturers), with the objective of compiling<br />
<strong>and</strong> publishing life cycle inventories <strong>for</strong> <strong><strong>carton</strong>board</strong> <strong>production</strong> <strong>and</strong> conversion of<br />
<strong><strong>carton</strong>board</strong> into <strong>carton</strong>s. The life cycle inventories presented in this report contain<br />
environmental data <strong>for</strong> the <strong>production</strong> of:<br />
• Cartonboard manufactured primarily from primary fibres: Folding Box Board (FBB) <strong>and</strong><br />
Solid Bleached Board/Solid Unbleached Board (SBB/SUB)<br />
• Cartonboard manufactured primarily from recovered fibres: White Lined Chip (WLC)<br />
• Conversion of <strong><strong>carton</strong>board</strong> into blank <strong>carton</strong>s, including die cutting, creasing, printing<br />
<strong>and</strong> where applicable folding/gluing<br />
• An aggregated dataset, which considers the <strong>production</strong> of average <strong>European</strong> <strong><strong>carton</strong>board</strong><br />
<strong>and</strong> the conversion of this average <strong><strong>carton</strong>board</strong> into <strong>carton</strong>s.<br />
The datasets represent the weighted average situation <strong>for</strong> each of the processes according<br />
to the market <strong>and</strong> technology situation in Europe in 2021. The datasets are based on<br />
primary data collected directly from the mills <strong>and</strong> convertors operating the processes.<br />
Participation in the surveys <strong>for</strong> <strong><strong>carton</strong>board</strong> <strong>production</strong> was high, with a significant<br />
increase in the number of sites participating <strong>and</strong> the proportion of <strong>European</strong> <strong>production</strong><br />
covered. Participation in the survey <strong>for</strong> <strong>carton</strong> converting was also significant, with data<br />
received from twenty-five converting sites. Although this was fewer sites compared to the<br />
previous survey in 2018, the share of <strong>European</strong> <strong>production</strong> covered by the participating<br />
convertors represented an increase in coverage with a good geographical spread in<br />
participation. For this reason, there can be a high degree of confidence that the data is<br />
representative of technologies applied across Europe, <strong>and</strong> there<strong>for</strong>e representative of the<br />
environmental profile of the sector.<br />
The gate-to-gate life cycle inventories can be used, in conjunction with appropriate<br />
secondary data, to compile cradle-to-gate <strong>and</strong> cradle-to-gave life cycle assessment<br />
studies of <strong><strong>carton</strong>board</strong> <strong>and</strong> <strong>carton</strong>s. As such, the inventories will be made available to<br />
providers of life cycle <strong>database</strong>s, with a view to ensuring that the data available to life<br />
cycle practitioners is current <strong>and</strong> accurate.<br />
The results demonstrate some interesting features of <strong><strong>carton</strong>board</strong> <strong>production</strong>, including<br />
the fact that a high proportion of the energy requirement <strong>for</strong> virgin <strong><strong>carton</strong>board</strong> is met<br />
through the utilisation of internal, biogenic fuels. Furthermore, the study demonstrates<br />
that the majority of the water required <strong>for</strong> manufacturing <strong>carton</strong> board is simply<br />
“borrowed” rather than consumed, <strong>and</strong> is returned to the environment after purification.<br />
The inventories also demonstrate that the majority of residues arising at the paper mills<br />
are reused or recycled.<br />
These are positive features of <strong><strong>carton</strong>board</strong> <strong>production</strong>, but this does not mean that there<br />
are not improvements to be made in environmental per<strong>for</strong>mance. Pro Carton <strong>and</strong> its<br />
members are committed to updating this study regularly, so trends in environmental<br />
per<strong>for</strong>mance can be tracked <strong>and</strong> improvements can be quantified.<br />
© RISE Research Institutes of Sweden
8<br />
Description of the product system<br />
Overview<br />
Folding <strong>carton</strong>s are small to medium sized “cardboard boxes” made from <strong><strong>carton</strong>board</strong>.<br />
They are used to package a wide range of products from foodstuffs – such as cereals,<br />
frozen <strong>and</strong> chilled food, confectionery, bakery goods, tea, coffee <strong>and</strong> other dry foods – to<br />
pharmaceuticals, medical <strong>and</strong> healthcare products, perfumes, cosmetics, toiletries,<br />
photographic products, clothing, cigarettes, toys, games, household <strong>and</strong> electrical,<br />
engineering, gardening <strong>and</strong> DIY (do it yourself) products.<br />
Many different types of <strong><strong>carton</strong>board</strong> are manufactured, all of which can be made in a<br />
variety of different weights (grammages) <strong>and</strong> thicknesses. The type of <strong><strong>carton</strong>board</strong> <strong>and</strong><br />
the fibre composition depends on the intended use <strong>and</strong> the specific requirements.<br />
Usually, <strong><strong>carton</strong>board</strong> is made up of several plies (layers) to make the best possible use of<br />
the different types of raw materials <strong>and</strong> optimise the product per<strong>for</strong>mance.<br />
Cartonboard is made from cellulose containing fibres that are produced either from wood<br />
(primary fibres) or from recovered paper <strong>and</strong> board (secondary fibres). A combination<br />
of the two can be used <strong>and</strong> there are various types of fibre that produce different<br />
characteristics. For example, shorter fibres generally give a better bulk <strong>and</strong> longer fibres<br />
give a greater stiffness <strong>and</strong> so types of fibre are mixed to produce the desired<br />
characteristics.<br />
The fibres can also be treated with various chemicals to improve a variety of properties<br />
such as moisture <strong>and</strong> grease barriers. Additionally, they can be coated with a range of<br />
barriers to produce <strong><strong>carton</strong>board</strong> that can be used in ovens <strong>and</strong> microwaves <strong>and</strong> other<br />
specialist packaging.<br />
About <strong><strong>carton</strong>board</strong><br />
There are three main grades of <strong><strong>carton</strong>board</strong>:<br />
• Folding Boxboard FBB (also known as GC /UC) – This grade is typically made of<br />
mechanical pulp s<strong>and</strong>wiched between two layers of chemical pulp with up to three layers<br />
of coating on the top or printing surface <strong>and</strong> one layer of coating or sizing on the reverse.<br />
Typical uses include pharmaceuticals, confectionery <strong>and</strong> all kinds of foods.<br />
• Solid Bleached Board SBB, (also known as SBS / GZ) – This grade is typically<br />
made from pure bleached chemical pulp with two or three layers of coating on the top<br />
surface <strong>and</strong> one or more layers on the reverse. There are also uncoated grades. Typical<br />
markets include cosmetics, pharmaceuticals, graphics, tobacco <strong>and</strong> luxury packaging.<br />
• Solid Unbleached Board SUB (also known as SUB / SUS) – This grade is<br />
typically made from pure unbleached chemical pulp with two or three layers of coating<br />
on the top surface. In some cases, a white reverse surface is applied. It is primarily used<br />
as beverage carriers <strong>for</strong> bottles <strong>and</strong> cans, as it is very strong <strong>and</strong> can be made resistant to<br />
water. It is used where strength of packaging is important. SUB may also be used in the<br />
<strong>production</strong> of liquid beverage <strong>carton</strong>s <strong>and</strong> liquid food <strong>carton</strong>s, but this application is<br />
excluded from the scope of the data collected in this report.<br />
© RISE Research Institutes of Sweden
9<br />
• White Lined Chipboard WLC (also known as GT /GD /UD) – This grade is<br />
typically made using predominantly recovered fibres. It is manufactured in a number of<br />
layers, each of which use selected grades of raw materials. It has up to three layers of<br />
coating on the top or printing surface <strong>and</strong> one layer on the reverse. It is used in a range<br />
of applications such as frozen <strong>and</strong> chilled foods, cereals, shoes, tissues, toys.<br />
Cartonboard comprises a significant share of paper <strong>and</strong> board <strong>production</strong> in Europe,<br />
representing approximately 11% of total paper <strong>and</strong> board <strong>production</strong> in 2021. <strong>European</strong><br />
<strong>production</strong> of <strong><strong>carton</strong>board</strong> in 2021 stood at 9.857 million tonnes 1 . The make-up of the<br />
total <strong>production</strong> in Europe in 2021 was follows FBB 39%; SBB/SBS (excluding<br />
<strong>production</strong> of board <strong>for</strong> liquid beverage <strong>carton</strong>s/liquid food <strong>carton</strong>s) 12%; WLC 49%.<br />
Cartonboard <strong>production</strong> process<br />
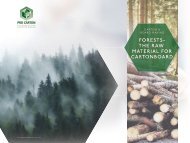
Raw materials<br />
Cartonboard can be manufactured from primary wood fibres from sustainably managed<br />
<strong>for</strong>ests <strong>and</strong>/or from recovered fibres from paper <strong>for</strong> recycling. As a general rule, FBB <strong>and</strong><br />
SBB/SUB are manufactured from predominantly primary fibres whereas WLC is<br />
predominantly manufactured from recovered fibres.<br />
SBB/SUB is generally manufactured at an integrated pulp <strong>and</strong> papermill (meaning that<br />
the pulp <strong>and</strong> the paper are produced at one single site, <strong>and</strong> the wet pulp is pumped<br />
directly to the paper machine with no additional drying or transport required). For FBB<br />
<strong>and</strong> WLC, most <strong>production</strong> is semi-integrated (meaning that a quantity of purchased<br />
market pulp is used to compliment the pulp produced onsite).<br />
For mills utilising primary wood fibre, most of the wood is delivered in the <strong>for</strong>m of<br />
pulpwood logs from thinning. A proportion is also brought in as wood chips, a by-product<br />
of nearby sawmills. The pulpwood logs have to be debarked <strong>and</strong> chipped be<strong>for</strong>e pulping.<br />
In mechanical pulping, the fibres are separated by applying mechanical <strong>for</strong>ce to either<br />
debarked logs (roundwood) or smaller chips (refiner mechanical). The heat generated<br />
softens the lignin <strong>and</strong> results in fibre separation. The pulp is then screened <strong>and</strong> cleaned<br />
<strong>and</strong> any remaining fibre clumps are reprocessed.<br />
In chemical pulping, debarked logs are chipped <strong>and</strong> treated with chemicals under heat<br />
<strong>and</strong> pressure. This dissolves the lignin <strong>and</strong> hemicelluloses of the wood <strong>and</strong> cellulose<br />
fibres can be separated from the cooking liquor. There is a choice of chemicals <strong>for</strong><br />
processing. The spent cooking liquor is drained off <strong>and</strong> washed out from the pulp. It<br />
contains the wood substance dissolved during the cooking together with the spent<br />
cooking chemicals. The spent liquor is concentrated <strong>and</strong> burnt as a fuel <strong>for</strong> energy<br />
<strong>production</strong> <strong>and</strong> recovery of cooking chemicals.<br />
When the raw material source is recovered paper <strong>and</strong> board, fibre separation is achieved<br />
by mechanical agitation in water. Recovered paper <strong>and</strong> <strong><strong>carton</strong>board</strong> has been printed,<br />
sometimes varnished <strong>and</strong> <strong>for</strong> packaging applications, often has been glued. In products<br />
1 CEPI Key Statistics 2021<br />
© RISE Research Institutes of Sweden
10<br />
where high purity <strong>and</strong> whiteness is important, it is necessary to remove the printing inks,<br />
glues <strong>and</strong> other impurities.<br />
After the recovered paper <strong>and</strong> board has been immersed in water, disintegrated <strong>and</strong> the<br />
fibres dispersed, heat <strong>and</strong>/or dispersion agents are used to remove any sticky impurities<br />
from the fibre surfaces. Then flotation techniques, screening <strong>and</strong> washing, <strong>and</strong><br />
sometimes additional bleaching, are used to remove the impurities.<br />
For pulps from both primary fibres <strong>and</strong> recycled fibres, functional chemicals, fillers <strong>and</strong><br />
other pulps can be added to give the final paper the properties required.<br />
Energy<br />
Energy sources depend on the way pulp is made <strong>and</strong> the location of the mill. Where paper<br />
<strong>for</strong> recycling is utilised as a fibre source, rejects from the recovered paper (plastics, etc)<br />
may be incinerated with energy recovery on-site. Where pulp is produced from virgin<br />
fibres, bark chips from debarking may be used as an internal energy source. Chemical<br />
pulping also results in a by-product (black liquor) which is used as a significant internal<br />
energy source. Finally, biogas from wastewater treatment may also be used as an internal<br />
fuel source. For virgin <strong><strong>carton</strong>board</strong> mills, internal fuels account <strong>for</strong> more than 50% of the<br />
fuels consumed onsite, whereas <strong>for</strong> recycled <strong><strong>carton</strong>board</strong> mills internal fuels account <strong>for</strong><br />
less than 1% of the fuels consumed onsite. Where internal fuel sources are not available<br />
or are not sufficient to meet the full energy needs of the mill, external fuels will also be<br />
consumed, including fossil fuels (mostly natural gas, but also heavy fuel oil, light fuel oil,<br />
diesel oil, liquid petroleum gas, <strong>and</strong> in some cases coal or peat) <strong>and</strong> renewable fuels (e.g.,<br />
bark, pitch oil).<br />
Fuels consumed onsite can be used to produce both thermal energy <strong>and</strong> electricity. Some<br />
mills are able to generate enough electricity to meet all of their needs, <strong>and</strong> may even be<br />
net exporters of electricity, but most mills also purchased some of the electricity needs.<br />
In this case, electricity may be purchased from the national grid, or specific electricity<br />
product agreements (e.g., <strong>for</strong> electricity produced from renewables <strong>and</strong>/or zero carbon<br />
electricity) may be in place.<br />
Water<br />
Water is an essential element <strong>for</strong> paper <strong>and</strong> board <strong>production</strong>. Water acts as a bond<br />
between the fibres <strong>and</strong> in the <strong>production</strong> process it is needed <strong>for</strong> transporting, cleaning,<br />
as a solvent, carrying energy in the <strong>for</strong>m of steam <strong>and</strong> it is used in cooling process units.<br />
Water is usually taken from a nearby surface source such as a lake or river. >95% of the<br />
water used in the industry is cleaned <strong>and</strong> reused on site. All water is purified (usually at<br />
a wastewater treatment facility operated by the mill) in accordance with <strong>European</strong><br />
regulations <strong>and</strong> st<strong>and</strong>ards be<strong>for</strong>e being returned to the environment.<br />
Pulping <strong>and</strong> the paper machine<br />
The fibre is mixed with water in large hydropulpers until a very fine suspension is<br />
achieved. This is then cleaned to remove any contraries, refined to enhance strength <strong>and</strong><br />
then pumped to the <strong><strong>carton</strong>board</strong> machine where the <strong><strong>carton</strong>board</strong> is manufactured. In the<br />
fibre preparation, be<strong>for</strong>e the board making, functional additives are used. The additives<br />
© RISE Research Institutes of Sweden
11<br />
provide some degree of water resistance (hydrophobicity) <strong>and</strong> add internal <strong>and</strong> surface<br />
strength to the product.<br />
The dispersed fibres with the functional additives <strong>and</strong> water mixture from the<br />
preparation plant, is pumped to the <strong><strong>carton</strong>board</strong> machine <strong>and</strong> this very thin mixture (<<br />
1% fibres in water) is put onto several continuously moving wire meshes.<br />
As the water drains away through the wire mesh the fibres begin to 'set' <strong>and</strong> then each of<br />
the sheets are brought together to <strong>for</strong>m a continuous sheet of <strong><strong>carton</strong>board</strong>.<br />
This is then pressed between textile felts by large rollers to squeeze more water out <strong>and</strong><br />
then passed over steam heated cylinders to evaporate the remaining water.<br />
When the <strong><strong>carton</strong>board</strong> has reached the required moisture content, up to three layers of<br />
coating (typically made of clay/kaolin or starch) are added to the surface of the board.<br />
These coatings improve smoothness <strong>and</strong> gloss <strong>and</strong> are required to achieve the highquality<br />
printing that is needed on <strong>carton</strong>s.<br />
Modern <strong><strong>carton</strong>board</strong> machines are large. Typically, they are about 100 metres in length,<br />
about 6 metres wide <strong>and</strong> 25 metres high. They run 24 hours a day, 7 days a week <strong>and</strong> are<br />
only stopped occasionally <strong>for</strong> essential maintenance.<br />
Changes of the board to be made <strong>and</strong> changes of thickness or weight are carried out on<br />
the run <strong>and</strong> the whole operation is controlled by computers to ensure consistency of<br />
<strong>production</strong> quality. The effective <strong>production</strong> time on modern machines is in excess of<br />
95%.<br />
At the end of the <strong><strong>carton</strong>board</strong> machine, the <strong><strong>carton</strong>board</strong> is wound into huge reels which<br />
are then moved to the finishing department. Here these reels are either cut into sheets of<br />
the size the printer requires or into smaller reels that can be used directly on a reel fed<br />
printing press. After cutting, the <strong><strong>carton</strong>board</strong> is packed <strong>and</strong> dispatched to the <strong>carton</strong><br />
producers.<br />
Modern cutting machines run continuously, have full computer control, automatic<br />
counting <strong>and</strong> stacking of sheets onto pallets. Customer reels <strong>and</strong> pallets are wrapped in<br />
moisture protective packaging <strong>and</strong> shipped to customers by ship, train or truck. The<br />
mode of transportation is a balanced choice between degree of service to the customer,<br />
cost <strong>and</strong> distance.<br />
© RISE Research Institutes of Sweden
12<br />
Figure 1<br />
Underst<strong>and</strong>ing the manufacturing process 2<br />
Carton <strong>production</strong><br />
Carton <strong>production</strong> starts with the <strong><strong>carton</strong>board</strong> delivered from the mills. Figure 2 shows<br />
a typical layout <strong>for</strong> a <strong>carton</strong> <strong>production</strong> plant <strong>and</strong> the types of processes involved.<br />
2 Source: Carton <strong>and</strong> Board Making: Cartonboard, ProCarton, 2022<br />
© RISE Research Institutes of Sweden
13<br />
Figure 2<br />
Typical layout of a <strong>carton</strong> <strong>production</strong> plant 3<br />
The design <strong>for</strong> a <strong>carton</strong> is either sent to the <strong>carton</strong> producer or developed by them. The<br />
graphics are prepared on a computer <strong>and</strong> colour separation is carried out. From this a<br />
printing plate <strong>for</strong> each colour is prepared. At the same time a “layout” is designed, with<br />
the aim of achieving the optimal board usage <strong>and</strong> there<strong>for</strong>e minimising shape waste<br />
(many <strong>carton</strong>s can be printed on each sheet of <strong><strong>carton</strong>board</strong> <strong>and</strong> so a layout is worked out<br />
to ensure that as little <strong><strong>carton</strong>board</strong> as possible is left unused). The layout is also used to<br />
prepare the cutting <strong>and</strong> creasing <strong>for</strong>ms that are used later in the <strong>production</strong> process.<br />
The <strong><strong>carton</strong>board</strong>, in either sheets or reels, is loaded into the printing machine <strong>and</strong><br />
printed in one pass with each colour being added in turn. A variety of printing processes<br />
may be used, including <strong>for</strong> example offset/lithographic, flexographic <strong>and</strong> gravure<br />
processes. In some cases, digital printing may also be used. This is an emerging<br />
technology that is expected to become more important <strong>for</strong> <strong>carton</strong> <strong>production</strong> in the<br />
future.<br />
Most <strong>carton</strong>s are printed using six colours at a time but less or more can also be used. As<br />
well as the colours, a varnish to improve gloss, or to add a highlight, is also usually<br />
printed after the colours.<br />
At the end of the print machine, the sheets are stacked up <strong>and</strong> moved to the next stage of<br />
<strong>production</strong> – cutting <strong>and</strong> creasing. The printed sheets of <strong>carton</strong>s are taken to a machine<br />
that cuts the <strong>carton</strong>s <strong>and</strong> also puts in the creases that enable it to be folded in a later<br />
operation. This is done using a <strong>for</strong>m into which are set knives <strong>and</strong> creasing rules to<br />
achieve the desired result. It is also possible to add embossing during this operation.<br />
Accuracy is critical to ensure the cuts <strong>and</strong> creases are in exactly the right position.<br />
3 Source: https://www.pro<strong>carton</strong>.com/why-<strong>carton</strong>s/<strong>carton</strong>-<strong>production</strong>/<br />
© RISE Research Institutes of Sweden
14<br />
The individual <strong>carton</strong>s are then stacked up <strong>and</strong> passed through to the next stage of<br />
<strong>production</strong>, folding <strong>and</strong> gluing.<br />
When the <strong>carton</strong>s have been cut <strong>and</strong> creased, they are moved through to the gluing line<br />
where the <strong>carton</strong>s are folded <strong>and</strong> glued. This is done on high-speed machines that, in one<br />
operation, fold the creases <strong>and</strong> glue the seams where necessary.<br />
The <strong>carton</strong>s are then packed <strong>for</strong> shipment to the <strong>carton</strong> user who puts them onto their<br />
packing line <strong>for</strong> filling.<br />
In addition to the typical processes outlined here, additional processes may also be<br />
required <strong>for</strong> specific design features, such as lamination, insertion of window patches,<br />
etc.<br />
Methodology questions<br />
Boundaries <strong>and</strong> declared unit – <strong><strong>carton</strong>board</strong><br />
Gate-to-gate life cycle inventories <strong>for</strong> virgin <strong><strong>carton</strong>board</strong> grades <strong>and</strong> recycled<br />
<strong><strong>carton</strong>board</strong> grades are presented in the Table 2 according to the following declared unit:<br />
one air dry tonne (1000 kg) of net saleable paper at the parent reel,<br />
be<strong>for</strong>e conversion to finished products<br />
The system boundaries of the life cycle inventories <strong>for</strong> <strong><strong>carton</strong>board</strong> include all activities<br />
within the papermill boundaries, including any integrated pulp <strong>production</strong>. Thus,<br />
included in the inventory are all the inputs <strong>and</strong> outputs (from/to the technosphere <strong>and</strong><br />
from/to nature) associated with:<br />
• Integrated pulp <strong>production</strong> from pulp wood/wood chips<br />
• Integrated pulp <strong>production</strong> from paper <strong>for</strong> recycling<br />
• Stock preparation, refining, <strong>and</strong> operation of the paper machine<br />
• Drying<br />
• Reeling <strong>and</strong> reel winding<br />
• Supporting activities used in paper <strong>production</strong>, e.g., water <strong>and</strong> solid waste treatment,<br />
onsite electricity <strong>and</strong> heat/steam generation.<br />
Figure 3 summarises the system boundaries. These system boundaries are representative<br />
of the core processes.<br />
In cases where the mill produces <strong>and</strong> sells excess energy (e.g., electricity or steam), this<br />
is treated as a multifunctional situation. The system provides two functions (i.e.,<br />
<strong><strong>carton</strong>board</strong> plus energy). In this case, subdivision has been applied – i.e., only the inputs<br />
<strong>and</strong> outputs that are allocated to the paper <strong>production</strong> are reported in the life cycle<br />
inventory.<br />
No allocation was made to by-products such as tall oil, turpentine <strong>and</strong> wood/bark chips,<br />
so the reported inputs <strong>and</strong> outputs include the <strong>production</strong> of these by-products.<br />
© RISE Research Institutes of Sweden
15<br />
For those paper mills producing more than one grade of paper <strong>and</strong>/or market pulp it is<br />
necessary to allocate inputs <strong>and</strong> outputs to the different paper grades or pulp. Mill staff<br />
who filled in the questionnaire have made the allocation according to causality.<br />
Data has been collected relating to the following key non-fibre inputs to the pulp <strong>and</strong><br />
papermaking processes:<br />
• Sulphuric acid (H2SO4)<br />
• Sodium hydroxide (NaOH)<br />
• Oxygen (O2)<br />
• Hydrogen peroxide (H2O2)<br />
• Sodium Chlorate (NaClO3)<br />
• Calcium oxide (CaO)<br />
• Chlorine dioxide (ClO2)<br />
• Sodium bisulphite (NaHSO3)<br />
• Ground calcium carbonate (GCC)<br />
• Precipitated calcium carbonate (PCC) – purchased<br />
• Clay<br />
• Wet strength agent<br />
• Dry strength agent<br />
• Synthetic binders (latex)<br />
• Binders (other than latex)<br />
• Starch – maize<br />
• Starch – potato<br />
• Starch – corn/wheat<br />
• Starch – cationic<br />
• Starch - other<br />
The total mass of other non-fibre inputs not listed above is below 1% of the paper weight.<br />
In compliance with the defined cut-off criteria, these other non-fibre inputs have<br />
there<strong>for</strong>e been omitted from the study as insignificant.<br />
© RISE Research Institutes of Sweden
16<br />
Figure 3<br />
Gate-to-gate system boundaries – <strong>production</strong> of <strong><strong>carton</strong>board</strong><br />
© RISE Research Institutes of Sweden
17<br />
System boundaries <strong>for</strong> <strong>carton</strong> <strong>production</strong><br />
The gate-to-gate inventory <strong>for</strong> conversion of <strong><strong>carton</strong>board</strong> into <strong>carton</strong>s is presented in<br />
Table 2 according to the following declared unit:<br />
one tonne (1000 kg) of printed, cut, creased, folded <strong>and</strong> glued <strong>carton</strong>s<br />
The system boundaries of the life cycle inventory <strong>for</strong> conversion of <strong><strong>carton</strong>board</strong> into<br />
<strong>carton</strong> include all activities associated with processing <strong><strong>carton</strong>board</strong> into <strong>carton</strong>s. Thus,<br />
included in the inventory are all the inputs <strong>and</strong> outputs (from/to the technosphere <strong>and</strong><br />
from/to nature) associated with:<br />
• Printing<br />
• Cutting <strong>and</strong> Creasing<br />
• Folding<br />
• Gluing<br />
• Supporting activities used in conversion process, e.g., onsite energy generation, such as<br />
space heating <strong>for</strong> the factory.<br />
Figure 4 summarises the system boundaries.<br />
© RISE Research Institutes of Sweden
18<br />
Figure 4<br />
Gate-to-gate system boundaries – <strong>production</strong> of <strong>carton</strong>s<br />
© RISE Research Institutes of Sweden
19<br />
System boundaries <strong>for</strong> the aggregated results<br />
Also presented in Table 2 are aggregated results which consider <strong>and</strong> quantify the flows<br />
to <strong>and</strong> from the technosphere <strong>and</strong> the environment from the papermill in-gate to<br />
convertor out-gate, as illustrated in Figure 5. In order to complete a cradle-to-gate<br />
analysis <strong>for</strong> <strong>carton</strong>s, life cycle data <strong>for</strong> the items shown in red must be added. The<br />
declared unit <strong>for</strong> the aggregated results is the <strong>production</strong> of one tonne (1000kg) of<br />
printed, cut, creased, folded <strong>and</strong> glued <strong>carton</strong>s.<br />
© RISE Research Institutes of Sweden
20<br />
Figure 5<br />
System boundaries <strong>for</strong> the aggregated <strong><strong>carton</strong>board</strong> <strong>and</strong> converting results<br />
© RISE Research Institutes of Sweden
21<br />
Data description<br />
Questionnaire<br />
Data collection <strong>for</strong> <strong><strong>carton</strong>board</strong><br />
The data was collected via a bespoke questionnaire issued to the mills, requesting<br />
in<strong>for</strong>mation on the flows into <strong>and</strong> out of the mill. The questionnaire was designed to<br />
cover the main inputs to <strong>and</strong> outputs from the integrated pulp <strong>and</strong> papermaking<br />
processes, including the supporting ancillary processes such as energy <strong>production</strong>,<br />
wastewater treatment, etc. The questionnaires were reviewed by technical experts <strong>and</strong><br />
the peer reviewer be<strong>for</strong>e issuing to the industry. The questionnaires were issued during<br />
2022, <strong>and</strong> data was provided representative of <strong>production</strong> scenarios in 2021.<br />
The data <strong>for</strong> FBB were collected from fourteen mills owned <strong>and</strong> operated by six different<br />
companies, representing approximately 93% of the total <strong>production</strong> of this <strong><strong>carton</strong>board</strong><br />
grade in Europe. These paper grades are produced in large mills, located in the<br />
Netherl<strong>and</strong>s, Finl<strong>and</strong>, Germany, Pol<strong>and</strong>, Slovenia, Sweden <strong>and</strong> the UK. Their total<br />
<strong>production</strong> was >3,000,000 tonnes net saleable paper in 2021. The mills each have an<br />
annual <strong>production</strong> of FBB of between 50,000 <strong>and</strong> 350,000 tonnes net saleable paper.<br />
The data <strong>for</strong> the <strong>production</strong> of SUB/SBB were collected from three mills owned <strong>and</strong><br />
operated by two different companies, representing approximately 62% of the total<br />
<strong>production</strong> of this <strong><strong>carton</strong>board</strong> grade in Europe. They were provided by paper mills in<br />
Finl<strong>and</strong> <strong>and</strong> Sweden. Their total <strong>production</strong> was >630,000 tonne saleable paper in 2021.<br />
The mills each have an annual <strong>production</strong> of SUB/SBB of between 90,000 <strong>and</strong> 370,000<br />
tonnes net saleable paper. The data <strong>for</strong> the <strong>production</strong> of SUB/SBB includes <strong>production</strong><br />
of coated, unbleached kraftboard.<br />
As data from only three mills operated by two different companies is available <strong>for</strong><br />
SUB/SBB, <strong>for</strong> confidentiality reasons it is not possible to publish a separate life cycle<br />
inventory <strong>for</strong> this grade. There<strong>for</strong>e, a single inventory is published <strong>for</strong> virgin<br />
<strong><strong>carton</strong>board</strong>, which consists of both FBB <strong>and</strong> SUB/SBB, allowing <strong>for</strong> the relative<br />
<strong>production</strong> of each grade.<br />
The data <strong>for</strong> the <strong>production</strong> of WLC (recycled <strong><strong>carton</strong>board</strong>) were collected from eight<br />
mills owned <strong>and</strong> operated by two different companies, representing approximately 53%<br />
of the total <strong>production</strong> of this <strong><strong>carton</strong>board</strong> grade in Europe. They were provided by paper<br />
mills in Austria, Italy, Germany, Slovenia <strong>and</strong> Spain. Their total <strong>production</strong> was<br />
>2,100,000 tonne saleable paper in 2021. The mills each have an annual <strong>production</strong> of<br />
WLC of between 150,000 <strong>and</strong> 525,000 tonnes net saleable paper.<br />
For all <strong><strong>carton</strong>board</strong> grades, data was collected covering the average market <strong>and</strong><br />
technology situation <strong>for</strong> the calendar year 2021. The collected data was sense-checked by<br />
technical experts <strong>and</strong> compiled as a weighted average representing <strong>production</strong> of each<br />
paper grade in 2021.<br />
© RISE Research Institutes of Sweden
22<br />
Data collection <strong>for</strong> <strong>carton</strong> <strong>production</strong><br />
In order to gather data relating to converting, a questionnaire was designed covering the<br />
main inputs to <strong>and</strong> outputs from <strong>carton</strong> <strong>production</strong> processes. The questionnaires were<br />
reviewed by technical experts <strong>and</strong> the peer reviewer be<strong>for</strong>e issuing to the industry.<br />
The data on <strong>carton</strong> <strong>production</strong> are based on responses from 25 plants. The plants were<br />
located in Austria, Belgium, France, Germany, Pol<strong>and</strong>, Spain, Turkey <strong>and</strong> the United<br />
Kingdom.<br />
Together they produced 530,000 tonnes of <strong>carton</strong>s, which is approximately 10% of the<br />
total annual <strong>production</strong> of <strong>carton</strong>s in Europe. The <strong>production</strong> sites have an average<br />
annual <strong>production</strong> of <strong>carton</strong>s of 21,500 tonnes, varying from 700 – 75,000 tonnes each.<br />
Weighted averages<br />
The Annex presents the weighted averages of the inputs into <strong>and</strong> outputs from the sites<br />
(i.e., gate to gate) per tonne net saleable product <strong>for</strong> virgin <strong><strong>carton</strong>board</strong> (FBB <strong>and</strong><br />
SUB/SBB, which is primarily made from primary fibres), <strong>for</strong> recycled <strong><strong>carton</strong>board</strong> (WLC,<br />
which is primarily made from recovered fibres) <strong>and</strong> <strong>for</strong> <strong>carton</strong>s <strong>for</strong> 2021 from the<br />
participating paper mills <strong>and</strong> converting plants. It is important to underst<strong>and</strong> that the<br />
figures do not represent a certain mill or plant with a certain technology. On the contrary<br />
the figures represent a “virtual mill” <strong>and</strong> a “virtual converting plant” utilising different<br />
technologies. The technology which is applied in the participating paper mills <strong>and</strong><br />
converting plants is not the same.<br />
For example: some mills are fully integrated (produce all pulp required <strong>for</strong> board<br />
<strong>production</strong> onsite), some mills are non-integrated (purchase all pulp required <strong>for</strong> board<br />
<strong>production</strong> from other pulp mills); some mills are semi-integrated use a combined heat<br />
power generation; some wastewater treatment is external; a large variety of additives is<br />
used. In some cases, this leads to a large variation of inputs <strong>and</strong> outputs between the<br />
mills. Furthermore, different inputs <strong>and</strong> outputs are strongly interrelated, so a mill can<br />
be high in one input compared to the others but low in another input, but a mill cannot<br />
be low or high <strong>for</strong> both. There<strong>for</strong>e, no range of the data is given to prevent studies from<br />
being made using a false combination of highest or lowest data.<br />
Due to confidentiality requirements by the mills, it is not possible to split input <strong>and</strong><br />
output data per country. Similarly, a split in applied technologies is not possible.<br />
In the aggregated dataset, the separate life cycle inventories <strong>for</strong> <strong><strong>carton</strong>board</strong> <strong>and</strong> <strong>for</strong><br />
<strong>carton</strong> <strong>production</strong> are combined to compile the life cycle inventory <strong>for</strong> an average tonne<br />
of <strong>carton</strong>s, considering both the <strong>production</strong> of the <strong><strong>carton</strong>board</strong> <strong>and</strong> the conversion of the<br />
<strong><strong>carton</strong>board</strong> into <strong>carton</strong>s. For this average <strong>carton</strong> scenario, the following composition<br />
has been assumed:<br />
• Virgin <strong><strong>carton</strong>board</strong> 51%<br />
• Recycled <strong><strong>carton</strong>board</strong> 49%<br />
These relative shares are calculated from the relative <strong>production</strong> of virgin <strong>and</strong> recycled<br />
<strong><strong>carton</strong>board</strong> in Europe, <strong>and</strong> was confirmed by the data collected relating to board<br />
consumption at the converting plants.<br />
© RISE Research Institutes of Sweden
23<br />
Some converting plants use gravure printing processes <strong>for</strong> high-volume <strong>carton</strong>s, but this<br />
is less common. Gravure printing is more energy intensive compared to other printing<br />
processes. There<strong>for</strong>e, weighted average datasets were prepared <strong>for</strong> plants with gravure<br />
printing processes on site <strong>and</strong> <strong>for</strong> plants without gravure printing onsite, <strong>and</strong> these were<br />
then combined to produce the overall weighted average <strong>for</strong> converting processes. In<br />
preparing this overall weighted average, the following shares were considered <strong>for</strong> gravure<br />
<strong>and</strong> non-gravure printing:<br />
• Share of sites with gravure printing – 11.1%<br />
• Share of sites without gravure printing – 88.9%<br />
In the aggregated dataset <strong>for</strong> <strong>carton</strong> <strong>production</strong>, the relative virgin <strong>and</strong> recycled<br />
<strong><strong>carton</strong>board</strong> shares are used to calculate the inputs <strong>and</strong> outputs <strong>for</strong> the weighted average<br />
<strong><strong>carton</strong>board</strong>. The paper <strong>production</strong> inputs <strong>and</strong> outputs are then multiplied with the<br />
average input of paper (1.1689 tonnes of <strong><strong>carton</strong>board</strong> per tonne of <strong>carton</strong>s) <strong>and</strong> added up<br />
to the inputs <strong>and</strong> outputs per tonne of <strong>carton</strong> converting as reported in the Annex. This<br />
total includes the <strong>production</strong> of the <strong><strong>carton</strong>board</strong> that is used to produce the <strong>carton</strong>s,<br />
including the 14.5% losses that are reported as “paper <strong>for</strong> recycling”. It has to be kept in<br />
mind that the industry averages <strong>for</strong> inputs of <strong><strong>carton</strong>board</strong>, glue, inks, etc are used.<br />
Cartons are far from st<strong>and</strong>ardised <strong>and</strong> inputs of depend on the specific box design.<br />
Material inputs<br />
Raw materials - fibre<br />
The wood input has been reported as bone dry solid wood under bark. The species are<br />
specified, although in the datasets they are reported only as softwood or hardwood.<br />
>80% of the pulp wood used <strong>for</strong> the <strong>production</strong> of <strong><strong>carton</strong>board</strong> by the companies<br />
returning the survey was certified <strong>and</strong> third party verified as being sourced from<br />
sustainable managed <strong>for</strong>ests <strong>and</strong> delivered through a certified chain-of-custody system<br />
(PEFC or similar). A similar proportion of the purchased pulp is also certified <strong>and</strong> third<br />
party verified as being sourced from sustainable managed <strong>for</strong>ests. The input of recovered<br />
paper has been reported as total weight including moisture <strong>and</strong> other materials (s<strong>and</strong>,<br />
metal objects, plastics, wood etc.). In <strong>European</strong> countries the water content of recovered<br />
paper is generally assumed to be about 10%. The total input of recovered paper is given.<br />
The content of other materials in the recovered paper is about 8%. These materials are<br />
eliminated from the pulp as rejects during the pulping. It is estimated that about a third<br />
of these rejects are materials that were associated with the previous use of the paper (<strong>for</strong><br />
example, staples, paper clips, tags, adhesive labels, unrecovered fibres, etc). The<br />
remaining two thirds is material that is not in any way associated with the previous use<br />
of the paper (<strong>for</strong> example, <strong>for</strong>eign items such as textiles, plastic packaging, glass, s<strong>and</strong><br />
<strong>and</strong> grit, etc).<br />
Non-integrated <strong>and</strong> semi-integrated mills buy mechanical <strong>and</strong> chemical pulp. The pulp<br />
data are reported in bone dry 4 weight, which is normally 90% of the wet (air dry) weight.<br />
4 Bone dry weight: weight without any water<br />
© RISE Research Institutes of Sweden
24<br />
Chemicals <strong>and</strong> other non-fibre inputs<br />
Data were collected <strong>for</strong> chemicals <strong>and</strong> other non-fibre inputs to the <strong><strong>carton</strong>board</strong> mills<br />
which may be used either within the process or as additives. Chemicals are given as dry<br />
weight. Some of the inputs have been reported grouped together according to their<br />
function in the mill. The functional additives, mainly starch, influence the properties of<br />
the paper, whilst process additives are used to guarantee that the process of paper<br />
<strong>production</strong> runs smoothly or to increase the <strong>production</strong>. Water treatment additives<br />
include additives used <strong>for</strong> all water treatment on the site, including the treatment of<br />
water <strong>for</strong> the power station, paper <strong>production</strong> <strong>and</strong> wastewater treatment if this is done<br />
internally. The different mills use a large variety of process <strong>and</strong> water treatment<br />
chemicals. Those that are commonly used <strong>and</strong> are above the cut-off criterion per mill are<br />
reported in the <strong>database</strong>. A very limited quantity of other additives <strong>and</strong> chemicals are<br />
also used, e.g. Carboxymethyl cellulose (CMC), Ethylenediaminetetraacetic acid (EDTA),<br />
Sodium hypochlorite, Polyvinyl alcohol, Alkyl succinic anhydride (ASA) sizer, talc,<br />
Polyacrylate, PEI, optical brightener, rosin. Collectively, these additional additives <strong>and</strong><br />
chemicals account <strong>for</strong> less than 1% of the material inputs to the manufacturing of<br />
<strong><strong>carton</strong>board</strong>.<br />
Other than <strong><strong>carton</strong>board</strong>, the main input <strong>for</strong> <strong>carton</strong> <strong>production</strong> is inks <strong>and</strong> varnish,<br />
followed by glues. However, these inputs account <strong>for</strong> less than 2% of the overall<br />
composition of the <strong>carton</strong>s.<br />
Packaging<br />
Data on cores <strong>and</strong> other packaging materials associated with paper reels was not<br />
collected <strong>and</strong> updated <strong>for</strong> 2021. Looking at previous data collections, the values showed<br />
little change over the years <strong>and</strong> other LCA studies show that the impacts of these<br />
packaging components are relatively small.<br />
Data <strong>for</strong> packaging materials used around converted <strong>carton</strong>s (stretch/shrink wrap <strong>and</strong><br />
corrugated packaging) was collected <strong>and</strong> updated <strong>for</strong> 2021. Pallets are also used in the<br />
logistic operations of the <strong>carton</strong> industry. However, data on usage of pallets has not been<br />
collected. Previous iterations of the study have shown that the reported data on the use<br />
of pallets are confusing because of the complexity of the matter. Pallets can be returnable<br />
or one-way, only used internally in the plants <strong>and</strong> produced of wood, plastic or paper/<br />
wood combinations. Previously some plants have reported their use in number of pallets<br />
while others have reported in kilogram pallet per tonne net saleable product, making it<br />
difficult to produce a meaningful figure.<br />
Allocation of raw materials to paper grades when a mill produces multiple<br />
products<br />
The basic data <strong>for</strong> raw materials <strong>and</strong> chemical inputs are mainly based on recipes used<br />
<strong>for</strong> the <strong>production</strong> of the specific products produced at each mill (i.e., allocation based<br />
on causality). Where this was not possible, allocation was made according to the mass<br />
<strong>production</strong> of the different papers produced at the mill.<br />
© RISE Research Institutes of Sweden
25<br />
Material outputs<br />
The main output from the paper mills is of course <strong><strong>carton</strong>board</strong>. This includes about 2 kg<br />
of cores <strong>and</strong> plugs per tonne paper, which are considered <strong>and</strong> weighed as part of the net<br />
saleable product. The <strong>carton</strong> converting plants produce <strong>carton</strong>s. The average moisture<br />
content of the saleable product is estimated at 8% <strong>for</strong> both virgin <strong><strong>carton</strong>board</strong> <strong>and</strong><br />
recycled <strong><strong>carton</strong>board</strong>. The main saleable by-products from the <strong>production</strong> of virgin<br />
<strong><strong>carton</strong>board</strong> <strong>production</strong> are tall oil, tall soap <strong>and</strong> turpentine. In addition, some process<br />
residues are utilised as raw materials in other industrial processes. To aid LCA<br />
practitioners in deciding what burdens should be considered <strong>for</strong> residues, the end-of-life<br />
management destinations <strong>for</strong> each residue stream are indicated in the inventories.<br />
Residues<br />
All residues are reported as wet weight, separated according to their basic nature.<br />
Residues are only reported where they leave the system boundaries (i.e., where they are<br />
removed from <strong>and</strong> managed away from the site). As the mill is considered as a blackbox,<br />
energy <strong>and</strong> emissions associated with managing residues internally (onsite) are included<br />
within the gate-to-gate inventory data. The treatment option <strong>for</strong> residues was not<br />
reported by all mills, so extrapolation has been necessary from those mills which did<br />
report this in<strong>for</strong>mation.<br />
For the residue stream Rejects from paper <strong>for</strong> recycling, which is mainly rejects from<br />
pulp preparation from recovered paper, it is estimated that about a third is due to<br />
rejected materials that were associated with the previous use of the paper (<strong>for</strong> example,<br />
staples, paper clips, tags, adhesive labels, unrecovered fibres, etc). The remaining two<br />
thirds is material that is not in any way associated with the previous use of the paper (<strong>for</strong><br />
example, <strong>for</strong>eign items such as textiles, plastic packaging, glass, s<strong>and</strong> <strong>and</strong> grit, etc).<br />
Primary fibre sludge <strong>and</strong> biological treatment sludge from wastewater treatment in mills<br />
are mostly recycled in the process <strong>and</strong> do not leave the site. Where they are exported<br />
from the site <strong>for</strong> treatment, they are mostly recycled (e.g. as an input into the <strong>production</strong><br />
of construction materials, as an input into corrugated or tissue <strong>production</strong>, or as animal<br />
bedding), but may also be applied to l<strong>and</strong> as a soil improver (l<strong>and</strong>spreading), composted<br />
or incinerated with energy recovery. No mills reported sending organic sludges to<br />
l<strong>and</strong>fill.<br />
Ashes, green liquor sludge <strong>and</strong> lime mud are commonly reported residues from the<br />
<strong>production</strong> of primary fibre-based paper. Ashes are predominantly recycled (as an input<br />
into construction materials) but may also be applied to l<strong>and</strong> as a soil improver<br />
(l<strong>and</strong>spreading). Green liquor dregs may also be recycled (as an input into construction<br />
materials), although a proportion of this residue stream is currently disposed of to<br />
ordinary l<strong>and</strong>fill sites. Lime mud is predominantly applied to l<strong>and</strong> as a soil improver<br />
(l<strong>and</strong>spreading).<br />
For <strong>carton</strong> <strong>production</strong> the main waste stream is paper <strong>for</strong> recycling, which is recycled<br />
<strong>and</strong> thus should not be called waste but recyclable material.<br />
© RISE Research Institutes of Sweden
26<br />
Allocation of residues to paper grades when a mill produces more than one<br />
paper grade<br />
Data <strong>for</strong> material outputs are based on measurements. These have to be done because<br />
the mills have to pay <strong>for</strong> l<strong>and</strong>fill <strong>and</strong> incineration or get paid <strong>for</strong> residues that are reused<br />
or recycled, like lubricants, according to the weight. When of residues between products<br />
was required, this was done on the basis of causality wherever possible. Where this was<br />
not possible, allocation was made according to mass of the different papers produced.<br />
Energy input <strong>and</strong> output<br />
Fuel inputs to the sites are reported in GJ. The lower calorific heat values have been used<br />
to calculate GJ from m3 or tonnes of fuel. Fossil fuel <strong>and</strong> biomass fuel have been reported<br />
separately. The energy figures <strong>for</strong> the sites include both energy <strong>for</strong> process <strong>and</strong> energy<br />
<strong>for</strong> infrastructure. No attempts have been made to differentiate between these two types<br />
of energy usage because process energy dominates (98% or more <strong>for</strong> the <strong><strong>carton</strong>board</strong><br />
mills, although space heating can be a significant share of the thermal energy consumed<br />
at converting plants).<br />
Input of electricity into the sites is also reported. Electricity produced at the site itself is<br />
not reported. Some mills sell energy externally in the <strong>for</strong>m of electricity, steam or warm<br />
water. The <strong>production</strong> sites are treated as a black box in the <strong>database</strong>, giving data on<br />
inputs <strong>and</strong> outputs only. Because no in<strong>for</strong>mation is given about what happens within the<br />
box it is not possible to calculate an energy balance with the data in the <strong>database</strong>. Within<br />
this black box, energy is recovered through the burning of black liquor <strong>and</strong> bark from the<br />
wood coming in at <strong>production</strong> sites <strong>for</strong> primary fibre-based <strong><strong>carton</strong>board</strong> <strong>production</strong>. For<br />
some FBB <strong>and</strong> SUB/SBB mills, most of the energy used in the process comes from<br />
internal burning of the black liquor. This inherent energy is not reported as part of the<br />
fuel input in the gate-to-gate inventory, although it is reported separately in Table 3. The<br />
total energy input <strong>for</strong> the process <strong>for</strong> virgin <strong><strong>carton</strong>board</strong> <strong>production</strong> including the black<br />
liquor burning is around 12.5 GJ/tonne. The total energy input <strong>for</strong> the <strong>production</strong> of<br />
recycled <strong><strong>carton</strong>board</strong> is around 6.5 GJ/tonne. Combined heat power generation is<br />
applied at most of the <strong>production</strong> sites, but not always in the same way. The combined<br />
heat power generation can cover all or part of the steam consumption (Figure 6). When<br />
it covers only part of the steam consumption, then additional boilers also produce steam.<br />
The process always uses more heat (steam) than electricity. There<strong>for</strong>e, when the<br />
installation is designed to cover the whole steam consumption more electricity is<br />
generated than is needed <strong>for</strong> the process. The excess of electricity is sold to the public<br />
grid. There are two possible ways of treating this excess electricity in an LCA.<br />
a. The <strong>production</strong> of electricity is an integral part of the <strong><strong>carton</strong>board</strong> <strong>production</strong>: it would<br />
not be produced if the paper were not produced. Cartonboard is thus considered as the<br />
only “product” of the process. In an LCA this would mean that electricity generation <strong>for</strong><br />
the public grid is “saved” when an excess of electricity produced at a paper mill is sold to<br />
the public grid. Thus, environmental inputs <strong>and</strong> outputs are saved since combined heat<br />
power installation produces electricity with a higher efficiency than the public grid.<br />
b. Another possibility is to consider the paper <strong>and</strong> excess electricity as co-products.<br />
Cartonboard <strong>and</strong> electricity are then both “products” from the process. In an LCA this<br />
would require allocation of inputs <strong>and</strong> outputs to both products.<br />
© RISE Research Institutes of Sweden
27<br />
The reported weighted averages of the fuel consumption <strong>and</strong> emission to air associated<br />
with the <strong><strong>carton</strong>board</strong> <strong>production</strong> are calculated according to method b, as this has<br />
become common practice at the mills. This means that the fuel consumption <strong>and</strong><br />
emissions to air reported in the inventories do not include the <strong>production</strong> of the sold<br />
electricity <strong>and</strong> the amount of the sold electricity is not reported. This was calculated as<br />
follows: the fuel consumption <strong>and</strong> emissions to air associated with the total heat<br />
<strong>production</strong> <strong>and</strong> the net electricity used on site were allocated to the <strong><strong>carton</strong>board</strong><br />
<strong>production</strong><br />
Figure 6<br />
CHP, Combined heat <strong>and</strong> power generation<br />
Diesel or gasoil/LPG used <strong>for</strong> internal transports are also reported in the inventories.<br />
Allocation of energy to paper grades when a mill produces more than one<br />
paper grade<br />
Purchased energy <strong>and</strong> fuels are measured, because they paid <strong>for</strong>. Allocation <strong>for</strong> fuels <strong>and</strong><br />
electricity input is calculated according to energy (heat <strong>and</strong> electricity) required <strong>for</strong> the<br />
<strong>production</strong> of the different paper grades. Allocation of the other fuels, such as diesel oil<br />
used <strong>for</strong> internal transportation, was calculated according to mass <strong>production</strong> of each<br />
paper grade.<br />
Water inputs <strong>and</strong> outputs<br />
When paper mills use water, they do not consume this water during the <strong>production</strong><br />
process. After (re)use it is returned to the rivers, lakes or seas as cooling water <strong>and</strong><br />
purified effluent water. A limited amount of water is evaporated (about 1-1.5 m3/tonne<br />
nsp) in the drying section of the paper <strong>production</strong>. The water debate focuses on the<br />
impact of water consumption. This is best reflected in the local water availability rather<br />
than in the amount of water taken into the mills. There<strong>for</strong>e, the appropriate indicator is<br />
the net difference of water taken in <strong>and</strong> water returned to the rivers or lakes (water<br />
consumed, not taken in).<br />
© RISE Research Institutes of Sweden
28<br />
Transport<br />
The transport distances of wood raw materials from the harvesting sites in the <strong>for</strong>ests to<br />
the mills have been reported separately <strong>for</strong> trucks, rail <strong>and</strong> ships. The trucks <strong>and</strong> rail<br />
wagons are normally loaded to full capacity but go back empty. The trucks carry 40-44<br />
tonnes of wood. This in<strong>for</strong>mation has been collected on a species-by-species basis <strong>for</strong><br />
each mill, considering the wet weight of the wood. Data has also been collected <strong>for</strong> the<br />
delivery of sawmill residues <strong>and</strong> similar sources of fibre. Distances <strong>and</strong> tonnages of wood<br />
delivered have then been used to calculate the total t.km <strong>for</strong> delivery of wood by each<br />
mode of transport (truck, rail <strong>and</strong> boat). This is then used to calculate the t.km/t of<br />
<strong>production</strong> <strong>for</strong> each grade at each mill, calculated on a mill-by-mill, input-by-input basis.<br />
A weighted average t.km is then calculated based on the relative <strong>production</strong> share of each<br />
mill.<br />
A similar approach is applied <strong>for</strong> calculating the transport requirements <strong>for</strong> recovered<br />
paper. Transport distances from point of origin of the recovered paper bales to the mills<br />
have been reported on a recovered paper grade-by-grade basis <strong>for</strong> each mill. Distances<br />
<strong>and</strong> tonnages of recovered paper delivered have then been used to calculate the total t.km<br />
<strong>for</strong> delivery of recovered paper by each mode of transport (truck, rail <strong>and</strong> boat). This is<br />
then used to calculate the t.km/t of <strong>production</strong> <strong>for</strong> each grade at each mill, calculated on<br />
a mill-by-mill, input-by-input basis. A weighted average t.km is then based on the<br />
relative <strong>production</strong> share of each mill. Generally, the lorries are loaded to full capacity.<br />
On the return trip it is estimated that 40% of the trucks return empty. Assuming this is<br />
transported by a truck with a loading capacity of 40 tonnes this means that this figure<br />
has to be used in combination with data on inputs <strong>and</strong> outputs <strong>for</strong> transport by a 40t<br />
truck.<br />
Similar data has also been collected <strong>and</strong> applied to estimate the transport associated with<br />
non-fibre inputs. Transport data has been collected <strong>for</strong> the most important non-fibre<br />
inputs (sulphuric acid, sodium hydroxide, oxygen, hydrogen peroxide, sodium chlorate,<br />
calcium oxide, chlorine dioxide, sodium bisulphite, synthetic binders (latex), ground<br />
calcium carbonate, precipitated calcium carbon (purchased), clay, wet strength, AKD<br />
sizer, <strong>and</strong> starches).<br />
Data has also been collected regarding the average transport of the residues from the<br />
paper mill to the residue treatment process. Where no data was available relating to the<br />
transport distance <strong>for</strong> selected residue streams, a worst case scenario of 100km is<br />
assumed.<br />
Data was also collected from the papermills on average delivery distances <strong>and</strong> modes of<br />
transports to their customers. This data was provided on a product-by-product basis <strong>and</strong><br />
was used to calculate a weighted average t.km <strong>for</strong> delivery of <strong><strong>carton</strong>board</strong> to the <strong>carton</strong><br />
converting plants. However, any one <strong>carton</strong> converting plant will of course source the<br />
substrates they use from many different suppliers. There<strong>for</strong>e, the values presented in the<br />
inventory are only indicative <strong>and</strong> in practice users of the data may wish to consider<br />
delivery of materials on a case-by-case.<br />
Internal transport is included in the energy input.<br />
© RISE Research Institutes of Sweden
29<br />
Emissions to air<br />
Emissions from fuel combustion (transport, electricity generation <strong>for</strong> the public grid)<br />
outside the mill are not included in the data. In case the site sold electricity, the emissions<br />
associated with the sold electricity are not included. Emissions to air from the sites have<br />
been reported. For dust, TRS (H2S), NOx <strong>and</strong> SOx the figures from the paper mills are<br />
mostly based on measurements. For CO2, the figures reported are based on emissions<br />
reported to authorities where provided, or where these were not provided they are based<br />
on calculations considering the rules consumed. CO2 emissions are reported separately<br />
<strong>for</strong> fossil <strong>and</strong> biomass origin.<br />
Carton converting plants have no measured air emission data to report. There<strong>for</strong>e, the<br />
air emission figures <strong>for</strong> <strong>carton</strong> converting reported in the inventory are calculated from<br />
reported figures <strong>for</strong> consumption of different fuels in the converting plants. Unless the<br />
sites reported a specific emission factor, the emission factors in Table 1 were used <strong>for</strong> the<br />
calculations.<br />
Table 1 Default factors <strong>for</strong> calculating CO2 emissions to air from fuels<br />
Fuel type<br />
Emission factor (kgCO2/GJ)<br />
Fossil fuels<br />
Natural gas 56<br />
Heavy fuel oil 77<br />
Light fuel oil 74<br />
Diesel oil 74<br />
LPG 65<br />
Hard coal 95<br />
Brown coal (lignite) 101<br />
Brown coal (briquettes) 98<br />
Peat 106<br />
Bio-based fuels<br />
Wood, bark 125<br />
Black liquor 110<br />
Biogas 55<br />
Emissions to air in the flue gas from the CHP power station are given <strong>for</strong> the mills that<br />
use combined heat power generation. Emissions from the incineration of rejects with<br />
energy recovery at the mill are included. Emissions in the steam from the drying section<br />
of the paper machines are not included. When mills have anaerobic wastewater<br />
© RISE Research Institutes of Sweden
30<br />
treatment on the site, biogas originating from this process is used as a fuel by the mill.<br />
The emissions to air originating from the use of biogas as fuel are included.<br />
Very few mills were able to report any figures <strong>for</strong> emissions to air such as metals etc.<br />
Where data was reported the same substances were not always covered <strong>and</strong> where<br />
common emissions were reported these showed a large variation per mill, primarily due<br />
to differences in measuring/monitoring <strong>and</strong>/or calculation regimes. There<strong>for</strong>e, this<br />
in<strong>for</strong>mation has not been included in the datasets. For conducting their own LCI or LCA<br />
studies, users of the dataset are advised that they should include such emissions. These<br />
can be estimated through the application of st<strong>and</strong>ard emissions data <strong>for</strong> the combustion<br />
of different fossil fuels, together with the amount of fossil fuels used in the processes (as<br />
indicated in the inventories). This will allow an estimation to be made of the order of<br />
magnitude of these emissions.<br />
Allocation of emissions to paper grades when a mill produces more than one<br />
paper grade<br />
Emissions to air are calculated from measurements, applied technology, permit values<br />
or from the input of fuels. Necessary allocations were done in the same way as <strong>for</strong> energy<br />
input.<br />
Emissions to water<br />
Water that is taken in must be treated be<strong>for</strong>e it is used in the process, <strong>and</strong> it is again<br />
treated after the process be<strong>for</strong>e it is released as effluent to a recipient. The substances in<br />
the effluent after wastewater treatment are reported. All mills have some sort of effluent<br />
water treatment, either mechanical treatment by sedimentation or in addition biological<br />
anaerobic <strong>and</strong> aerobic or chemical treatment of the effluent. A few mills send their<br />
effluent water to an external communal treatment plant. The volume of effluent water is<br />
reported separately <strong>for</strong> treated process water <strong>and</strong> thermally polluted effluent (e.g.,<br />
cooling water). All mills have reported the figures <strong>for</strong> outgoing effluent water to the<br />
recipient body (i.e., effluent water after final treatment). The amount of substances<br />
(COD, BOD, suspended solids, AOX, Total N, Total P) per m3 of effluent from the<br />
different mills show very little variation when the efficiency of the waste water treatment<br />
station is the same. The amount of substances per tonne paper <strong>production</strong> may however<br />
vary according to the amount of effluent, depending on specific circumstances in the<br />
paper <strong>production</strong> process in the different mills. In the questionnaire <strong>for</strong> data collection,<br />
a number of other emissions were reported by some mills, such as oils, nitrates, acids,<br />
chlorate, chlorides, borates, phenol, Hg, Pb etc. However, few mills reported these<br />
figures, probably because there are no or few measurements. Subsequently, only COD,<br />
BOD5, suspended solids, total nitrogen <strong>and</strong> total phosphorus, which are based on data<br />
from most mills, in addition to the total volume of effluent waters are reported. Due to<br />
the water treatment it is possible that the content of certain substances per m3 is higher<br />
if the water is taken from a river than in the effluent released into the river. In an LCA<br />
this would mean that the <strong>production</strong> of paper could be credited <strong>for</strong> the reduction in<br />
substances, although in practice this rarely happens. This principle is illustrated in<br />
Figure 7.<br />
© RISE Research Institutes of Sweden
31<br />
Figure 7<br />
Potential credit <strong>for</strong> reduction of substances in the effluent water<br />
Since only a few mills analyse their incoming water the available data cannot be<br />
considered as representative. There<strong>for</strong>e, only data <strong>for</strong> the emissions to the recipient are<br />
given, without taking into account the substances in the incoming water. Most of the<br />
<strong><strong>carton</strong>board</strong> plants have internal wastewater treatment, <strong>and</strong> in some cases this is then<br />
further treated externally afterwards. In case the wastewater is not further treated<br />
externally <strong>and</strong> released to the environment, the emission level of substances is so low<br />
that reporting them is not required by authorities.<br />
Besides the substances reported in Table 4, very few plants have also given data on some<br />
of the following emissions: metals (Cadmium, Chromium, Lead, Nickel, Iron, Boron,<br />
Aluminium), Chlorine <strong>and</strong> Phosphorus. The amounts are below 0.001 kg/tonne nsp <strong>and</strong><br />
are not reported in the inventories.<br />
Allocation of emissions to paper grades when a mill produces more than one<br />
paper grade<br />
As far as waterborne emissions per m3 are measured <strong>for</strong> a mill, these data are well<br />
documented. The figures reported are usually based on continuous measurements<br />
according to control programmes set by official authorities. Given emissions to water are<br />
generally measured according to st<strong>and</strong>ard methodology, although <strong>for</strong> COD <strong>and</strong> BOD<br />
results can be significantly different if measured on a homogenous sample or on a settled<br />
sample. Where necessary, allocation between paper grades is done according to mass of<br />
produced paper grade.<br />
Data on emissions to water from the <strong>carton</strong> converting plants were also collected.<br />
However, the converting plants are not subject to Industrial Emissions legislation, <strong>and</strong><br />
there<strong>for</strong>e the quantity <strong>and</strong> quality of available data is inconsistent. This is further<br />
complicated by the fact that the <strong><strong>carton</strong>board</strong> plants do not all have their own effluent<br />
treatment facilities or treat only certain aspects of the wastewater associated with specific<br />
processes (<strong>for</strong> example, ink recovery). Many plants discharge a proportion of their<br />
wastewater under specific agreement to public effluent treatment facilities <strong>and</strong> there<strong>for</strong>e<br />
do not have access to data on the releases to the environment (after final treatment). For<br />
© RISE Research Institutes of Sweden
32<br />
this reason, data representative of emissions after a public wastewater treatment plant<br />
should be considered <strong>for</strong> the waste emissions from the converting plants.<br />
Data<br />
Coverage <strong>and</strong> comparability of the datasets<br />
Pro Carton has previously surveyed the environmental per<strong>for</strong>mance of the <strong><strong>carton</strong>board</strong><br />
<strong>and</strong> <strong>carton</strong> industry. Inevitably, over time the coverage of the surveys has changed:<br />
• Old paper mills <strong>and</strong> converting facilities have closed <strong>and</strong> new mills <strong>and</strong> converting<br />
facilities have opened<br />
• Mills may change the grades of board they are producing<br />
• Additional mills <strong>and</strong> converting facilities may have opted to participate in the survey<br />
whilst others have dropped out of participation, changing the coverage <strong>and</strong><br />
representativeness of the datasets<br />
In particular, <strong>for</strong> the 2021 survey compared to the previous survey in 2018:<br />
• 9 mills producing approximately 3,000,000 tonnes of WLC contributed to the 2021<br />
survey compared to 8 mills producing approximately 2,000,000 tonnes participating in<br />
the 2018 survey<br />
• 14 mills producing approximately 2,250,000 tonnes of FBB contributed to the 2021<br />
survey compared to 10 mills producing approximately 2,000,000 tonnes participating in<br />
the 2018 survey<br />
• 3 mills producing approximately 630,000 tonnes of SBB/SUB contributed to the 2021<br />
survey compared to 4 mills producing approximately 1,000,000 tonnes participating in<br />
the 2018 survey<br />
• 25 converting plants producing approximately 530,000 tonnes of <strong>carton</strong>s contributed to<br />
the 2021 survey compared to 33 converting plants producing approximately 450,000<br />
tonnes participating in the 2018 survey.<br />
With the exception of SBB/SUB <strong>production</strong>, the share of the market covered in the<br />
surveys has been increased. These changes in participation in the survey mean that the<br />
weighted averages generated are there<strong>for</strong>e more representative of average <strong>European</strong><br />
<strong>production</strong>, <strong>and</strong> there<strong>for</strong>e represents an improvement in the quality of the datasets. This<br />
change in coverage of the surveys should be borne in mind when comparing the weighted<br />
average results in the previous editions of the report.<br />
Relationship to the Product Environmental<br />
Footprint (PEF)<br />
Over the course of multiple iterations of the project a robust process has been developed<br />
in which the data provided is processed <strong>and</strong> checked by both LCA practitioners <strong>and</strong><br />
industry experts. The process <strong>and</strong> data are then subjected to an independent peer review.<br />
This experience has led to the generation of a well-respected <strong>and</strong> transparent life cycle<br />
inventory dataset <strong>for</strong> the <strong>production</strong> of <strong><strong>carton</strong>board</strong> <strong>and</strong> the conversion of <strong><strong>carton</strong>board</strong><br />
© RISE Research Institutes of Sweden
33<br />
into <strong>carton</strong>s. This process <strong>and</strong> the data collected mirrors the data collection <strong>and</strong> life cycle<br />
inventories presented by other sectors in the paper <strong>and</strong> board packaging industry 5 .<br />
There<strong>for</strong>e, Pro Carton intends to continue to collect <strong>and</strong> process the data using the same<br />
methods <strong>and</strong> present the in<strong>for</strong>mation in the same <strong>for</strong>mat.<br />
More recently, the <strong>European</strong> Commission has proposed the Product Environmental<br />
Footprint (PEF) as a common way of measuring environmental per<strong>for</strong>mance 6 . To<br />
facilitate the adoption of the PEF methodology, the <strong>European</strong> Commission is developing<br />
a <strong>database</strong> of life cycle inventory data. Category rules <strong>for</strong> compiling life cycle studies in<br />
compliance with the PEF methodology are also in development. PEF category rules have<br />
already been published <strong>for</strong> Intermediate Paper Products 7 , but no category rules have<br />
been published covering the conversion of these into end products.<br />
The PEF methodology is still in development <strong>and</strong> open to discussion, <strong>and</strong> category rules<br />
are currently only available <strong>for</strong> the <strong>production</strong> of base papers not including conversion.<br />
There<strong>for</strong>e, whilst the data <strong>for</strong> this life cycle inventory has been collected with reference<br />
to the PEF <strong>and</strong>, where relevant, the Product Category rules <strong>for</strong> Intermediate Paper<br />
Products, no claim of compliance with the PEF methodology or data requirements is<br />
made.<br />
Results<br />
Life cycle inventory <strong>for</strong> <strong><strong>carton</strong>board</strong> <strong>and</strong> <strong>carton</strong>s 2021<br />
Table 2 presents the gate-to-gate life cycle inventories <strong>for</strong>:<br />
• Production of <strong><strong>carton</strong>board</strong> manufactured primarily from primary fibres: Folding<br />
Box Board (FBB) <strong>and</strong> Solid Bleached Board/Solid Unbleached Board (SBB/SUB)<br />
• Production of <strong><strong>carton</strong>board</strong> manufactured primarily from recovered fibres: White<br />
Lined Chip (WLC)<br />
• Conversion of <strong><strong>carton</strong>board</strong> into blank <strong>carton</strong>s, including die cutting, creasing,<br />
printing <strong>and</strong> where applicable folding/gluing<br />
• An aggregated dataset, which considers the <strong>production</strong> of average <strong>European</strong><br />
<strong><strong>carton</strong>board</strong> <strong>and</strong> the conversion of this average <strong><strong>carton</strong>board</strong> into <strong>carton</strong>s.<br />
5 e.g., <strong>European</strong> Database <strong>for</strong> Corrugated Board Life Cycle Studies, FEFCO <strong>and</strong> Cepi<br />
Containerboard, 2021<br />
6<br />
https://eplca.jrc.ec.europa.eu/EnvironmentalFootprint.html?msclkid=d1c44024bd6311ec9a316<br />
02979545205<br />
7 Product Environmental Footprint Category Rules: Intermediate Paper Products, CEPI, October<br />
2018<br />
© RISE Research Institutes of Sweden
Recycled<br />
<strong><strong>carton</strong>board</strong><br />
Virgin<br />
<strong><strong>carton</strong>board</strong><br />
Carton<br />
conversion<br />
Aggregated<br />
average board<br />
<strong>production</strong> <strong>and</strong><br />
cartton<br />
conversion<br />
34<br />
Table 2 Gate-to-gate life cycle inventories<br />
PRODUCT &<br />
REFERENCE<br />
FLOW<br />
tonne net<br />
saleable product<br />
1 1 1 1<br />
SOLD BYPRODUCTS<br />
Tall oil/Tall soap kg/t 0.00 0.39 - 0.23<br />
Turpentine kg/t 0.00 0.11 - 0.06<br />
RAW MATERIAL<br />
Wood consumption<br />
as bone dry<br />
weight (= 45% of<br />
transported total<br />
wet weight)<br />
Softwood logs – total t/t 0.006 0.380 - 0.230<br />
Hardwood logs t/t 0.000 0.153 - 0.091<br />
Sawmill residues softwood t/t 0.031 0.125 - 0.093<br />
Sawmill residue hardwood t/t 0.000 0.005 - 0.003<br />
Total wood t/t 0.037 0.633 - 0.398<br />
Recovered paper<br />
as wet mass<br />
Mixed grades t/t 0.707 0.017 - 0.415<br />
Corrugated <strong>and</strong> Kraft, preconsumer<br />
t/t 0.024 0.000 - 0.014<br />
Corrugated <strong>and</strong> Kraft, postconsumer<br />
t/t 0.019 0.000 - 0.011<br />
Newspaper <strong>and</strong> Magazines t/t 0.018 0.000 - 0.010<br />
Other grades t/t 0.077 0.003 - 0.045<br />
Total recovered paper t/t 0.845 0.020 - 0.496<br />
Purchased pulp consumption as bone dry<br />
weight<br />
Bleached kraft pulp, eucalyptus kg/t 0.0 10.8 - 6.4<br />
Bleached kraft pulp, hardwood kg/t 1.0 154.9 - 92.9<br />
Bleached kraft pulp, softwood kg/t 0.0 40.9 - 24.4<br />
Bleached sulphite pulp, hardwood kg/t 0.0 38.7 - 23.1<br />
Mechanical wood pulp kg/t 26.1 0.0 - 15.0<br />
Semi-chemical wood pulp kg/t 0.5 99.8 - 59.7<br />
Thermomechanical pulp kg/t 0.0 18.9 - 11.3<br />
Unbleached kraft pulp, softwood kg/t 0.0 0.7 - 0.4<br />
CTMP kg/t 0.3 1.8 - 1.2<br />
Other kg/t 5.8 12.5 - 10.8<br />
Total purchased pulp kg/t 33.6 378.9 - 245.2<br />
Paper consumption <strong>for</strong><br />
<strong>carton</strong> <strong>production</strong><br />
Total t/t - - - 1.169<br />
© RISE Research Institutes of Sweden
Recycled<br />
<strong><strong>carton</strong>board</strong><br />
Virgin<br />
<strong><strong>carton</strong>board</strong><br />
Carton<br />
conversion<br />
Aggregated<br />
average board<br />
<strong>production</strong> <strong>and</strong><br />
cartton<br />
conversion<br />
35<br />
PRODUCT &<br />
REFERENCE<br />
FLOW<br />
tonne net<br />
saleable product<br />
1 1 1 1<br />
ENERGY INPUTS<br />
Purchased energy<br />
Purchased heat/steam GJ/t 0.000 0.000 0.000 0.000<br />
Bought electricity GJ/t 0.609 2.093 0.902 2.499<br />
Purchased fossil fuels<br />
Natural gas GJ/t 5.168 2.056 0.246 4.432<br />
Heavy fuel oil GJ/t 0.000 0.068 0.015 0.055<br />
Light fuel oil GJ/t 0.000 0.076 0.018 0.064<br />
Diesel oil GJ/t 0.026 0.003 0.007 0.023<br />
LPG GJ/t 0.002 0.651 0.000 0.389<br />
Coal GJ/t 0.703 0.263 0.001 0.561<br />
Lignite GJ/t 0.000 0.000 0.000 0.000<br />
Peat GJ/t 0.000 0.132 0.000 0.078<br />
Refuse derived fuel (RDF) - fossil GJ/t 0.000 0.126 0.000 0.075<br />
Others GJ/t 0.000 0.000 0.001 0.001<br />
Total fossil fuels GJ/t 5.899 3.374 0.288 5.679<br />
Purchased renewable fuels<br />
Bark GJ/t 0.000 0.997 0.000 0.595<br />
Scrap wood GJ/t 0.000 0.479 0.000 0.286<br />
Total renewable fuels GJ/t 0.000 1.476 0.000 0.880<br />
Total purchased fuel GJ/t 5.899 4.850 0.288 6.559<br />
© RISE Research Institutes of Sweden
Recycled<br />
<strong><strong>carton</strong>board</strong><br />
Virgin<br />
<strong><strong>carton</strong>board</strong><br />
Carton<br />
conversion<br />
Aggregated<br />
average board<br />
<strong>production</strong> <strong>and</strong><br />
cartton<br />
conversion<br />
36<br />
PRODUCT &<br />
REFERENCE<br />
FLOW<br />
tonne net<br />
saleable product<br />
1 1 1 1<br />
WATER INPUTS<br />
Ground water (non-renewable) m 3 /t 0.00 0.35 0.04 0.25<br />
Ground water (renewable) m 3 /t 5.34 0.08 0.01 3.11<br />
Surface water - lake m 3 /t 0.48 27.98 0.00 16.95<br />
Surface water - river m 3 /t 3.88 10.98 0.00 8.77<br />
Sea water m 3 /t 0.00 0.32 0.01 0.20<br />
Municipal water m 3 /t 0.03 0.42 0.16 0.426<br />
Rainwater m 3 /t 0.00 0.00 0.00 0.00<br />
Other water received m 3 /t 0.00 0.00 0.00 0.00<br />
Input total m 3 /t 9.73 40.13 0.22 29.71<br />
© RISE Research Institutes of Sweden
Recycled<br />
<strong><strong>carton</strong>board</strong><br />
Virgin<br />
<strong><strong>carton</strong>board</strong><br />
Carton<br />
conversion<br />
Aggregated<br />
average board<br />
<strong>production</strong> <strong>and</strong><br />
cartton<br />
conversion<br />
37<br />
PRODUCT &<br />
REFERENCE<br />
FLOW<br />
tonne net<br />
saleable product<br />
1 1 1 1<br />
NON-FIBRE INPUTS (PROCESS CHEMICALS AND ADDITIVES), DRY MASS<br />
AKD sizer kg/t 0.25 0.30 - 0.33<br />
Alum (Al2(SO4)3 kg/t 0.003 1.93 - 1.15<br />
Binders (other than latex) kg/t 2.68 0.00 - 1.54<br />
CaCO 3 – GCC (Ground calcium kg/t 46.99 74.82 - 71.53<br />
carbonate<br />
CaCO 3 – PCC (Precipitated calcium kg/t 0.00 6.73 - 4.01<br />
carbonate, purchased)<br />
Calcium Oxide (CaO) kg/t 0.00 3.67 - 2.19<br />
Chlorine dioxide (ClO2) kg/t 0.00 0.00 - 0.00<br />
Clay kg/t 17.31 16.39 - 19.69<br />
CO 2 kg/t 0.50 0.20 - 0.40<br />
Dry strength agent kg/t 0.00 0.00 - 0.00<br />
Hydrogen peroxide (H 2O 2) kg/t 1.13 3.73 - 2.87<br />
Oxygen, O 2 kg/t 0.00 2.72 - 1.62<br />
Sodium bisulfite (NaHSO 3) kg/t 0.00 1.71 - 1.02<br />
Sodium Chlorate (NaClO 3) kg/t 0.003 4.58 - 2.73<br />
Sodium Hydroxide (NaOH) kg/t 0.61 9.51 - 6.02<br />
Sodium sulphate (Na 2SO 4) kg/t 0.53 0.00 - 0.30<br />
Starch, corn/maize kg/t 1.89 4.17 - 3.57<br />
Starch, potato kg/t 0.67 1.29 - 1.15<br />
Starch, wheat kg/t 3.24 10.80 - 8.30<br />
Starch, other kg/t 0.00 3.25 - 1.94<br />
Starch, modified kg/t 3.75 3.58 - 4.28<br />
Sulphuric acid (H 2SO 4) kg/t 0.00 7.14 - 4.26<br />
Synthetic binders (latex) kg/t 12.90 14.20 - 15.85<br />
Wet strength agent kg/t 0.000 0.016 - 0.010<br />
Adhesives <strong>for</strong> laminating kg/t - - 1.20 1.20<br />
Aluminium printing plates kg/t - - 1.55 1.55<br />
Glue, cold <strong>for</strong> boxmaking kg/t - - 1.68 1.68<br />
Glue, hot melts <strong>for</strong> boxmaking kg/t - - 1.62 1.62<br />
Ink, flexo kg/t - - 0.21 0.21<br />
Ink, gravure kg/t - - 0.97 0.97<br />
Ink, offset kg/t - - 3.05 3.06<br />
Laminating films kg/t - - 0.27 0.27<br />
Varnish <strong>for</strong> printing kg/t - - 8.54 8.54<br />
© RISE Research Institutes of Sweden
Recycled<br />
<strong><strong>carton</strong>board</strong><br />
Virgin<br />
<strong><strong>carton</strong>board</strong><br />
Carton<br />
conversion<br />
Aggregated<br />
average board<br />
<strong>production</strong> <strong>and</strong><br />
cartton<br />
conversion<br />
38<br />
PRODUCT &<br />
REFERENCE<br />
FLOW<br />
tonne net<br />
saleable product<br />
1 1 1 1<br />
TRANSPORT OF RAW MATERIALS<br />
Wood <strong>and</strong> wood chips<br />
Wood with truck t.km/t 10 178 - 111<br />
Wood with rail t.km/t 8 119 - 74<br />
Wood with ship t.km/t 0 16 - 9<br />
Wood with barge t.km/t 0 71 - 42<br />
Recovered paper<br />
Recovered paper with truck t.km/t 211 2 - 121<br />
Recovered paper with rail t.km/t 0 0 - 0<br />
Recovered paper with ship t.km/t 0 0 - 0<br />
Recovered paper with barge t.km/t 0 0 - 0<br />
Purchased pulp<br />
Purchased pulp with truck t.km/t 4 65 - 40<br />
Purchased pulp with rail t.km/t 0 7 - 4<br />
Purchased pulp with ship t.km/t 2 158 - 94<br />
Purchased pulp with barge t.km/t 0 3 - 2<br />
Non-fibre inputs to<br />
papermills<br />
Non-fibre inputs with truck t.km/t 29 77 - 62<br />
Non-fibre inputs with rail t.km/t 28 498 - 310<br />
Non-fibre inputs with ship t.km/t 0 1,005 - 594<br />
Non-fibre inputs with barge t.km/t 0 6 - 4<br />
Cartonboard to converting<br />
plants*<br />
Cartonboard with truck t.km/t - - 886 886<br />
Cartonboard with rail t.km/t - - 45 45<br />
© RISE Research Institutes of Sweden
Recycled<br />
<strong><strong>carton</strong>board</strong><br />
Virgin<br />
<strong><strong>carton</strong>board</strong><br />
Carton<br />
conversion<br />
Aggregated<br />
average board<br />
<strong>production</strong> <strong>and</strong><br />
cartton<br />
conversion<br />
39<br />
PRODUCT &<br />
REFERENCE FLOW<br />
tonne net<br />
saleable<br />
product<br />
1 1 1 1<br />
EMISSIONS TO AIR<br />
Particulates, 2.5µm <strong>and</strong> kg/t 0.00076 0.0211 - 0.0130<br />
10µm kg/t 0.0040 0.0102 - 0.0084<br />
CO 2 (fossil) kg/t 354.5 177.4 16.9 325.7<br />
CO 2 (biomass) kg/t 2.4 728.8 0.0 435.9<br />
CO kg/t 0.047 0.000 - 0.027<br />
NOx (as NO 2) kg/t 0.199 0.584 - 0.462<br />
SOx (as SO 2) kg/t 0.118 0.135 - 0.148<br />
TRS (H 2S as S) kg/t n/a n/a - n/a<br />
© RISE Research Institutes of Sweden
Recycled<br />
<strong><strong>carton</strong>board</strong><br />
Virgin<br />
<strong><strong>carton</strong>board</strong><br />
Carton<br />
conversion<br />
Aggregated<br />
average board<br />
<strong>production</strong> <strong>and</strong><br />
cartton<br />
conversion<br />
40<br />
PRODUCT &<br />
REFERENCE FLOW<br />
tonne net<br />
saleable<br />
product<br />
1 1 1 1<br />
EMISSIONS TO WATER<br />
Water output m 3 /t<br />
Process water directly to offsite<br />
m 3 /t 0.95 0.00 0.22 0.77<br />
(third party) wastewater<br />
treatment<br />
Process water to third party m 3 /t 1.66 0.00 0.01 0.96<br />
wastewater treatment after<br />
internal waste water treatment<br />
Process water to m 3 /t 3.41 8.88 0.01 7.25<br />
freshwater/transitional waters<br />
after internal treatment<br />
Process water to coastal, sea or m 3 /t 0.00 12.15 0.00 7.24<br />
ocean after internal treatment<br />
Thermally polluted water to m 3 /t 2.44 11.44 0.00 8.22<br />
freshwater/transitional waters<br />
Thermally polluted water to m 3 /t 0.00 4.13 0.00 2.46<br />
coastal, sea or ocean<br />
Total water out m 3 /t 8.46 38.63 0.24 28.12<br />
Water balance (water in m 3 /t 1.26 1.52 0.004 1.63<br />
minus water out<br />
Waterborne emissions (to<br />
freshwater)<br />
AOX kg/t 0.0003 0.0047 n/a 0.0030<br />
BOD5 kg/t 0.011 0.146 7.12e-6 0.093<br />
COD kg/t 0.347 2.306 0.134 1.708<br />
Suspended solids kg/t 0.040 0.204 0.019 0.164<br />
Total Nitrogen kg/t 0.016 0.040 0.057 0.090<br />
Total Phosphorous kg/t 0.0016 0.0031 n/a 0.0028<br />
Waterborne emissions (to<br />
seawater)<br />
AOX kg/t 0.000 0.012 0.000 0.007<br />
BOD5 kg/t 0.000 1.157 0.000 0.690<br />
COD kg/t 0.000 4.501 0.000 2.683<br />
Suspended solids kg/t 0.000 0.894 0.000 0.533<br />
Total Nitrogen kg/t 0.000 0.052 0.000 0.031<br />
Total Phosphorous kg/t 0.000 1.275 0.000 0.760<br />
© RISE Research Institutes of Sweden
Recycled<br />
<strong><strong>carton</strong>board</strong><br />
Virgin<br />
<strong><strong>carton</strong>board</strong><br />
Carton<br />
conversion<br />
Aggregated<br />
average board<br />
<strong>production</strong> <strong>and</strong><br />
cartton<br />
conversion<br />
41<br />
PRODUCT & REFERENCE<br />
FLOW<br />
tonne net<br />
saleable<br />
product<br />
wet weight<br />
1 1 1 1<br />
RESIDUES<br />
Calcium carbonate kg/t 0.00 2.26 - 1.35<br />
Dry content % - 81% - 81%<br />
Method of disposal or<br />
100%<br />
l<strong>and</strong>spreading<br />
recovery<br />
Green liquor dregs kg/t 0.00 3.04 - 1.81<br />
Dry content % - 52% - 52%<br />
Method of disposal or<br />
recovery<br />
-<br />
41% recycled<br />
(construction<br />
material), 59%<br />
ordinary<br />
l<strong>and</strong>fill<br />
Inorganic ashes (10 01 01) kg/t 0.99 8.50 - 5.63<br />
Dry content % 72% 92% - 82%<br />
Method of disposal or<br />
recovery<br />
Not specified<br />
80% recycled<br />
(construction<br />
material), 20%<br />
l<strong>and</strong>spreading<br />
Lime mud Kg/t 4.84 6.41 - 6.60<br />
Dry content % 75% 22% - 48%<br />
Method of disposal or<br />
recovery<br />
-<br />
Not specified 5% recycled<br />
(construction<br />
material), 95%<br />
l<strong>and</strong>spreading<br />
Lubricants <strong>and</strong> oil Kg/t 0.04 0.44 - 0.29<br />
Dry content % - - - -<br />
100% recovery 100%<br />
Method of disposal or<br />
-<br />
/recycling recovery/<br />
recovery<br />
recycling<br />
Organic sludges (03 03 01 kg/t 46.58 29.96 - 44.54<br />
<strong>and</strong> 03 03 11)<br />
Dry content % 58% 46% - 52%<br />
16% recycled<br />
Method of disposal or<br />
-<br />
<strong>for</strong> corrugated<br />
recovery<br />
<strong>and</strong> tissue<br />
70% reused/<br />
recycled as an<br />
input into the<br />
cement/ tile/<br />
brick industry,<br />
30%<br />
incineration<br />
with energy<br />
recovery<br />
manufacture;<br />
19% recycled<br />
(construction<br />
material); 9%<br />
recycled<br />
(animal<br />
bedding); 27%<br />
l<strong>and</strong>spreading<br />
; 12%<br />
composting;<br />
17%<br />
incineration<br />
with energy<br />
recovery<br />
Rejects, paper related** kg/t 22.46 0.58 - 13.20<br />
Dry content % 45% 50% - 48%<br />
© RISE Research Institutes of Sweden
42<br />
Method of disposal or<br />
recovery<br />
99%<br />
incinerated<br />
with energy<br />
recovery, 1%<br />
recycled<br />
100%<br />
incinerated<br />
with energy<br />
recovery<br />
Rejects, other*** kg/t 44.91 1.14 - 26.40<br />
Dry content % 45% 50% - 48%<br />
99%<br />
100%<br />
Method of disposal or<br />
-<br />
incinerated incinerated<br />
recovery<br />
with energy with energy<br />
recovery, 1%<br />
recycled<br />
recovery<br />
Aqueous liquid waste kg/t - - 0.59 0.59<br />
containing ink<br />
Dry content % - - n/a<br />
Not specified<br />
Method of disposal or<br />
recovery<br />
Aqueous sludges<br />
kg/t - - 3.02 3.02<br />
containing ink<br />
Dry content % - - n/a<br />
Not specified<br />
Method of disposal or<br />
recovery<br />
Paper <strong>for</strong> recycling kg/t - - 169 169<br />
Dry content % - - 90% 90%<br />
100%<br />
100%<br />
Method of disposal or<br />
-<br />
recycling recycling<br />
recovery<br />
Paper packaging waste kg/t - - 2.06 2.06<br />
Dry content % - - n/a<br />
100%<br />
Method of disposal or<br />
- -<br />
recycling<br />
recovery<br />
Plastic packaging waste kg/t - - 3.29 3.29<br />
Dry content % - - n/a<br />
100%<br />
Method of disposal or<br />
- -<br />
recycling<br />
recovery<br />
«na» not available<br />
*As this life cycle inventory is intended to be representative of average <strong>European</strong> <strong>production</strong>, only transport<br />
from <strong>European</strong> paper mills to <strong>European</strong> <strong>carton</strong> converting sites has been considered in the weighted average.<br />
Transport associated with export of paper outside of Europe has not been considered<br />
**Rejected materials that were associated with the previous use of the paper (<strong>for</strong> example, staples, paper<br />
clips, tags, adhesive labels, unrecovered fibres, etc)<br />
***Material that is not in any way associated with the previous use of the paper (<strong>for</strong> example, <strong>for</strong>eign items<br />
such as plastic packaging, glass, s<strong>and</strong> <strong>and</strong> grit, etc)<br />
-<br />
Additional in<strong>for</strong>mation on energy <strong>and</strong> fuels<br />
Internal fuels<br />
The energy inputs presented in the life cycle inventories in Table 2 only to external fuels<br />
supplied to the process. However, many papermills also produce their own internal fuels<br />
as a by-product of the pulping processes or from the management of waste streams. In<br />
particular, the following are the main internal fuels relevant to the papermaking process:<br />
• Black liquor – a by-product from chemical pulping processes when<br />
digesting pulpwood into paper pulp. It is an aqueous solution of lignin residues,<br />
hemicellulose, <strong>and</strong> the inorganic chemicals used in the process<br />
© RISE Research Institutes of Sweden
Recycled<br />
<strong><strong>carton</strong>board</strong><br />
Virgin<br />
<strong><strong>carton</strong>board</strong><br />
43<br />
• Bark – from the debarking process<br />
• Biogas <strong>and</strong> bio-sludge – from the wastewater treatment process<br />
• Refuse-derived fuel – from the rejects associated with processing of paper <strong>for</strong> recycling<br />
The consumption of all fuels <strong>and</strong> energy (purchased fuels <strong>and</strong> electricity <strong>and</strong> internal<br />
fuels) <strong>for</strong> <strong>production</strong> of <strong><strong>carton</strong>board</strong> is summarised in Table 3. This data is <strong>for</strong><br />
in<strong>for</strong>mation purposes only <strong>and</strong> should not be added to the life cycle inventory <strong>for</strong> each<br />
paper grade as it refers to fuels that are generated <strong>and</strong> consumed within the “black box”<br />
of the papermill. The internal fuels will be used <strong>for</strong> <strong>production</strong> of heat (in the <strong>for</strong>m of<br />
steam) <strong>and</strong> electricity at the mill.<br />
Table 3 External energy inputs <strong>and</strong> internal fuels consumed <strong>for</strong> the <strong>production</strong> of<br />
<strong><strong>carton</strong>board</strong><br />
EXTERNAL ENERGY INPUTS<br />
Steam GJ/t 0.000 0.000<br />
Bought electricity GJ/t 0.609 2.255<br />
External fuels – fossil GJ/t 5.899 3.374<br />
External fuels – renewable GJ/t 0.000 1.476<br />
Total external energy inputs GJ/t 6.508 7.105<br />
INTERNAL FUELS<br />
Black liquor GJ/t 0.000 3.730<br />
Bark <strong>and</strong> wood GJ/t 0.000 1.558<br />
Biogas <strong>and</strong> biosludge GJ/t 0.034 0.060<br />
Refuse derived fuel (RDF) GJ/t 0.000 0.000<br />
Other internal fuels GJ/t 0.000 0.073<br />
Total internal fuels GJ/t 0.034 5.421<br />
TOTAL ENERGY (BOUGHT ELECTRICITY, PURCHASED<br />
STEAM, EXTERNAL FUELS, INTERNAL FUELS)<br />
Total energy GJ/t 6.542 12.526<br />
Year-on-year trends<br />
Improvements to the questionnaires<br />
A number of improvements were made to the data collection questionnaires <strong>for</strong> the 2021<br />
compared to previous studies. These changes have resulted in more consistent <strong>and</strong><br />
reliable data provision across mills. In particular, the following changes are highlighted:<br />
• For the mills that produce <strong>and</strong> sell energy (electricity <strong>and</strong>/or heat <strong>and</strong> steam), the mill<br />
experts completing the questionnaire were asked to allocate resources <strong>and</strong> emissions<br />
between the co-products of board <strong>and</strong> energy. This approach means that, unlike previous<br />
© RISE Research Institutes of Sweden
44<br />
surveys, it is no longer necessary to calculate net energy consumption at the mills <strong>and</strong>/or<br />
provide a credit <strong>for</strong> sold energy. This approach should result in a more consistent life<br />
cycle inventory which is easier to interpret<br />
• For purchased pulp, pulp nomenclature was clarified, resulting in consistent naming of<br />
different pulp types across the survey<br />
• For non-fibre inputs, data was requested on the dry mass percentage of the input to<br />
ensure that the consumption is always considered according to the active substance. Data<br />
was also requested regarding the transport distances <strong>and</strong> modes of transport <strong>for</strong> nonfibre<br />
inputs, resulting in a more complete underst<strong>and</strong>ing of transport associated with the<br />
raw materials consumed by the paper mills<br />
• For water consumption, inputs of sea/coastal waters were requested. Similarly, releases<br />
of water to sea/estuaries were requested. This in<strong>for</strong>mation may be important as the<br />
impact assessment categories <strong>for</strong> water develop<br />
• Further detail was requested regarding the management of residues arising from the<br />
paper mills. Previous experience with life cycle data providers has shown that<br />
assumptions regarding the management of some residues streams (particularly organic<br />
sludges, lime mud, green liquor dregs <strong>and</strong> calcium carbonate) can be very influential on<br />
the results achieved when using the gate-to-gate life cycle inventories to compile cradleto-gate<br />
life cycle inventories. In particular, assumptions that these residue streams are<br />
sent to l<strong>and</strong>fill <strong>and</strong>/or incineration can contribute significantly to the impact assessment<br />
results achieved. Collecting more detailed data relating to the management of residue<br />
streams has demonstrated that in fact the vast majority of residues arising at the paper<br />
mill are reused <strong>and</strong> recycled in some way.<br />
Trends in key environmental parameters<br />
The life cycle inventory presented in Table 2 represents the average <strong>European</strong> <strong>production</strong><br />
of <strong><strong>carton</strong>board</strong> <strong>and</strong> <strong>carton</strong>s, based on the data received during from mills <strong>and</strong> plants<br />
participating in the 2021 survey. As previously explained, the coverage of the market is<br />
noticeably increased <strong>for</strong> the 2021 survey compared to the 2018 survey. Whilst this means<br />
that the life cycle inventory presented in this version of the report is more representative<br />
of the weighted <strong>European</strong> average <strong>production</strong>, it also means that care should be taken<br />
when comparing this current inventory directly with previous versions of the dataset.<br />
If mills with large <strong>production</strong> capacity join the survey or drop out of the survey, then<br />
changes in the coverage of the papermills participating in the survey can be influential<br />
on the results achieved. This should be borne in mind when comparing the results of the<br />
2021 survey <strong>and</strong> the 2018 survey.<br />
Nonetheless, it is still valuable <strong>and</strong> in<strong>for</strong>mative to look at the trends in key environmental<br />
interventions over time. In particular, if we compare the 2018 survey <strong>and</strong> the 2021<br />
survey:<br />
• For the <strong>production</strong> of virgin <strong><strong>carton</strong>board</strong>, total energy (purchased grid electricity plus<br />
external fuels plus internal fuels) required has been reduced by 14% in 2021 compared<br />
to 2018. For the <strong>production</strong> of recycled <strong><strong>carton</strong>board</strong>, total energy has stayed relatively<br />
unchanged, with a 2% decrease observed.<br />
• This improvement in energy efficiency, combined with changes in the energy mix<br />
employed, has resulted in an 18% reduction in fossil carbon dioxide emissions arising at<br />
© RISE Research Institutes of Sweden
45<br />
the mill per tonne of virgin <strong><strong>carton</strong>board</strong> <strong>and</strong> a 7% reduction in fossil carbon dioxide<br />
emissions arising at the mill per tonne of recycled <strong><strong>carton</strong>board</strong><br />
• Fossil carbon dioxide emissions from fuels consumed at converting operations have been<br />
reduced by 38% in 2021 compared to 2018.<br />
• Total water input per tonne of recycled <strong><strong>carton</strong>board</strong> is reduced by 33% from 14.43 m 3 per<br />
tonne to 9.73 m 3 per tonne.<br />
• There has been an improvement in efficiency of board use at the converting plants. In<br />
2021, 1.169 tonnes of <strong><strong>carton</strong>board</strong> were required to produce 1 tonne of <strong>carton</strong>s, compated<br />
to 1.245 tonnes of <strong><strong>carton</strong>board</strong> per tonne of <strong>carton</strong>s required in 2018.<br />
Sustainable <strong>for</strong>est management<br />
There is currently no life cycle impact assessment methodology <strong>for</strong> biodiversity impacts<br />
of <strong>for</strong>est management to produce primary fibres <strong>for</strong> fibre-based products. Nevertheless,<br />
biodiversity impacts are an essential element of <strong>for</strong>est industry products. Sustainable<br />
<strong>for</strong>est management practices have been developed to protect <strong>and</strong> maintain the ecosystem<br />
services in managed <strong>for</strong>ests <strong>and</strong> plantations. The voluntary sustainable <strong>for</strong>est<br />
management certification schemes have been designed to address relevant practices that<br />
help protect ecosystem services such as biodiversity or those that are impacted by l<strong>and</strong><br />
use <strong>and</strong> their implementation has been verified through an accredited, independent third<br />
party. These practices set a proxy <strong>for</strong> mitigating l<strong>and</strong> use impacts <strong>and</strong> protecting<br />
biodiversity.<br />
The data collection revealed that >80% of the pulp wood used <strong>for</strong> the <strong>production</strong> of<br />
<strong><strong>carton</strong>board</strong> by the companies returning the survey was certified as being sourced from<br />
sustainable managed <strong>for</strong>ests. Predominantly, primary fibres are FSC or PEFC certified.<br />
A similar proportion of the purchased pulp is also certified <strong>and</strong> third party verified as<br />
being sourced from sustainable managed <strong>for</strong>ests.<br />
Details of the specific countries of origin <strong>and</strong> species of wood used are not provided in<br />
this report. The data provided by incomplete <strong>and</strong> when reviewed it was not deemed<br />
representative of the complete situation.<br />
Conclusions<br />
This report presents the gate-to-gate life cycle inventories <strong>for</strong> the <strong>production</strong> of<br />
<strong><strong>carton</strong>board</strong>, manufactured primarily from primary fibres, the <strong>production</strong> of<br />
<strong><strong>carton</strong>board</strong> manufactured primarily from recovered fibres, the conversion of<br />
<strong><strong>carton</strong>board</strong> into blank <strong>carton</strong>s, (including die cutting, creasing, printing <strong>and</strong> where<br />
applicable folding/gluing) <strong>and</strong> an aggregated dataset, which considers the <strong>production</strong> of<br />
<strong><strong>carton</strong>board</strong> <strong>and</strong> the conversion of this <strong><strong>carton</strong>board</strong> into <strong>carton</strong>s.<br />
The datasets represent the weighted average <strong>European</strong> situation <strong>for</strong> each of the processes<br />
according to the market <strong>and</strong> technology situation in 2021. The datasets are based on<br />
primary data collected directly from the mills <strong>and</strong> convertors operating the processes.<br />
Participation in the surveys <strong>for</strong> <strong><strong>carton</strong>board</strong> <strong>production</strong> was high, with a significant<br />
increase in the number of sites participating <strong>and</strong> the proportion of <strong>European</strong> <strong>production</strong><br />
covered. Participation in the survey <strong>for</strong> <strong>carton</strong> converting was also significant, with data<br />
received from twenty-five converting sites. Although this was fewer sites compared to the<br />
© RISE Research Institutes of Sweden
46<br />
previous survey in 2018, the share of <strong>European</strong> <strong>production</strong> covered by the participating<br />
convertors represented an increase in coverage with a good geographical spread in<br />
participation. For this reason, there can be a high degree of confidence that the data is<br />
representative of technologies applied across Europe, <strong>and</strong> there<strong>for</strong>e representative of the<br />
environmental profile of the sector.<br />
© RISE Research Institutes of Sweden
47<br />
Peer review<br />
The study presented in this report has been subject to a peer review by ifeu - Institute <strong>for</strong><br />
Energy <strong>and</strong> Environmental Research Heidelberg GmbH. The peer review concludes that:<br />
• the methods used to compile the <strong>database</strong> are scientifically <strong>and</strong> technically valid,<br />
<strong>and</strong> consistently used.<br />
• the data used are appropriate <strong>and</strong> reasonable in relation to the goal of the LCA<br />
<strong>database</strong>.<br />
• the LCA <strong>database</strong> report is transparent <strong>and</strong> consistent.<br />
The full peer review statement is available as Annex 1 of this report.<br />
© RISE Research Institutes of Sweden
48<br />
Definitions<br />
Allocation - Technique used in life cycle assessment <strong>for</strong> partitioning the inputs <strong>and</strong><br />
outputs of a system amongst products.<br />
Effluent - Water leaving the mill after treatment.<br />
Incineration + energy - Incineration of residues with energy recovery.<br />
Functional additives - Additives that influence the properties of paper.<br />
Life Cycle Assessment (LCA) - Compilation <strong>and</strong> evaluation of the inputs, outputs <strong>and</strong><br />
the potential environmental impacts of a product system throughout its life cycle.<br />
Life Cycle Impact Assessment - Phase of the life cycle assessment aimed at<br />
underst<strong>and</strong>ing <strong>and</strong> evaluating the magnitude <strong>and</strong> significance of the potential<br />
environmental impacts of a product system.<br />
Life Cycle Inventory Analysis - Phase of the life cycle assessment involving<br />
compilation, <strong>and</strong> the quantification of inputs <strong>and</strong> outputs, <strong>for</strong> a given product system<br />
throughout its life cycle.<br />
Packaging materials - Materials bought <strong>and</strong> used <strong>for</strong> the packaging of the saleable<br />
product (wrappings, pallets).<br />
Paper <strong>for</strong> recycling – paper collected <strong>for</strong> repulping at a papermill to produce papers<br />
containing recycled fibres. Paper <strong>for</strong> recycling may originate from pre-consumer sources<br />
(e.g., process waste) or post-consumer sources<br />
Primary Fibre - Virgin fibre, fibres that have not been recycled be<strong>for</strong>e use in paper<br />
<strong>production</strong>.<br />
Process additives - Additives that are used to guarantee that the process of paper<br />
<strong>production</strong> runs smoothly or to increase the <strong>production</strong>.<br />
Rejects - Material in recovered paper, which is eliminated during pulp preparation.<br />
Recovered fibres / secondary fibres – fibres produced from recycled paper ready<br />
<strong>for</strong> use in paper <strong>production</strong><br />
Tonne nsp (net saleable product) - 1 tonne of <strong><strong>carton</strong>board</strong>/<strong>carton</strong>s sold to the<br />
customer.<br />
Transport distance of recovered paper - Distance from recovered paper supplier<br />
to the paper mill.<br />
Transport distance of wood - Distance from harvesting site to the paper mill.<br />
© RISE Research Institutes of Sweden
49<br />
Annex 1: Peer review statement<br />
© RISE Research Institutes of Sweden
© RISE Research Institutes of Sweden<br />
50
© RISE Research Institutes of Sweden<br />
51
© RISE Research Institutes of Sweden<br />
52
© RISE Research Institutes of Sweden<br />
53
© RISE Research Institutes of Sweden<br />
54
© RISE Research Institutes of Sweden<br />
55
© RISE Research Institutes of Sweden<br />
56
© RISE Research Institutes of Sweden<br />
57
© RISE Research Institutes of Sweden<br />
58