- Page 1: f[n] = a[n] 0.8 0.6 0.4 0.2 0 -0.2
- Page 5: Lecturers Michael F. Cohen Microsof
- Page 8 and 9: II Multiresolution and Wavelets - L
- Page 10 and 11: V Curves and Surfaces - Leena-Maija
- Page 12 and 13: Bibliography 213 Index 225
- Page 14 and 15: 2 A. FOURNIER Computer Science of t
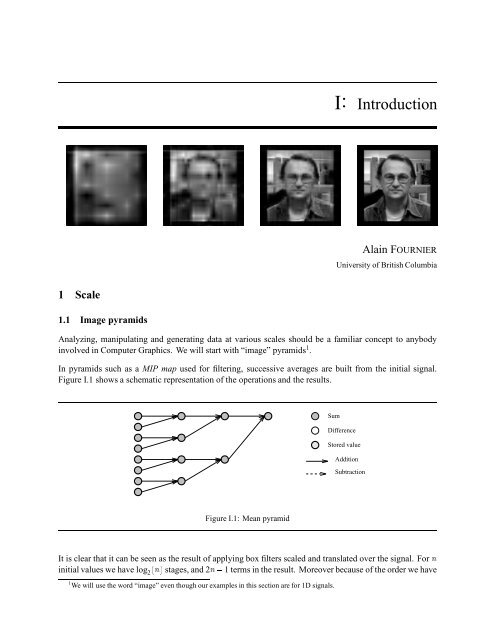
- Page 18 and 19: 6 A. FOURNIER chosen for the operat
- Page 20 and 21: 8 A. FOURNIER 3 The Walsh transform
- Page 22 and 23: 10 A. FOURNIER 4 Windowed Fourier t
- Page 24 and 25: 12 A. FOURNIER 5 Relative Frequency
- Page 26 and 27: 14 A. FOURNIER a new set of basis f
- Page 28 and 29: 16 A. FOURNIER Exercise 2: Prove eq
- Page 30 and 31: 18 A. FOURNIER This way, each i can
- Page 32 and 33: 20 A. FOURNIER 8 Multi-dimensional
- Page 34 and 35: 22 A. FOURNIER wavelets so far. Cha
- Page 36 and 37: 24 A. FOURNIER 6 5 4 3 2 1 0 -1 -2
- Page 38 and 39: 26 A. FOURNIER 4.5 5 3.5 4 2.5 3 1.
- Page 40 and 41: 28 A. FOURNIER 2 1.5 1 0.5 0 -0.5 -
- Page 42 and 43: 30 A. FOURNIER 1 0 (x) 1 1 (y) 1 0
- Page 44 and 45: 32 A. FOURNIER 30 25 20 15 10 5 0 -
- Page 46 and 47: 34 A. FOURNIER 300 250 200 150 100
- Page 48 and 49: 36 L-M. REISSELL Siggraph ’95 Cou
- Page 50 and 51: 38 L-M. REISSELL Filter conditions:
- Page 52 and 53: 40 L-M. REISSELL 1.2 Wavelet decomp
- Page 54 and 55: 42 L-M. REISSELL 1.4 From the conti
- Page 56 and 57: 44 L-M. REISSELL - f 2 Vi ! f ( ,j)
- Page 58 and 59: 46 L-M. REISSELL Under practical co
- Page 60 and 61: 48 L-M. REISSELL 2.4.1 Computing us
- Page 62 and 63: 50 L-M. REISSELL The Fourier transf
- Page 64 and 65: 52 L-M. REISSELL finite filters for
- Page 66 and 67:
54 L-M. REISSELL The last formulati
- Page 68 and 69:
56 L-M. REISSELL - m0(0) =1; m0( )=
- Page 70 and 71:
58 L-M. REISSELL The filter leads t
- Page 72 and 73:
60 L-M. REISSELL 1.5 1 0.5 0 -0.5 D
- Page 74 and 75:
62 L-M. REISSELL The last condition
- Page 76 and 77:
64 L-M. REISSELL 4.2 Approximation
- Page 78 and 79:
66 L-M. REISSELL 5.1 Orthogonalizat
- Page 80 and 81:
68 L-M. REISSELL This choice has th
- Page 82 and 83:
70 L-M. REISSELL 0.8 0.6 0.4 0.2 0
- Page 84 and 85:
72 WIM SWELDENS, PETER SCHRÖDER li
- Page 86 and 87:
74 WIM SWELDENS, PETER SCHRÖDER lo
- Page 88 and 89:
76 WIM SWELDENS, PETER SCHRÖDER Ex
- Page 90 and 91:
78 WIM SWELDENS, PETER SCHRÖDER 1.
- Page 92 and 93:
80 WIM SWELDENS, PETER SCHRÖDER 1.
- Page 94 and 95:
82 WIM SWELDENS, PETER SCHRÖDER 2.
- Page 96 and 97:
84 WIM SWELDENS, PETER SCHRÖDER 5.
- Page 98 and 99:
86 WIM SWELDENS, PETER SCHRÖDER We
- Page 100 and 101:
88 WIM SWELDENS, PETER SCHRÖDER 0.
- Page 102 and 103:
90 WIM SWELDENS, PETER SCHRÖDER Pj
- Page 104 and 105:
92 WIM SWELDENS, PETER SCHRÖDER sc
- Page 106 and 107:
94 WIM SWELDENS, PETER SCHRÖDER Th
- Page 108 and 109:
96 WIM SWELDENS, PETER SCHRÖDER P
- Page 110 and 111:
98 WIM SWELDENS, PETER SCHRÖDER 7.
- Page 112 and 113:
100 WIM SWELDENS, PETER SCHRÖDER F
- Page 114 and 115:
102 WIM SWELDENS, PETER SCHRÖDER 1
- Page 116 and 117:
104 WIM SWELDENS, PETER SCHRÖDER r
- Page 118 and 119:
106 WIM SWELDENS, PETER SCHRÖDER S
- Page 120 and 121:
108 W. SWELDENS 1. save storage, 2.
- Page 122 and 123:
110 W. SWELDENS bases by allowing d
- Page 124 and 125:
112 W. SWELDENS Frequency 0.015 0.0
- Page 126 and 127:
114 W. SWELDENS f( x, y) fLL ( x, y
- Page 128 and 129:
116 W. SWELDENS PSNR (dB) 42 40 38
- Page 130 and 131:
118 W. SWELDENS Encoder Decoder fi
- Page 132 and 133:
120 W. SWELDENS probing. The idea i
- Page 134 and 135:
122 W. SWELDENS filename descriptio
- Page 136 and 137:
124 L-M. REISSELL, T.DEROSE &MICHAE
- Page 138 and 139:
126 L-M. REISSELL, T.DEROSE &MICHAE
- Page 140 and 141:
128 L-M. REISSELL, T.DEROSE &MICHAE
- Page 142 and 143:
130 L-M. REISSELL, T.DEROSE &MICHAE
- Page 144 and 145:
132 L-M. REISSELL, T.DEROSE &MICHAE
- Page 146 and 147:
134 L-M. REISSELL, T.DEROSE &MICHAE
- Page 148 and 149:
136 L-M. REISSELL, T.DEROSE &MICHAE
- Page 150 and 151:
138 L-M. REISSELL, T.DEROSE &MICHAE
- Page 152 and 153:
140 L-M. REISSELL, T.DEROSE &MICHAE
- Page 154 and 155:
142 L-M. REISSELL, T.DEROSE &MICHAE
- Page 156 and 157:
144 L-M. REISSELL, T.DEROSE &MICHAE
- Page 158 and 159:
146 L-M. REISSELL, T.DEROSE &MICHAE
- Page 160 and 161:
148 L-M. REISSELL, T.DEROSE &MICHAE
- Page 162 and 163:
150 L-M. REISSELL, T.DEROSE &MICHAE
- Page 164 and 165:
152 L-M. REISSELL, T.DEROSE &MICHAE
- Page 166 and 167:
154 P. SCHRÖDER Siggraph ’95 Cou
- Page 168 and 169:
156 P. SCHRÖDER 1.1 A Note on Dime
- Page 170 and 171:
158 P. SCHRÖDER Once again we make
- Page 172 and 173:
160 P. SCHRÖDER E R I I E R E R E
- Page 174 and 175:
162 P. SCHRÖDER Haar basis (1 vani
- Page 176 and 177:
164 P. SCHRÖDER for some M>0, and
- Page 178 and 179:
166 P. SCHRÖDER G'i;'i recurse G'i
- Page 180 and 181:
168 P. SCHRÖDER GR, by going to hi
- Page 182 and 183:
170 P. SCHRÖDER As mentioned earli
- Page 184 and 185:
172 P. SCHRÖDER 2. the involved el
- Page 186 and 187:
174 P. SCHRÖDER a surface will be
- Page 188 and 189:
176 P. SCHRÖDER shape of Flatlets
- Page 190 and 191:
178 P. SCHRÖDER with discontinuity
- Page 192 and 193:
180 P. SCHRÖDER basis functions th
- Page 194 and 195:
182 M. F. COHEN, W.SWELDENS &A.FOUR
- Page 196 and 197:
184 M. F. COHEN, W.SWELDENS &A.FOUR
- Page 198 and 199:
186 M. F. COHEN, W.SWELDENS &A.FOUR
- Page 200 and 201:
188 M. F. COHEN, W.SWELDENS &A.FOUR
- Page 202 and 203:
190 M. F. COHEN, W.SWELDENS &A.FOUR
- Page 204 and 205:
192 M. F. COHEN, W.SWELDENS &A.FOUR
- Page 206 and 207:
194 M. F. COHEN, W.SWELDENS &A.FOUR
- Page 208 and 209:
196 M. F. COHEN, W.SWELDENS &A.FOUR
- Page 210 and 211:
198 M. F. COHEN, W.SWELDENS &A.FOUR
- Page 212 and 213:
200 M. F. COHEN, W.SWELDENS &A.FOUR
- Page 214 and 215:
202 M. F. COHEN, W.SWELDENS &A.FOUR
- Page 216 and 217:
204 M. F. COHEN, W.SWELDENS &A.FOUR
- Page 218 and 219:
206 M. F. COHEN, W.SWELDENS &A.FOUR
- Page 220 and 221:
208 and the correlation between lev
- Page 222 and 223:
210 Siggraph ’95 Course Notes: #2
- Page 224 and 225:
The latest edition of the popular N
- Page 226 and 227:
214 BIBLIOGRAPHY [13] BARTELS, R.H.
- Page 228 and 229:
216 BIBLIOGRAPHY [50] DAUBECHIES, I
- Page 230 and 231:
218 BIBLIOGRAPHY [85] FOURNIER, A.,
- Page 232 and 233:
220 BIBLIOGRAPHY [119] LEWIS, A.S.,
- Page 234 and 235:
222 BIBLIOGRAPHY [153] PEITGEN, H.O
- Page 236 and 237:
224 BIBLIOGRAPHY [189] VAN DE PANNE
- Page 238 and 239:
adaptive scaling coefficients, 134,