i2 Analyst's Notebook 7 Datasheet.qxd - ISS Africa -Investigation ...
i2 Analyst's Notebook 7 Datasheet.qxd - ISS Africa -Investigation ...
i2 Analyst's Notebook 7 Datasheet.qxd - ISS Africa -Investigation ...

You also want an ePaper? Increase the reach of your titles
YUMPU automatically turns print PDFs into web optimized ePapers that Google loves.
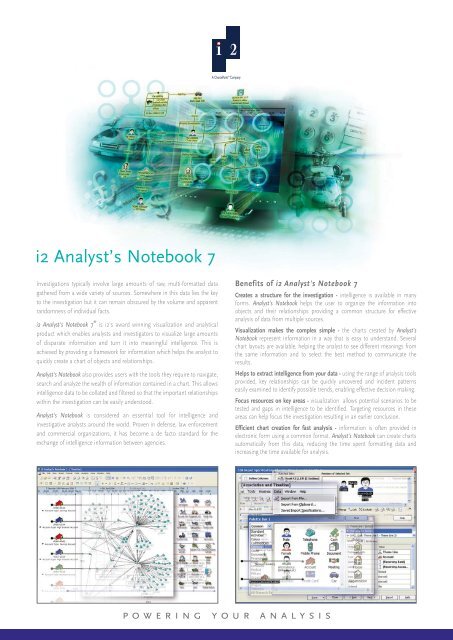
<strong>i2</strong> Analyst’s <strong>Notebook</strong> 7<br />
<strong>Investigation</strong>s typically involve large amounts of raw, multi-formatted data<br />
gathered from a wide variety of sources. Somewhere in this data lies the key<br />
to the investigation but it can remain obscured by the volume and apparent<br />
randomness of individual facts.<br />
<strong>i2</strong> <strong>Analyst's</strong> <strong>Notebook</strong> 7 ®<br />
is <strong>i2</strong>'s award winning visualization and analytical<br />
product which enables analysts and investigators to visualize large amounts<br />
of disparate information and turn it into meaningful intelligence. This is<br />
achieved by providing a framework for information which helps the analyst to<br />
quickly create a chart of objects and relationships.<br />
<strong>Analyst's</strong> <strong>Notebook</strong> also provides users with the tools they require to navigate,<br />
search and analyze the wealth of information contained in a chart. This allows<br />
intelligence data to be collated and filtered so that the important relationships<br />
within the investigation can be easily understood.<br />
<strong>Analyst's</strong> <strong>Notebook</strong> is considered an essential tool for intelligence and<br />
investigative analysts around the world. Proven in defense, law enforcement<br />
and commercial organizations, it has become a de facto standard for the<br />
exchange of intelligence information between agencies.<br />
Benefits of <strong>i2</strong> <strong>Analyst's</strong> <strong>Notebook</strong> 7<br />
Creates a structure for the investigation - intelligence is available in many<br />
forms. <strong>Analyst's</strong> <strong>Notebook</strong> helps the user to organize the information into<br />
objects and their relationships providing a common structure for effective<br />
analysis of data from multiple sources.<br />
Visualization makes the complex simple - the charts created by <strong>Analyst's</strong><br />
<strong>Notebook</strong> represent information in a way that is easy to understand. Several<br />
chart layouts are available, helping the analyst to see different meanings from<br />
the same information and to select the best method to communicate the<br />
results.<br />
Helps to extract intelligence from your data - using the range of analysis tools<br />
provided, key relationships can be quickly uncovered and incident patterns<br />
easily examined to identify possible trends, enabling effective decision making.<br />
Focus resources on key areas - visualization allows potential scenarios to be<br />
tested and gaps in intelligence to be identified. Targeting resources in these<br />
areas can help focus the investigation resulting in an earlier conclusion.<br />
Efficient chart creation for fast analysis - information is often provided in<br />
electronic form using a common format. <strong>Analyst's</strong> <strong>Notebook</strong> can create charts<br />
automatically from this data, reducing the time spent formatting data and<br />
increasing the time available for analysis.<br />
powering your analysis
Features of <strong>i2</strong> <strong>Analyst's</strong> <strong>Notebook</strong> 7<br />
Structure and Collect your data - Turning raw data into actionable intelligence<br />
is a complex and continuous challenge for analysts. <strong>Analyst's</strong> <strong>Notebook</strong><br />
provides a structure which simplifies the task of converting unstructured data<br />
into key facts. Information is grouped into Entities (e.g. people, organizations,<br />
objects) and Links ( e.g. transactions, associations, events ), matching the way<br />
that people think about real-world objects and making analysis more intuitive.<br />
Pre-defined templates are provided for common types of entities and links and<br />
their associated properties. The templates provide a framework for data entry<br />
and allow a visualization chart to be quickly created by dragging and dropping<br />
the required entities and links onto a chart.<br />
Photographs, video clips and electronic documents can also be included<br />
within the chart allowing all relevant information to be collected into one place,<br />
ensuring nothing is missed.<br />
Chart Visualization - Intelligence analysis is diverse in it's nature. The timing<br />
of a series of events may be important in one case while the relationship<br />
between people may be key in another. <strong>Analyst's</strong> <strong>Notebook</strong> provides a choice<br />
of methods to represent the intelligence available.<br />
�� Link charting - represents people, accounts, organizations and other<br />
entities - together with the relationships or transfers of commodities<br />
between them. This visually simplifies even the most complex data.<br />
�� Network charting - applies link charting techniques to large data sets,<br />
such as social networks, telephone data, financial transactions and<br />
internet traffic records. This helps to reveal connecting paths, central<br />
clusters of communication and associated groupings.<br />
�� Timeline charting - reveals how sequences of events unfold over time,<br />
revealing relationships, depicting when exchanges occur and when<br />
commodities flow between entities.<br />
<strong>i2</strong>, the <strong>i2</strong> logo and <strong>Analyst's</strong> <strong>Notebook</strong> are registered trademarks of <strong>i2</strong> Limited. iBase is a trademark of <strong>i2</strong> Limited.<br />
ChoicePoint is a registered trademark of ChoicePoint Asset Company. Copyright © <strong>i2</strong> Limited 2007. All rights reserved.<br />
Search and List Data - Information is often gathered from multiple sources:<br />
these may be entered by different people at different times. The process of<br />
creating a chart in <strong>Analyst's</strong> <strong>Notebook</strong>, gathers all relevant information into<br />
a central point where it can be assessed using the tools available within<br />
the product.<br />
Analysis tools include :-<br />
�� List Features - allowing detailed information within the chart to be<br />
displayed as a table.<br />
�� Visual Search - allows the chart to be searched for a specific type of entity<br />
or a relationship between several entities.<br />
�� Find Matching Entities - conducts an automatic search within the chart<br />
to find people or objects to identify possible duplicate entries.<br />
�� Find Path - searches the chart for indirect connections between two<br />
entities.<br />
�� Find Linked - allows all links to a specific entity to be found within<br />
the chart.<br />
�� Find Clusters - explores the chart for groups of entities which have<br />
multiple connections.<br />
The analysis tools help to highlight key relationships while ensuring that<br />
the charts created are concise and without duplication.<br />
Data Importing - Analysts need to process many different types of data, from<br />
intelligence reports to lists of telephone or bank transactions. This data can<br />
be automatically converted into a visualization chart using <strong>Analyst's</strong><br />
<strong>Notebook</strong>’s integrated data importer. An easy to use wizard guides you<br />
through the process of importing, allowing an Import Specification to be<br />
saved and used again. Any additional information can then be imported and<br />
added as it arrives, providing an up-to-date view of the available intelligence.<br />
Integration & Expansion - The features of <strong>Analyst's</strong> <strong>Notebook</strong> can be<br />
enhanced by combining it with other <strong>i2</strong> products. Options include adding a<br />
database for storage of data for use by a group of analysts (<strong>i2</strong> iBase 5), direct<br />
access to external databases, analysis of unformatted text and the tools to<br />
allow custom plug-ins to be developed.<br />
<strong>i2</strong> <strong>Analyst's</strong> <strong>Notebook</strong> provides a framework to aid the analysis of large<br />
quantities of data which contain complex relationships. The visualization and<br />
analysis tools provided ensure that key facts can be quickly found, helping to<br />
guide the investigation towards a timely and successful conclusion.<br />
To help users get the most from the software, <strong>Analyst's</strong> <strong>Notebook</strong> comes<br />
with scenario-based online documentation and online help. User training<br />
and consulting options are available to further support deployment.<br />
For information about minimum system requirements see:<br />
http://www.<strong>i2</strong>.co.uk/products/system.asp.<br />
<strong>i2</strong> Limited � The Visual Space � Capital Park � Fulbourn � Cambridge � CB21 5XH � United Kingdom � Tel: +44 (0)1223 728600 � Fax: +44 (0)1223 728601