Software Verification Examples - Computers & Engineering
Software Verification Examples - Computers & Engineering
Software Verification Examples - Computers & Engineering

You also want an ePaper? Increase the reach of your titles
YUMPU automatically turns print PDFs into web optimized ePapers that Google loves.
<strong>Software</strong> <strong>Verification</strong><br />
<strong>Examples</strong><br />
COMPUTERS &<br />
STRUCTURES<br />
INC.<br />
R
<strong>Computers</strong> and Structures, Inc.<br />
Berkeley, California, USA<br />
ETABS ®<br />
Integrated <strong>Software</strong> for<br />
Structural Analysis and Design<br />
SOFTWARE VERIFICATION EXAMPLES<br />
Version 8<br />
June 2003
Copyright<br />
The computer program ETABS and all associated documentation are proprietary<br />
and copyrighted products. Worldwide rights of ownership rest with <strong>Computers</strong><br />
and Structures, Inc. Unlicensed use of the program or reproduction of the<br />
documentation in any form, without prior written authorization from <strong>Computers</strong><br />
and Structures, Inc., is explicitly prohibited.<br />
Further information and copies of this documentation may be obtained from:<br />
<strong>Computers</strong> and Structures, Inc.<br />
1995 University Avenue<br />
Berkeley, California 94704 USA<br />
Phone: (510) 845-2177<br />
FAX: (510) 845-4096<br />
e-mail: info@csiberkeley.com (for general questions)<br />
e-mail: support@csiberkeley.com (for technical support questions)<br />
web: www.csiberkeley.com
DISCLAIMER<br />
CONSIDERABLE TIME, EFFORT AND EXPENSE HAVE GONE INTO THE<br />
DEVELOPMENT AND DOCUMENTATION OF ETABS. THE PROGRAM<br />
HAS BEEN THOROUGHLY TESTED AND USED. IN USING THE<br />
PROGRAM, HOWEVER, THE USER ACCEPTS AND UNDERSTANDS<br />
THAT NO WARRANTY IS EXPRESSED OR IMPLIED BY THE<br />
DEVELOPERS OR THE DISTRIBUTORS ON THE ACCURACY OR THE<br />
RELIABILITY OF THE PROGRAM.<br />
THE USER MUST EXPLICITLY UNDERSTAND THE ASSUMPTIONS OF<br />
THE PROGRAM AND MUST INDEPENDENTLY VERIFY THE RESULTS.
Introduction<br />
<strong>Examples</strong><br />
Contents<br />
1 Plane Frame with Beam Span Loads, Static Gravity Load<br />
Analysis<br />
2 Three-Story Plane Frame, Dynamic Response Spectrum<br />
Analysis<br />
3 Three-Story Plane Frame, Code-Specific Static Lateral<br />
Load Analysis<br />
4 Single Story Three-Dimensional Frame, Dynamic<br />
Response Spectrum Analysis<br />
5 Three-Story Three-Dimensional Braced Frame, Dynamic<br />
Response Spectrum Analysis<br />
6 Nine-Story Ten-Bay Plane Frame, Eigenvalue Analysis<br />
7 Seven-Story Plane Frame, Gravity and Lateral Loads<br />
Analysis<br />
8 Two-Story Three-Dimensional Frame, Dynamic Response<br />
Spectrum Analysis<br />
9 Two-Story Three-Dimensional Unsymmetrical Building<br />
Frame, Dynamic Response Spectrum Analysis<br />
10 Three-Story Plane Frame with ADAS Elements, Nonlinear<br />
Time History Analysis<br />
Contents i
ETABS <strong>Verification</strong> Manual Contents<br />
ii Contents<br />
11 Three-Story Plane Frame with Viscous Damper Elements,<br />
Nonlinear Time History Analysis<br />
12 Pounding of Two Planar Frames, Nonlinear Time History<br />
Analysis<br />
13 Base Isolated Two-Story 3D Frame, Nonlinear Time<br />
History Analysis<br />
14 Friction Pendulum Base-Isolated 3D Frame, Nonlinear<br />
Time History Analysis<br />
15 Wall Area Object Behavior, Static Lateral Loads Analysis
Introduction<br />
This manual presents a set of simple building systems that have been<br />
analyzed using ETABS Version 8. The examples demonstrate some of the<br />
analytical capabilities of the ETABS system. For purposes of verification,<br />
key results produced by ETABS are compared to independent sources,<br />
such as hand calculated results, theoretical or published results, or results<br />
obtained from other structural/finite element programs that are verified<br />
not using ETABS. The examples cover each type of element, static and<br />
dynamic analysis and linear and nonlinear options.<br />
For each example, this manual contains a short description of the<br />
problem; a list of significant ETABS options activated; and a comparison<br />
of key results with theoretical results or results from other computer<br />
programs. The input data file for each example is provided on the ETABS<br />
CD.<br />
Introduction 1
Plane Frame with Beam Span Loads<br />
Static Gravity Load Analysis<br />
Description<br />
Example 1<br />
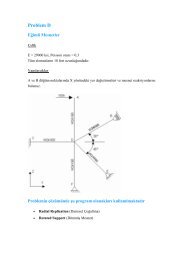
This is a one-story, two-dimensional frame subjected to vertical static loading.<br />
The frame geometry and loading patterns are shown in Figure 1-1.<br />
Significant Options of ETABS Activated<br />
� Two-dimensional frame analysis<br />
� Vertical beam span loading<br />
� No rigid joint offsets on beams and columns<br />
� Column pinned end connections<br />
Description 1 - 1
Example 1 ETABS <strong>Verification</strong> Manual<br />
Case 1<br />
Case 2<br />
10’<br />
Origin<br />
Computer Model<br />
1 - 2 Computer Model<br />
50k 100k 100k 100k 50k<br />
Eq. Eq. Eq. Eq.<br />
Figure 1-1 Plane Frame with Beam Span Loads<br />
The frame is a three-column line, two-bay system. Kip-inch-second units are<br />
used. The modulus of elasticity is 3000 ksi. All columns are 12"x24"; all beams<br />
are 12"x30".<br />
To be able to compare ETABS results with theoretical results using prismatic<br />
members and elementary beam theory, rigid joint offsets on columns and beams<br />
are not modeled, and axial and shear deformations are neglected. Thus, the<br />
automatic property generation feature of ETABS is not used; instead, the axial<br />
area and moment of inertia for each member are explicitly input.<br />
The input data file for this example is EX1.EDB. This file is available to the user<br />
on the program CD.<br />
Comparison of Results<br />
10k/ft<br />
Pinned<br />
Connection<br />
The theoretical results for bending moments and shear forces on beams B1 and<br />
B2 are easily obtained from tabulated values for propped cantilevers (American
ETABS <strong>Verification</strong> Manual Example 1<br />
Institute of Steel Construction 1989). These values for beam B1 are compared<br />
with ETABS results in Table 1-1. The results are identical.<br />
Table 1-1 Comparison of Results for Beam B1<br />
Load Case I<br />
(Concentrated Load)<br />
Quantity Location ETABS Theoretical<br />
Bending Moments<br />
Shear Forces<br />
End I 0.00 0.00<br />
¼ Point 1,687.50 1,687.50<br />
½ point 3,375.00 3,375.00<br />
¾ point -337.50 -337.50<br />
End J -4,050.00 -4,050.00<br />
End I -31.25 -31.25<br />
¼ Point -31.25 -31.25<br />
½ point 68.75 68.75<br />
¾ point 68.75 68.75<br />
End J 68.75 68.75<br />
Load Case II<br />
(Uniformly Distributed Load)<br />
Quantity Location ETABS Theoretical<br />
Bending Moments<br />
Shear Forces<br />
Reference<br />
End I 0.00 0.00<br />
¼ Point 2,430.00 2,430.00<br />
½ point 2,430.00 2,430.00<br />
¾ point 0.00 0.00<br />
End J -4,860.00 -4,860.00<br />
End I -67.50 -67.50<br />
¼ Point -22.50 -22.50<br />
½ point 22.50 22.50<br />
¾ point 67.50 67.50<br />
End J 112.50 112.50<br />
American Institute of Steel Construction 1989. Manual of Steel Construction-<br />
Allowable Stress Design. Chicago, Illinois.<br />
Reference 1 - 3
Three-Story Plane Frame<br />
Dynamic Response Spectrum Analysis<br />
Description<br />
Example 2<br />
This is a three-story plane frame subjected to the El Centro 1940 seismic response spectra,<br />
N-S component, 5 percent damping.<br />
The frame geometry is shown in Figure 2-1.<br />
Significant Options of ETABS Activated<br />
� Two-dimensional frame analysis<br />
� Rigid joint offsets on beams and columns automatically calculated<br />
� Dynamic response spectrum analysis<br />
Description 2 - 1
Example 2 ETABS <strong>Verification</strong> Manual<br />
Computer Model<br />
2 - 2 Computer Model<br />
Figure 2-1 Three-Story Plane Frame<br />
The frame is modeled as a two-column line, single bay system. Kip-inch-second<br />
units are used. Other parameters associated with the structure are as follows:<br />
All columns are W14X90<br />
All beams are infinitely rigid and 24" deep<br />
Modulus of elasticity = 29500 ksi<br />
Typical story mass = 0.4 kip-sec 2 /in<br />
The column is modeled to have infinite axial area, so that axial deformation is<br />
neglected. Also, zero column shear area is input to trigger the ETABS option of<br />
neglecting shear deformations. These deformations are neglected to be consistent<br />
with the hand-calculated model with which the results are compared.<br />
The input data file for this example is EX2.EDB. The response spectrum file is<br />
ELCN-RS1. These files are available on the CD.
ETABS <strong>Verification</strong> Manual Example 2<br />
Comparison of Results<br />
Assuming the beams to be rigid and a rigid offset at the column top ends of 24<br />
inches (i.e. equal to the depth of the beams), and neglecting both shear deformations<br />
and axial deformations, the story lateral stiffness for this example can be<br />
calculated (Przemieniecki 1968).<br />
The example then reduces to a three-spring, three-mass system with equal stiffnesses<br />
and masses. This can be analyzed using any exact method (Paz 1985) to<br />
obtain the three natural periods and mass normalized mode shapes of the system.<br />
The three theoretical natural periods and mass normalized mode shapes are compared<br />
in Table 2-1 with ETABS results. The results are identical.<br />
Table 2-1 Comparison of Results for Periods and Mode Shapes<br />
Mode Period, secs. Mode Shape ETABS Theoretical<br />
1 0.4414<br />
2 0.1575<br />
3 0.1090<br />
Roof Level 1.165 1.165<br />
2 nd Level 0.934 0.934<br />
1 st Level 0.519 0.519<br />
Roof Level 0.934 0.934<br />
2 nd Level -0.519 -0.519<br />
1 st Level -1.165 -1.165<br />
Roof Level 0.519 0.519<br />
2 nd Level -1.165 -1.165<br />
1 st Level 0.934 0.934<br />
The spectral accelerations at the three natural periods can then be linearly interpolated<br />
from the response spectrum used.<br />
The spectral accelerations can in turn be used with the mode shapes and story<br />
mass information to obtain the modal responses (Paz 1985). The modal responses<br />
for story displacements and column moments can then be combined using<br />
the complete quadratic combination procedure (Wilson, et al. 1981).<br />
The story displacements and column moments thus obtained are compared in Table<br />
2-2 with ETABS results. The results are identical.<br />
Comparison of Results 2 - 3
Example 2 ETABS <strong>Verification</strong> Manual<br />
Table 2-2 Comparison of Displacements and Column Moments<br />
Displacement at<br />
2 - 4 References<br />
Quantity ETABS Theoretical<br />
Roof 2.139 2.139<br />
2 nd 1.716 1.716<br />
1 st 0.955 0.955<br />
Moment, Column C1, at Base 11,730 11,730<br />
References<br />
Paz, M. 1985. Structural Dynamics, Theory and Computations, Van Nostrand<br />
Reinhold.<br />
Przemieniecki, J.S. 1968. Theory of Matrix Structural Analysis. Mc-Graw-Hill.<br />
Wilson, E.L., A.D. Kiureghian and E.P. Bayo 1981. A Replacement for the SRSS<br />
Method in Seismic Analysis. Earthquake <strong>Engineering</strong> and Structural Dynamics,<br />
Vol. 9.
Three-Story Plane Frame, Code-Specified<br />
Static Lateral Load Analysis<br />
Description<br />
Example 3<br />
This is a three-story plane frame subjected to the following three code-specified<br />
lateral load cases:<br />
� UBC 1997 specified seismic loads (International Conference of Building<br />
Officials 1997)<br />
� IBC 2000 specified seismic loads (International Code Council, Inc. 2000)<br />
� UBC 1997 specified wind loads (International Conference of Building Officials<br />
1997)<br />
The frame geometry is shown in Figure 3-1.<br />
Significant Options of ETABS Activated<br />
� Two-dimensional frame analysis<br />
Description 3 - 1
Example 3 ETABS <strong>Verification</strong> Manual<br />
3 - 2 Computer Model<br />
Figure 3-1 Three-Story Plane Frame<br />
� Section properties automatically recovered from AISC database<br />
� Automatic generation of UBC 1997 seismic loads<br />
� Automatic generation of IBC 2000 seismic loads<br />
� Automatic generation of UBC 1997 wind loads<br />
Computer Model<br />
The frame is modeled as a two-column line, single bay system. Kip-inch-second units<br />
are used. Other parameters associated with the structure are as follows:<br />
All columns are W14X90<br />
All beams are infinitely rigid and 24" deep<br />
Modulus of elasticity = 29500 ksi<br />
Poisson's ratio = 0.3<br />
Typical story mass = 0.4 kip-sec 2 /in<br />
The input data file for this example is EX3.EDB. This file is available on the<br />
CD.
ETABS <strong>Verification</strong> Manual Example 3<br />
For the UBC97 seismic load analysis, the code parameters associated with the<br />
analysis are as follows:<br />
UBC Seismic zone factor, Z = 0.40<br />
UBC Soil Profile Type = SC<br />
UBC Importance factor, I = 1.25<br />
UBC Overstrength Factor = 8.5<br />
UBC coefficient Ct<br />
= 0.035<br />
UBC Seismic Source Type = B<br />
Distance to Source = 15 km<br />
For the IBC2000 seismic load analysis, the code parameters associated with the<br />
analysis are as follows:<br />
IBC Site Class = C<br />
IBC Response Accel, Ss<br />
= 1<br />
IBC Response Accel, S1<br />
= 0.4<br />
IBC Response Modification, R = 8<br />
IBC Coefficient Ct<br />
= 0.035<br />
IBC Seismic Group = I<br />
For the UBC97 wind load analysis, the exposure and code parameters associated<br />
with the analysis are as follows:<br />
Width of structure supported by frame = 20 ft<br />
UBC Basic wind speed = 100 mph<br />
UBC Exposure type = B<br />
UBC Importance factor, I = 1<br />
UBC Windward coefficient, Cq<br />
= 0.8<br />
UBC Leeward coefficient, Cq<br />
= 0.5<br />
Comparison of Results<br />
For each of the static lateral load analyses, the story shears can be computed using<br />
the formulae given in the applicable references. For the seismic loads, the<br />
fundamental period computed by ETABS can be used in the formulae. From<br />
ETABS results, this fundamental period is 0.5204 second. (Note the difference<br />
between the calculated fundamental period for this example and Example 2,<br />
which neglects shear and axial deformations.)<br />
Hand-calculated story shears are compared with story shears produced by the<br />
ETABS program in Table 3-1 for UBC seismic loads, Table 3-2 for IBC seismic<br />
loads and Table 3-3 for UBC wind loads. The values are identical.<br />
Comparison of Results 3 - 3
Example 3 ETABS <strong>Verification</strong> Manual<br />
Table 3-1 Comparison of Results for Story Shears-UBC 1997 Seismic<br />
3 - 4 References<br />
Level ETABS (kips) Theoretical (kips)<br />
Roof 34.09 34.09<br />
2 nd 56.82 56.82<br />
1 st 68.19 68.19<br />
Table 3-2 Comparison of Results for Story Shears-IBC 2000 Seismic<br />
Level ETABS (kips) Theoretical (kips)<br />
Roof 19.38 19.38<br />
2 nd 32.25 32.25<br />
1 st 38.64 38.64<br />
Figure 3-3 Comparison of Results for Story Shears-UBC 1997 Wind<br />
References<br />
Level ETABS (kips) Theoretical (kips)<br />
Roof 3.30 3.30<br />
2 nd 9.49 9.49<br />
1 st 15.21 15.21<br />
International Code Council, Inc. 2000. International Building Code. Falls<br />
Church, Virginia.<br />
International Conference of Building Officials 1997. Uniform Building Code.<br />
Whittier, California.
Single-Story, Three-Dimensional Frame<br />
Dynamic Response Spectrum Analysis<br />
Description<br />
Example 4<br />
This is a one-story, four-bay, three-dimensional frame. The frame is subjected to<br />
the El Centro 1940 N-S component seismic response spectrum, for 5 percent<br />
damping, in two orthogonal directions.<br />
The frame geometry is shown in Figure 4-1.<br />
Significant Options of ETABS Activated<br />
� Three-dimensional frame analysis<br />
� Automatic story mass calculation<br />
� Dynamic response spectrum analysis<br />
Description 4 - 1
Example 4 ETABS <strong>Verification</strong> Manual<br />
Computer Model<br />
4 - 2 Computer Model<br />
Figure 4-1 Single-Story Three-Dimensional Frame<br />
The structure is modeled as a single frame with four column lines and four bays.<br />
Kip-inch-second units are used. Other parameters associated with the structure are as<br />
follows:<br />
Columns on lines C1 and C2: 24" x 24"<br />
Columns on lines C3 and C4: 18" x 18"<br />
All beams infinitely rigid and 36" deep<br />
Modulus of elasticity = 3000 ksi<br />
Story weight = 150 psf<br />
The columns are modeled to neglect shear and axial deformations to be consistent<br />
with the assumptions of hand calculations with which the results are compared.<br />
The input data file for this example is EX4.EDB and is available on the program<br />
CD.
ETABS <strong>Verification</strong> Manual Example 4<br />
Comparison of Results<br />
The example is a three-degree-of-freedom system. From the individual column<br />
lateral stiffnesses, assuming rigid beams and rigid offsets at column top ends<br />
equal to 36 inches (i.e., the depth of the beams) and neglecting both shear deformations<br />
and column axial deformations, the structural stiffness matrix can be assembled<br />
(Przemieniecki 1968).<br />
From the stiffness and mass matrices of the system, the three natural periods and<br />
mass normalized mode shapes of the system can be obtained (Paz 1985). These<br />
are compared in Table 4-1 with ETABS results. The results are identical.<br />
Table 4-1 Comparison of Results for Periods and Mode Shapes<br />
Mode Quantity ETABS Theoretical<br />
1<br />
2<br />
3<br />
References<br />
Period, sec. 0.1389 0.1389<br />
Mode Shape<br />
X-translation -1.6244 -1.6244<br />
Y-translation 0.0000 0.000<br />
Z-rotation 0.0032 0.0032<br />
Period, sec. 0.1254 0.1254<br />
Mode Shape<br />
X-translation 0.000 0.000<br />
Y-translation 1.6918 1.6918<br />
Z-rotation 0.000 0.000<br />
Period,sec. 0.0702 0.070<br />
Mode Shape<br />
X-translation 0.4728 0.4728<br />
Y-translation 0.000 0.000<br />
Z-rotation 0.0111 0.0111<br />
Paz, M 1985. Structural Dynamics, Theory and Computations. Van Nostrand<br />
Reinhold.<br />
Przemieniecki, J.S. 1968. Theory of Matrix Structural Analysis. McGraw-Hill.<br />
Comparison of Results 4 - 3
Example 5<br />
Three-Story Three-Dimensional Braced Frame<br />
Dynamic Response Spectrum Analysis<br />
Description<br />
This is an L-shaped building structure with four identical braced frames. All<br />
members (columns and braces) carry only axial loads.<br />
The structure is subject to the El Centro 1940 N-S component seismic response<br />
spectrum in the X-direction. The structural damping is 5 percent. The geometry<br />
of the structure and a typical frame are shown in Figure 5-1.<br />
Significant Options of ETABS Activated<br />
� Three-dimensional structure analysis using planar frames<br />
� Brace (diagonal) and column members with no bending stiffness<br />
� Dynamic response spectrum analysis<br />
Description 5 - 1
Example 5 ETABS <strong>Verification</strong> Manual<br />
D1 D1<br />
Figure 5-1 Three-Story, Three-Dimensional Braced Frame Building<br />
5 - 2 Significant Options of ETABS Activated<br />
D1 D1<br />
D1 D1<br />
D2 D2<br />
D2 D2<br />
D2 D2<br />
D3 D3<br />
D3 D3<br />
D3 D3<br />
D4 D4<br />
D4 D4<br />
D4 D4
ETABS <strong>Verification</strong> Manual Example 5<br />
Computer Model<br />
The structure is modeled by appropriately placing four identical planar frames.<br />
Each frame is modeled using three column lines. Kip-inch-second units are used.<br />
The modulus of elasticity is taken as 29500 ksi and the typical member axial area<br />
as 6 in 2 . A story mass of 1.242 kip-sec 2 /in and a mass moment of inertia of<br />
174907.4 kip-sec 2 -in are used.<br />
The input data file is EX5.EDB, and is available on the CD.<br />
Comparison of Results<br />
This example has been solved in Wilson and Habibullah (1992) and Peterson<br />
(1981). A comparison of ETABS results for natural periods and key member<br />
forces for one frame with these references is given in Table 5-1. The agreement<br />
is excellent.<br />
Table 5-1 Comparison of Results<br />
Quantity ETABS<br />
Wilson and<br />
Habibullah Peterson<br />
Period, Mode 1 0.32686 0.32689 0.32689<br />
Period, Mode 2 0.32061 0.32064 0.32064<br />
Axial Force<br />
Column C1, Story 1<br />
Axial Force<br />
Brace D1, Story 1<br />
Axial Force<br />
Brace D3, Story 1<br />
References<br />
279.39 279.47 279.48<br />
194.44 194.51 194.50<br />
120.49 120.53 120.52<br />
Peterson, F.E. 1981. EASE2, Elastic Analysis for Structural <strong>Engineering</strong> - Example<br />
Problem Manual. <strong>Engineering</strong> Analysis Corporation. Berkeley,<br />
California.<br />
Wilson, E.L. and A. Habibullah 1992. SAP90, Sample Example and <strong>Verification</strong><br />
Manual. <strong>Computers</strong> and Structures, Inc. Berkeley, California.<br />
Computer Model 5 - 3
Nine-Story, Ten-Bay Plane Frame<br />
Eigenvalue Analysis<br />
Description<br />
This is a nine-story, ten-bay plane frame, as shown in Figure 6-1.<br />
An eigenvalue analysis is made.<br />
Significant Options of ETABS Activated<br />
� Two-dimensional frame analysis<br />
� Eigenvalue analysis<br />
Computer Model<br />
Example 6<br />
The frame is modeled with eleven column lines and ten bays. Kip-ft-second units<br />
are used.<br />
Description 6 - 1
Example 6 ETABS <strong>Verification</strong> Manual<br />
6 - 2 Comparison of Results<br />
Figure 6-1 Nine-Story, Ten-Bay Plane Frame<br />
A modulus of elasticity of 432000 ksf is used. A typical member axial area of<br />
3ft 2 and moment of inertia of 1ft 4 are used. A mass of 3kip-sec 2 /ft/ft of member<br />
length is converted to story mass using tributary lengths and used for the analysis.<br />
The input data filename for this example is EX6.EDB. This file is available on<br />
the CD.<br />
Comparison of Results<br />
This example is also analyzed in Wilson and Habibullah (1992) and Bathe and<br />
Wilson (1972). There are two differences between the ETABS analysis and the<br />
analyses of the references. The models of the references assign vertical and horizontal<br />
mass degrees of freedom to each joint in the structure. However, the<br />
ETABS model only assigns horizontal masses and additionally, only one horizontal<br />
mass is assigned for all the joints associated with any one floor level.
ETABS <strong>Verification</strong> Manual Example 6<br />
The eigenvalues obtained from ETABS are compared in Table 6-1 with results<br />
from Wilson and Habibullah (1992) and Bathe and Wilson (1972). Considering<br />
the differences in modeling enumerated herein, the comparison is excellent.<br />
Table 6-1 Comparison of Results for Eigenvalues<br />
Quantity ETABS<br />
References<br />
Wilson and<br />
Habibullah<br />
Bathe and<br />
Wilson<br />
1 0.58964 0.58954 0.58954<br />
2 5.53195 5.52696 5.52695<br />
3 16.5962 16.5879 16.5878<br />
Bathe, K.J. and E.L. Wilson 1972. Large Eigenvalue Problems in Dynamic<br />
Analysis. Journal of the Eng. Mech. Div. ASCE. Vol. 98, No. EM6,<br />
Proc. Paper 9433. December.<br />
Wilson, E.L. and A. Habibullah 1992. SAP90, Sample Example and <strong>Verification</strong><br />
Manual, <strong>Computers</strong> and Structures, Inc. Berkeley, California.<br />
References 6 - 3
Example 7<br />
Seven-Story Plane Frame, Gravity and Lateral<br />
Loads Analysis<br />
Description<br />
This is a seven-story plane frame. The gravity loads and the geometry of the<br />
frame are shown in Figure 7-1.<br />
The frame is subjected to the following lateral loads:<br />
� Static lateral loads, shown in Figure 7-1<br />
� Lateral loads resulting from the El Centro 1940 N-S component seismic response<br />
spectra, 5 percent damping<br />
� Lateral loads resulting from the El Centro 1940 N-S component acceleration<br />
time history<br />
Description 7 - 1
Example 7 ETABS <strong>Verification</strong> Manual<br />
7 - 2 Description<br />
Vertical Loading,<br />
typical for all<br />
levels<br />
Global Reference Point<br />
All All columns columns are are W14s<br />
W14s<br />
All All beams beams are are W24s<br />
W24s<br />
Member Member weights weights are are indicated<br />
indicated<br />
Typical Typical story story mass mass = = 0.49 0.49 kip-sec kip-sec 2 2/in<br />
/in<br />
Figure 7-1 Seven-Story Plane Frame
ETABS <strong>Verification</strong> Manual Example 7<br />
Significant Options of ETABS Activated<br />
� Two-dimensional frame analysis<br />
� User-specified section properties<br />
� User-specified lateral loads<br />
� Dynamic response spectrum analysis<br />
� Dynamic time history analysis<br />
Computer Model<br />
The frame is modeled with three column lines and two bays. Kip-inch-second<br />
units are used. Because the wide flange members used in the frame are older sections,<br />
their properties are not available in the AISC section property database included<br />
with the ETABS program, and the required properties therefore need to be<br />
explicitly provided in the input data.<br />
The input data file is EX7.EDB. The input history is ELCN-THU. Time history<br />
results are obtained for the first eight seconds of the excitation. This is consistent<br />
with DYNAMIC/EASE2, with which the results are compared.<br />
Comparison of Results<br />
The example frame is analyzed in Wilson and Habibullah (1992) for gravity<br />
loads, static lateral loads and dynamic response spectrum loads. DY-<br />
NAMIC/EASE2 analyzes the example frame under static lateral loads and dynamic<br />
response spectrum and time history loads. A comparison of key ETABS<br />
results with Wilson and Habibullah (1992) and DYNAMIC/EASE2 results is<br />
presented in Tables 7-1, 7-2, 7-3 and 7-4. Note the difference in modal combination<br />
techniques between ETABS and Wilson and Habibullah, which uses complete<br />
quadratic combination (CQC), and DYNAMIC/EASE2, which uses square<br />
root of the sum of the squares combination (SRSS). The comparison of the results<br />
for all three analyses is excellent.<br />
Significant Options of ETABS Activated 7 - 3
Example 7 ETABS <strong>Verification</strong> Manual<br />
Table 7-1 Comparison of Results for Static Lateral Loads<br />
Quantity ETABS<br />
Wilson and<br />
Habibullah DYNAMIC/EASE2<br />
Lateral Displacement<br />
at Roof<br />
1.4508 1.4508 1.4508<br />
Axial Force<br />
Column C1, at ground<br />
Moment<br />
Column C1, at ground<br />
7 - 4 Comparison of Results<br />
69.99 69.99 69.99<br />
2324.68 2324.68 2324.68<br />
Table 7-2 Comparison of Results for Periods of Vibration<br />
Mode ETABS<br />
Wilson and<br />
Habibullah DYNAMIC/EASE2<br />
1 1.27321 1.27321 1.27321<br />
2 0.43128 0.43128 0.43128<br />
3 0.24204 0.24204 0.24204<br />
4 0.16018 0.16018 0.16018<br />
5 0.11899 0.11899 0.11899<br />
6 0.09506 0.09506 0.09506<br />
7 0.07951 0.07951 0.07951<br />
Table 7-3 Comparison of Results for Response Spectrum Analysis<br />
Quantity<br />
Lateral Displacement<br />
at Roof<br />
Axial Force<br />
Column C1 at ground<br />
Moment<br />
Column C1 at ground<br />
ETABS<br />
CQC<br />
Combination<br />
Wilson and<br />
Habibullah<br />
CQC<br />
Combination<br />
DYNAMIC/EASE2<br />
SRSS<br />
Combination<br />
5.4314 5.4314 5.4378<br />
261.52 261.50 261.76<br />
9916.12 9916.11 9868.25
ETABS <strong>Verification</strong> Manual Example 7<br />
Table 7-4 Comparison of Results for Time History Analysis<br />
Quantity ETABS<br />
Wilson and<br />
Habibullah<br />
Maximum Roof Displacement 5.49 5.48<br />
Maximum Base Shear 285 284<br />
Maximum Axial Force, Column C1 at ground 263 258<br />
Maximum Moment, Column C1 at ground 9104 8740<br />
References<br />
DYNAMIC/EASE2. Static and Dynamic Analysis of Multistory Frame Structures<br />
Using. DYNAMIC/EASE2, <strong>Engineering</strong> Analysis Corporation and<br />
<strong>Computers</strong> and Structures, Inc. Berkeley, California.<br />
Wilson, E.L. and A. Habibullah 1992. SAP90, Sample Example and <strong>Verification</strong><br />
Manual. <strong>Computers</strong> and Structures, Inc. Berkeley, California.<br />
References 7 - 5
Two-Story, Three-Dimensional Frame<br />
Dynamic Response Spectrum Analysis<br />
Description<br />
Example 8<br />
This is a two-story, three-dimensional building frame subjected to a response<br />
spectrum of constant amplitude.<br />
The geometry of the structure is shown in Figure 8-1.<br />
Significant Options of ETABS Activated<br />
� Three-dimensional frame analysis<br />
� User-specified section properties<br />
� Dynamic response spectrum analysis<br />
Description 8 - 1
Example 8 ETABS <strong>Verification</strong> Manual<br />
Z<br />
B7<br />
Y<br />
X<br />
8 - 2 Computer Model<br />
B8<br />
B9<br />
B1 B2<br />
35' 35'<br />
B5 B6<br />
B3 B4<br />
C1 C2 C3<br />
GLOBAL<br />
AND FRAME<br />
REFERENCE POINT<br />
Computer Model<br />
B10 B12<br />
B11<br />
C7 C8 C9<br />
C4 C5 C6<br />
25'<br />
25'<br />
STORY 1 CENTER OF MASS AT (38,27,13)<br />
STORY 2 CENTER OF MASS AT (38,27,26)<br />
TYPICAL STORY MASS = 6.212 kip-sec 2 /ft<br />
Figure 8-1 Two-Story Three-Dimensional Frame<br />
The three-dimensional structure is modeled as a single frame with nine column<br />
lines and twelve bays. Kip-foot-second units are used.<br />
For consistency with the models documented in other computer programs with<br />
which the ETABS results are compared (see Table 8-1), no story mass moments<br />
of inertia are assigned in the ETABS model. A response spectrum with a constant<br />
value of 0.4g is used. Other parameters associated with the structure are as follows:<br />
Columns Beams<br />
Axial area 4 ft 2 5 ft 2<br />
Minor moment of inertia 1.25 ft 4 1.67 ft 4<br />
Major moment of inertia 1.25 ft 4 2.61 ft 4<br />
Modulus of elasticity 350000 ksf 500000 ksf<br />
The input data file is EX8.EDB. This file is available on the CD.<br />
13'<br />
13'
ETABS <strong>Verification</strong> Manual Example 8<br />
Comparison of Results<br />
This example is also analyzed in Wilson and Habibullah (1992) and Peterson<br />
(1981). A comparison of the key ETABS results with Wilson and Habibullah and<br />
Peterson is shown in Table 8-1. The agreement is excellent.<br />
Table 8-1 Comparison of Results<br />
Quantity ETABS Reference 1 Reference 2<br />
Period, Mode 1 0.22708 0.22706 0.22706<br />
Period, Mode 2 0.21565 0.21563 0.21563<br />
Period, Mode 3 0.07335 0.07335 0.07335<br />
Period, Mode 4 0.07201 0.07201 0.07201<br />
X-Displacement<br />
Center of mass, 2 nd Story<br />
0.0201 0.0201 0.0201<br />
References<br />
Peterson, F.E. 1981. EASE2, Elastic Analysis for Structural <strong>Engineering</strong> - Example<br />
Problem Manual. <strong>Engineering</strong> Analysis Corporation. Berkeley,<br />
California.<br />
Wilson, E.L. and A. Habibullah 1992. SAP90, Sample Example and <strong>Verification</strong><br />
Manual, <strong>Computers</strong> and Structures, Inc. Berkeley, California.<br />
Comparison of Results 8 - 3
Example 9<br />
Two-Story, Three-Dimensional Unsymmetrical<br />
Building Frame<br />
Dynamic Response Spectrum Analysis<br />
Description<br />
This is a two-story three-dimensional unsymmetrical building frame. The structure<br />
is subjected to a seismic response spectrum along two horizontal axes that<br />
are at a 30-degree angle to the building axes.<br />
The geometry of the structure is shown in Figure 9-1.<br />
Significant Options of ETABS Activated<br />
� Three-dimensional frame analysis<br />
� Dynamic response spectrum analysis<br />
Description 9 - 1
Example 9 ETABS <strong>Verification</strong> Manual<br />
Figure 9-1 Two-Story Three-Dimensional Unsymmetrical Building Frame<br />
Computer Model<br />
The three-dimensional structure is modeled as a single frame with six column<br />
lines and five bays. Kip-foot-second units are used. The seismic excitation is<br />
identical to the one used in Wilson and Habibullah (1992). Typical columns are<br />
18"x18" and beams are 12"x24". The modulus of elasticity is taken as<br />
432000ksf.<br />
The input data file is EX9.EDB. This file is available on the CD.<br />
Comparison of Results<br />
The structure is also analyzed in Wilson and Habibullah (1992). Key ETABS<br />
results are compared in Table 9-1. The comparison is excellent.<br />
9 - 2 Computer Model
ETABS <strong>Verification</strong> Manual Example 9<br />
Table 9-1 Comparison of Results<br />
Quantity ETABS<br />
Wilson and<br />
Habibullah<br />
Period, Mode 1 0.4146 0.4146<br />
Period, Mode 2 0.3753 0.3753<br />
Period, Mode 3 0.2436 0.2436<br />
Period, Mode 4 0.1148 0.1148<br />
Period, Mode 5 0.1103 0.1103<br />
Period, Mode 6 0.0729 0.0729<br />
X- Displacement<br />
Center of Mass at 2 nd Story for:<br />
Reference<br />
Seismic at 30° to X 0.1062 0.1062<br />
Seismic at 120° to X 0.0617 0.0617<br />
Wilson, E.L. and A. Habibullah 1992. SAP90, Sample Example and <strong>Verification</strong><br />
Manual, <strong>Computers</strong> and Structures, Inc. Berkeley, California.<br />
Reference 9 - 3
Example 10<br />
Three-Story Plane Frame with ADAS Elements<br />
Nonlinear Time History Analysis<br />
Description<br />
This is a single bay three-story plane frame subjected to ground motion, as shown<br />
in Figure 10-1. The El Centro 1940 (N-S) record is used in the nonlinear time<br />
history analysis. Three elements that absorb energy through hysteresis (ADAS<br />
elements as described in Scholl 1993 and Tsai, et al. 1993) are used to connect<br />
the chevron braces to the frame. Two models are investigated. In the first model,<br />
the ADAS elements are intended to produce about 5% damping in the fundamental<br />
mode. In the second model, damping is increased to 25%. The manufacturer<br />
supplied the properties of ADAS elements.<br />
Significant Options of ETABS Activated<br />
� Two-dimensional frame analysis<br />
� Panel zones<br />
Description 10 - 1
Example 10 ETABS <strong>Verification</strong> Manual<br />
Figure 10-1 Planar Frame with ADAS Elements<br />
� Point assignments<br />
� Nonlinear time history analysis<br />
� Ritz vectors<br />
1<br />
D1<br />
D1<br />
D1<br />
10 - 2 Significant Options of ETABS Activated<br />
D2<br />
D2<br />
D2<br />
2
ETABS <strong>Verification</strong> Manual Example 10<br />
Computer Model<br />
The frame is modeled as a two-column line, one-bay system. Kip-inch-second<br />
units are used. The modulus of elasticity is taken as 29000 ksi. Column, beam<br />
and brace section properties are user-defined.<br />
The ADAS elements are modeled in ETABS by assigning a panel zone with a<br />
nonlinear link property to the mid-span point object where the chevrons intersect<br />
the beams at each story. The link properties use the uniaxial hysteretic spring<br />
property (PLASTIC1) and provide beam-brace connectivity with nonlinear behavior<br />
in the U2 (shear in the 1-2 plane) direction. Under this arrangement, displacements<br />
are transferred between the chevrons and the frame via the link elements<br />
undergoing shear deformation.<br />
A single rigid diaphragm is allocated to each story level, and connects all three<br />
point objects (two column points and one mid-span point) at each story. Because<br />
of the rigid diaphragms, no axial force will occur in the beam members. All<br />
members are assigned a rigid zone factor of 1.<br />
In both models the value of post yield stiffness ratio is taken as 5% and the time<br />
increment for output sampling is specified as .02 second.<br />
The input data files for this example are EX10A.EDB (5% damping) and<br />
EX10B.EDB (25% damping). The time history file is ELCN-THE. These files<br />
are available on the CD.<br />
Comparison of Results<br />
Sample results are compared in Table 10-1 with results from the nonlinear analysis<br />
program DRAIN-2DX (Prakash, et al. 1993) for both 5% and 25% damping<br />
cases. The agreement is good to excellent.<br />
Table 10-1 Results Comparison<br />
5% Damping 25% Damping<br />
Level ETABS DRAIN-2DX ETABS DRAIN-2DX<br />
Comparison of Maximum Story Deflections<br />
3 rd 4.57 4.57 2.10 1.92<br />
2 nd 3.48 3.51 1.68 1.55<br />
1 st 1.82 1.82 0.92 0.86<br />
Computer Model 10 - 3
Example 10 ETABS <strong>Verification</strong> Manual<br />
Table 10-1 Results Comparison<br />
5% Damping 25% Damping<br />
Level ETABS DRAIN-2DX ETABS DRAIN-2DX<br />
Comparison of Maximum Link Shear Force<br />
3 rd 7.29 7.31 17.75 17.40<br />
2 nd 13.97 13.92 36.70 36.20<br />
1 st 17.98 18.00 47.79 47.10<br />
Comparison of Maximum Brace Axial Force<br />
3 rd 5.16 5.17 12.55 12.30<br />
2 nd 9.88 9.84 25.95 25.60<br />
1 st 12.71 12.70 33.79 33.28<br />
References<br />
Prakash, V., G.A. Powell, and S. Campbell 1993. DRAIN-2DX Base Program<br />
Description and User Guide. Department of Civil <strong>Engineering</strong>. University<br />
of California. Berkeley, California.<br />
Scholl, Roger E. 1993. Design Criteria for Yielding and Friction Energy Dissipaters.<br />
Proceedings of ATC-17-1 Seminar on Seismic Isolation, Passive<br />
Energy Dissipation, and Active Control. San Francisco, California. Vol.<br />
2, 485-495. Applied Technology Council. Redwood City, California.<br />
Tsai, K.H., H.W. Chen, C.P. Hong, and Y.F. Su 1993. Design of Steel Triangular<br />
Plate Energy Absorbers for Seismic-Resistant Construction. Earthquake<br />
Spectra. Vol. 9, Number 3, 505-528.<br />
10 - 4 References
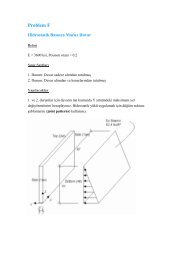
Example 11<br />
Three-Story Plane Frame with Viscous<br />
Damper Elements, Nonlinear Time History<br />
Analysis<br />
Description<br />
This is a single-bay, three-story plane frame subjected to ground motion, as<br />
shown in Figure 11-1. The El Centro 1940 (N-S) record is used in the nonlinear<br />
time history analysis. Three viscous damper elements of the type described in<br />
Hanson (1993) are used to connect the chevron braces to the frame. Two models<br />
are investigated. In the first model, the damper elements are intended to produce<br />
about 5% damping in the fundamental mode. In the second model, damping is<br />
increased to 25%.<br />
The ETABS viscous damper element (DAMPER) is a uniaxial damping device<br />
with a linear or nonlinear force-velocity relationship given by F = CV α .<br />
Description 11 - 1
Example 11 ETABS <strong>Verification</strong> Manual<br />
11 - 2<br />
Figure 11-1 Planar Frame with Damper Elements<br />
Significant Options of ETABS Activated<br />
� Two-dimensional frame analysis<br />
� Use of panel zones<br />
� Use of uniaxial damper elements<br />
� Point assignments<br />
� Nonlinear time history analysis<br />
� Ritz vectors<br />
1<br />
D1 D2<br />
D1 D2<br />
D1 D2<br />
2
ETABS <strong>Verification</strong> Manual Example 11<br />
Computer Model<br />
The frame is modeled as a two-column line, one-bay system. Kip-inch-second<br />
units are used. The modulus of elasticity is taken as 29000 ksi. Column, beam<br />
and brace section properties are user-defined.<br />
The damper elements are modeled in ETABS by assigning a panel zone with a<br />
nonlinear link property to the mid-span point object where the chevrons intersect<br />
the beams at each story. The link properties use the uniaxial damper property<br />
(DAMPER), and provide beam-brace connectivity with nonlinear behavior in the<br />
U2 (shear in the 1-2 plane) direction. Under this arrangement, displacements are<br />
transferred between the chevrons and the frame via the link elements (dampers)<br />
undergoing shear deformation.<br />
A single rigid diaphragm is allocated to each story level and connects all three<br />
point objects (two column points and one mid-span point) at each story. Because<br />
of the rigid diaphragms, no axial force will occur in the beam members. All<br />
members are assigned a rigid zone factor of 1.<br />
The time increment for output sampling is specified as .02 second.<br />
The input data files for this example are EX11A.EDB (5% damping) and<br />
EX11B.EDB (25% damping). The time history file is ELCN-THE. These files<br />
are available to the user on the CD.<br />
Comparison of Results<br />
Sample results for α = 1 are compared in Table 11-1 with results from the nonlinear<br />
analysis program DRAIN-2DX (Prakash, et al. 1993) for both 5% and 25%<br />
damping cases. The agreement is excellent.<br />
Table 11-1 Results Comparison<br />
5% Damping 25% Damping<br />
Level ETABS DRAIN-2DX ETABS DRAIN-2DX<br />
Comparison of Maximum Story Deflections<br />
3 rd 4.09 4.11 2.26 2.24<br />
2 nd 3.13 3.14 1.75 1.71<br />
1 st 1.63 1.63 0.89 0.87<br />
Computer Model 11 - 3
Example 11 ETABS <strong>Verification</strong> Manual<br />
Table 11-1 Results Comparison<br />
11 - 4 References<br />
5% Damping 25% Damping<br />
Level ETABS DRAIN-2DX ETABS DRAIN-2DX<br />
Comparison of Maximum Link Shear Force<br />
3 rd 6.16 5.98 14.75 14.75<br />
2 nd 10.79 10.80 32.82 32.84<br />
1 st 15.15 15.02 44.90 44.97<br />
Comparison of Maximum Brace Axial Force<br />
References<br />
3 rd 4.36 4.23 10.43 10.43<br />
2 nd 7.63 7.63 23.21 23.22<br />
1 st 10.71 10.62 31.75 31.80<br />
Hanson, R.D. 1993. Supplemental Damping for Improved Seismic Performance.<br />
Earthquake Spectra, Vol. 9, Number 3, 319-334.<br />
Prakash, V., G.A. Powell and S. Campbell. DRAIN-2DX 1993. Base Program<br />
Description and User Guide. Department of Civil <strong>Engineering</strong>. University<br />
of California., Berkeley, California.
Example 12<br />
Pounding of Two Planar Frames, Nonlinear<br />
Time History Analysis<br />
Description<br />
A two-bay seven-story plane frame is linked to a one-bay four-story plane frame<br />
using ETABS GAP elements. The structure experiences pounding because of<br />
ground motion. The El Centro 1940 (N-S) record is used in the nonlinear time<br />
history analysis.<br />
The geometry of the structure is shown in Figure 12-1.<br />
Significant Options of ETABS Activated<br />
� Two-dimensional frame analysis<br />
� Use of uniaxial gap elements<br />
� Point assignments<br />
Description 12 - 1
Example 12 ETABS <strong>Verification</strong> Manual<br />
Figure 12-1 Planar Frame with Gap Elements<br />
12 - 2 Significant Options of ETABS Activated<br />
U1 Direction
ETABS <strong>Verification</strong> Manual Example 12<br />
� Nonlinear time history analysis<br />
� Use of multiple diaphragms<br />
Computer Model<br />
This example illustrates the use of gap elements to model pounding between<br />
buildings. The combined structure is modeled as a single frame with five column<br />
lines and three beam bays. Kip-inch-second units are used. The modulus of elasticity<br />
is taken as 29500 ksi. Column and beam section properties are userdefined.<br />
Through the joint assignment option, Column lines 4 and 5 are connected to Diaphragm<br />
2. Column lines 1 to 3 remain connected to Diaphragm 1 by default. This<br />
arrangement physically divides the structure into two parts. The interaction is<br />
provided via the gap elements, which are used as links spanning Column lines 3<br />
and 4. The local axis 1 of the links is in the global X-direction.<br />
The input data for this example is EX12.EDB. The time history file is ELCN-<br />
THU. Both of the files are available to the user on the CD.<br />
Comparison of Results<br />
The example frame analyzed using ETABS is also analyzed using SAP2000<br />
(<strong>Computers</strong> and Structures 2002) for time history loads (SAP2000 has been verified<br />
independently). A comparison of key ETABS results with SAP2000 is presented<br />
in Table 12-1. The agreement of the results is excellent.<br />
Table 12-1 Comparison of Results for Time History Analysis<br />
Quantity ETABS SAP2000<br />
Maximum Lateral Displacement at Roof 5.5521 5.5521<br />
Maximum Axial Force, Column C1 at ground 266.89 266.88<br />
A typical output produced by the program is shown in Figure 12-2. It shows the<br />
variations of the displacement of Column lines 3 and 4 and the link force at Story<br />
4. It is clearly evident that the link force is generated whenever the two column<br />
lines move in phase and their separation is less than the specified initial opening,<br />
or if they move towards each other out of phase. For display purposes, the link<br />
forces are scaled down by a factor of 0.01.<br />
Computer Model 12 - 3
Example 12 ETABS <strong>Verification</strong> Manual<br />
Figure 12-2 Variations of Displacement of Column Lines 3 and 4<br />
and Link Force at Story 4<br />
References<br />
<strong>Computers</strong> and Structures, Inc. 2002. SAP2000, Analysis Reference Manual, Version<br />
8. <strong>Computers</strong> and Structures, Inc. Berkeley, California.<br />
12 - 4 References
Base-Isolated Two-Story 3D Frame<br />
Nonlinear Time History Analysis<br />
Description<br />
Example 13<br />
This is a two-story three-dimensional frame with base isolation. The structure is<br />
subjected to earthquake motion in two perpendicular directions using the Loma<br />
Prieta acceleration records. The geometry of the structure is shown in Figure 13-<br />
1.<br />
Significant Options of ETABS Activated<br />
� Three-dimensional frame analysis<br />
� Use of area (floor) objects<br />
� Use of biaxial hysteretic elements<br />
� Point assignments<br />
� Nonlinear time history analysis using ritz vectors<br />
Description 13 - 1
Example 13 ETABS <strong>Verification</strong> Manual<br />
Computer Model<br />
13 - 2 Computer Model<br />
Figure 13-1 Base-Isolated Three-Dimensional Frame<br />
The structure is modeled as a single reinforced concrete frame with nine column<br />
lines and twelve bays. The floor slab is taken to be 8 inches thick, covering<br />
all of the specified floor bays at the base and the 1st story level. At the sec-
ETABS <strong>Verification</strong> Manual Example 13<br />
ond story level the corner column as well as the two edge beams are eliminated,<br />
together with the floor slab, to render this particular level unsymmetric,<br />
as depicted in Figure 13-1.<br />
Hysteretic base isolators of the type described in Nagarajaiah et al. (1991) are<br />
modeled using the ETABS ISOLATOR1 elements, which show biaxial hysteretic<br />
characteristics.<br />
A modulus of elasticity of 3000 ksi is used. The self-weight of concrete is<br />
taken as 150 pcf. Kip-inch-second units are used.<br />
The input data file for this example is EX13.EDB. The time history files are<br />
LP-TH0 and LP-TH90. All of these files are available to the user on the CD as<br />
part of the ETABS package.<br />
Comparison of Results<br />
The example frame analyzed using ETABS is also analyzed using SAP2000<br />
(Computer and Structure 2002) for time history loads (SAP2000 has been verified<br />
independently). A comparison of key ETABS results with SAP200 is presented<br />
in Table 13-1. The agreement of the results is excellent.<br />
Table 13-1 Comparison of Results for Time History Analysis<br />
Quantity ETABS SAP2000<br />
Maximum Uy Displacement, Column C9 at 2 nd Floor 3.4735 3.4736<br />
Maximum Axial Force, Column C1 at base 13.56 13.55<br />
A typical output produced by the program is shown in Figure 13-2. It shows<br />
the load-deformation relationship in the major direction for a typical isolator<br />
member.<br />
Comparison of Results 13 - 3
Example 13 ETABS <strong>Verification</strong> Manual<br />
References<br />
13 - 4 References<br />
Figure 13-2 Load Deformation Diagram<br />
<strong>Computers</strong> and Structures, Inc. 2002. SAP2000, Analysis Reference Manual, Version<br />
8. <strong>Computers</strong> and Structures, Inc. Berkeley, California.<br />
Nagarajaiah, S., A.M. Reinhorn and M.C. Constantinou 1991. 3D-Basis: Nonlinear<br />
Dynamic Analysis of Three-Dimensional Base Isolated Structures:<br />
Part II, Technical Report NCEER-91-0005. National Center for Earthquake<br />
<strong>Engineering</strong> Research. State University of New York at Buffalo.<br />
Buffalo, New York.
Example 14<br />
Friction Pendulum Base-Isolated 3D Frame<br />
Nonlinear Time History Analysis<br />
Description<br />
This is a two-story three-dimensional frame with base isolation using friction<br />
pendulum base isolators. The structure is subjected to earthquake motion in two<br />
perpendicular directions using the Loma Prieta acceleration records. The geometry<br />
of the structure is shown in Figure 14-1.<br />
Significant Options of ETABS Activated<br />
� Three-dimensional frame analysis<br />
� Use of area (floor) objects<br />
� Use of biaxial friction pendulum elements<br />
� Point assignments<br />
� Nonlinear time history analysis using ritz vectors<br />
Description 14 - 1
Example 14 ETABS <strong>Verification</strong> Manual<br />
14 - 2 Computer Model<br />
Figure 14-1 Base-Isolated Three-Dimensional Frame<br />
Computer Model<br />
The structure is modeled as a single reinforced concrete frame with nine column<br />
lines and twelve bays. The floor slab is taken to be 8 inches thick, covering all of<br />
the specified floor bays at the base and the 1st story level. At the second story<br />
level, the corner column and the two edge beams are eliminated, together with<br />
the floor slab, to render this particular level anti-symmetric, as depicted in Figure<br />
14-1.
ETABS <strong>Verification</strong> Manual Example 14<br />
Friction pendulum type base isolators of the type described in Zayas and Low<br />
(1990) are modeled using the ETABS ISOLATOR2 elements.<br />
The isolator properties are defined as follows:<br />
Stiffness in direction 1 1E3<br />
Stiffness in directions 2 and 3 1E2<br />
Coefficient of friction at fast speed .04<br />
Coefficient of friction at slow speed .03<br />
Parameter determining the variation<br />
of the coefficient of friction with velocity 20<br />
Radius of contact surface in directions 2 and 3 60<br />
A modulus of elasticity of 3000 ksi is used. The self-weight of concrete is taken<br />
as 150 pcf. Kip-inch-second units are used.<br />
It is important for these isolator elements that the axial load from other loads be<br />
modeled before starting the nonlinear analysis. This is achieved by using a factor<br />
of unity on the dead load (self weight) on the structure in the nonlinear analysis<br />
initial conditions data. The input data file for this example is EX14.EDB. The<br />
time history files are LP-TH0 and LP-TH90. All of the files are available to the<br />
user on the CD as part of the ETABS package.<br />
Comparison of Results<br />
The example frame analyzed using ETABS is also analyzed using SAP2000<br />
(<strong>Computers</strong> and Structures 2002) for time history loads (SAP2000 has been verified<br />
independently). A comparison of key ETABS results with SAP2000 is presented<br />
in Table 14-1. The agreement of the results is excellent.<br />
Table 14-1 Comparison of Result for Time History Analysis<br />
Quantity ETABS SAP2000<br />
Maximum Uy Displacement, Column C9 at 2 nd Floor 4.2077 4.2069<br />
Maximum Axial Force, Column C1 at base 38.25 38.25<br />
A typical output produced by the program is shown in Figure 14-2. It shows the<br />
variation of the displacement of the second story at column line 1.<br />
Comparison of Results 14 - 3
Example 14 ETABS <strong>Verification</strong> Manual<br />
References<br />
14 - 4 References<br />
Figure 14-2 Variation of Displacement<br />
<strong>Computers</strong> and Structures, Inc. 2002. SAP2000, Analysis Reference Manual, Version<br />
8. <strong>Computers</strong> and Structures, Inc. Berkeley, California.<br />
Zayas, V. and S. Low, 1990. A Simple Pendulum Technique for Achieving Seismic<br />
Isolation. Earthquake Spectra, Vol. 6, No. 2. Earthquake <strong>Engineering</strong><br />
Research Institute. Oakland, California.
Wall Area Object Behavior<br />
Static Lateral Loads Analysis<br />
Description<br />
Example 15<br />
This example analyzes a series of wall configurations to evaluate the behavior of<br />
the ETABS area object with wall section assignments. All walls are subjected to<br />
a static lateral load applied at the top of the wall.<br />
The following walls are included:<br />
� Planar shear wall, shown in Figure 15-1<br />
� Wall supported on columns, shown in Figure 15-2<br />
� Wall-spandrel system, shown in Figure 15-3<br />
� C-shaped wall section, shown in Figure 15-4<br />
� Wall with edges thickened, shown in Figure 15-5<br />
� E-shaped wall section, shown in Figure 15-6<br />
Description 15 - 1
Example 15 ETABS <strong>Verification</strong> Manual<br />
Significant Options of ETABS Activated<br />
� Use of area objects<br />
� Two-dimensional and three-dimensional shear wall systems<br />
� Static lateral loads analysis<br />
Computer Model<br />
A modulus of elasticity of 3000 ksi and a Poisson's ratio of 0.2 are used for all<br />
walls. Kip-inch-second units are used throughout. The following sections describe<br />
the models for the different walls.<br />
Planar Shear Wall , Example 15a<br />
This shear wall is modeled with one panel per story. Three different wall lengths<br />
of 120", 360" and 720" are analyzed. Also, one-story and three-story walls are<br />
analyzed, together with the six-story wall shown in Figure 15-1. A wall thickness<br />
of 12" is used.<br />
The input data files for theses walls are included as files EX15A1.EDB through<br />
EX15A9.EDB. These and the following input data files are available on the CD.<br />
Wall Supported on Columns, Example 15b<br />
This wall is modeled with two column lines. Columns are used for the first story,<br />
and the top two stories have a single area object with end piers, as shown in Figure<br />
15-2. End piers are 40" by 12" in cross section and panels are 12" thick.<br />
Columns are 40" by 20" in cross section.<br />
The input data for this wall is EX15B.EDB.<br />
Wall-Spandrel System, Example 15c<br />
This wall is modeled with four column lines. The spandrels are modeled as<br />
beams. Two different spandrel lengths of 60" and 240" are analyzed. Each wall<br />
is modeled with two area objects per story. Three-story walls are also analyzed<br />
together with the six-story wall shown in Figure 15-3. A wall and spandrel thickness<br />
of 12" is used.<br />
The input data files for this wall are 15C1.EDB through 15C4.EDB.<br />
15 - 2 Significant Options of ETABS Activated
ETABS <strong>Verification</strong> Manual Example 15<br />
Figure 15-1 Planar Shear Wall, Example 15a<br />
Computer Model 15 - 3
Example 15 ETABS <strong>Verification</strong> Manual<br />
15 - 4 Computer Model<br />
Figure 15-2 Wall Supported on Columns, Example 15b
ETABS <strong>Verification</strong> Manual Example 15<br />
Figure 15-3 Wall-Spandrel System, Example 15c<br />
Computer Model 15 - 5
Example 15 ETABS <strong>Verification</strong> Manual<br />
C-Shaped Wall Section, Example 15d<br />
This wall is modeled with six column lines and five area objects per story, to<br />
model the shape of the wall. A three-story wall was also analyzed together with<br />
the six-story wall, as shown in Figure 15-4. A wall thickness of 6" is used.<br />
The input data files for these walls are included as files EX15D1.EDB and<br />
EX15D2.EDB.<br />
Wall with Edges Thickened, Example 15e<br />
This wall is modeled with two column lines and one area object, with end piers,<br />
per story as shown in Figure 15-5. A three-story wall was also analyzed together<br />
with the six-story wall shown in Figure 15-5.<br />
The input data for these walls are included as files EX15E1.EDB and<br />
EX15E2.EDB.<br />
E-Shaped Wall Section, Example 15f<br />
This wall is modeled with six column lines and five area objects per story to<br />
model the shape of the wall. A three-story wall was also analyzed together with<br />
the six-story wall, as shown in Figure 15-6. A wall thickness of 6" is used.<br />
The input data for these walls are included as files EX15F1.EDB and<br />
EX15F2.EDB.<br />
15 - 6 Computer Model
ETABS <strong>Verification</strong> Manual Example 15<br />
C2<br />
GLOBAL<br />
REFERENCE<br />
POINT<br />
C3<br />
ELEVATION<br />
Y<br />
POINT OF LOAD<br />
APPLICATION<br />
100k<br />
X<br />
C4<br />
100k<br />
C1<br />
C6<br />
80” 120”<br />
80”<br />
C5<br />
80”<br />
40”<br />
TH<br />
TH<br />
TH<br />
RD<br />
ND<br />
ST<br />
PLAN<br />
Figure 15-4 C-Shaped Wall Section, Example 15d<br />
Computer Model 15 - 7
Example 15 ETABS <strong>Verification</strong> Manual<br />
Y<br />
15 - 8 Computer Model<br />
30” 30”<br />
Global<br />
Reference<br />
Point<br />
C1 C2<br />
210”<br />
8”<br />
18”<br />
Figure 15-5 Wall with Thickened Edges, Example 15e<br />
X<br />
TH<br />
TH<br />
TH<br />
RD<br />
ND<br />
ST
ETABS <strong>Verification</strong> Manual Example 15<br />
120”<br />
120”<br />
120”<br />
120”<br />
120”<br />
120”<br />
GLOBAL<br />
REFERENCE<br />
POINT<br />
C1<br />
C4<br />
120”<br />
ELEVATION<br />
Y<br />
C5<br />
100k<br />
C2<br />
PLAN<br />
POINT OF LOAD<br />
APPLICATION<br />
TH<br />
6<br />
100k<br />
120”<br />
TH<br />
5<br />
4 TH<br />
RD<br />
3<br />
2 ND<br />
ST<br />
1<br />
Figure 15-6 E-Shaped Wall Section, Example 15f<br />
X<br />
C3<br />
C6<br />
120”<br />
BASELINE<br />
Computer Model 15 - 9
Example 15 ETABS <strong>Verification</strong> Manual<br />
Comparison of Results<br />
All walls analyzed in this example using ETABS were also analyzed using the<br />
general structural analysis program SAP2000 (<strong>Computers</strong> and Structure 2002),<br />
using refined meshes of the membrane/shell element of that program. The<br />
SAP2000 meshes used are shown in Figures 15-7, 15-8, 15-9, 15-10, 15-11 and<br />
15-12. For the SAP2000 analysis, the rigid diaphragms at the floor levels were<br />
modeled by constraining all wall nodes at the floor to have the same lateral displacement<br />
for planar walls, or by adding rigid members in the plane of the floor<br />
for three-dimensional walls.<br />
15 - 10 Comparison of Results<br />
Figure 15-7 SAP2000 Mesh, Example 15a
ETABS <strong>Verification</strong> Manual Example 15<br />
Figure 15-8 SAP2000 Mesh, Example 15b<br />
Figure 15-9 SAP2000 Mesh, Example 15c<br />
Comparison of Results 15 - 11
Example 15 ETABS <strong>Verification</strong> Manual<br />
15 - 12 Comparison of Results<br />
Figure 15-10 SAP2000 Mesh, Example 15d<br />
Figure 15-11 SAP2000 Mesh, Example 15e
ETABS <strong>Verification</strong> Manual Example 15<br />
Figure 15-12 SAP2000 Mesh, Example 15f<br />
The lateral displacements from the ETABS and SAP2000 analyses are compared<br />
in Tables 15-1, 15-2, 15-3, 15-4, 15-5 and 15-6 for the various walls.<br />
The agreement is good. In general, the comparisons become better as the<br />
number of stories is increased.<br />
Comparison of Results 15 - 13
Example 15 ETABS <strong>Verification</strong> Manual<br />
Table 15-1 Results Comparison for Top Displacements (Inches), Example 15a<br />
Number of<br />
Stories<br />
Wall Height<br />
(inches)<br />
6 720<br />
3 360<br />
1 120<br />
15 - 14 Comparison of Results<br />
Wall Length<br />
(inches) ETABS SAP2000<br />
120 2.3926 2.4287<br />
360 0.0985 0.1031<br />
720 0.0172 0.0186<br />
120 0.3068 0.3205<br />
360 0.0169 0.0187<br />
720 0.0046 0.0052<br />
120 0.0144 0.0185<br />
360 0.0024 0.0029<br />
720 0.0011 0.0013<br />
Table 15-2 Results Comparison for Displacements (Inches), Example 15b<br />
Location ETABS SAP2000<br />
Story 3 0.0690 0.0671<br />
Story 2 0.0524 0.0530<br />
Story 1 0.0390 0.0412<br />
Table 15-3 Results Comparison for Top Displacements (inches)<br />
Example 15c (1-4)<br />
Number of Stories Beam Length (inches) ETABS SAP2000<br />
6<br />
3<br />
60 0.0841 0.0869<br />
240 0.1443 0.1505<br />
60 0.0186 0.0200<br />
240 0.0311 0.0332
ETABS <strong>Verification</strong> Manual Example 15<br />
Table 15-4 Results Comparison for Top Displacements (Inches) at Load<br />
Application Point, Example 15d (1-2)<br />
Number of<br />
Stories<br />
6<br />
3<br />
Load<br />
Direction<br />
Displacement<br />
Direction ETABS SAP2000<br />
X X 0.8621 0.8936<br />
X Z-Rotation 0.0185 0.0191<br />
Y Y 1.1427 1.1882<br />
X X 0.1242 0.1337<br />
X Z-Rotation 0.0024 0.0025<br />
Y Y 0.1614 0.1733<br />
Table 15-5 Results Comparison for Top Displacements (Inches),<br />
Example 15e(1-2)<br />
Number of Stories ETABS SAP2000<br />
6 0.2798 0.2899<br />
3 0.0451 0.0480<br />
Table 15-6 Results Comparison for Displacements at Load Application,<br />
Example 15f (1-2)<br />
Number of<br />
Stories<br />
6<br />
3<br />
Load<br />
Direction<br />
Displacement<br />
Direction ETABS SAP2000<br />
X X 0.3695 0.3655<br />
X Z-Rotation 0.0042 0.0039<br />
Y Y 0.7286 0.7490<br />
X X 0.0596 0.0628<br />
X Z-Rotation 0.0005 0.0005<br />
Y Y 0.0989 0.1058<br />
Comparison of Results 15 - 15
Example 15 ETABS <strong>Verification</strong> Manual<br />
References<br />
<strong>Computers</strong> and Structures, Inc. 2002. SAP2000, Analysis Reference Manual,<br />
Version 8. <strong>Computers</strong> and Structures, Inc. Berkeley, California.<br />
15 - 16 References