AGARD R-800 - FTP Directory Listing - Nato
AGARD R-800 - FTP Directory Listing - Nato
AGARD R-800 - FTP Directory Listing - Nato

You also want an ePaper? Increase the reach of your titles
YUMPU automatically turns print PDFs into web optimized ePapers that Google loves.
.<br />
.<br />
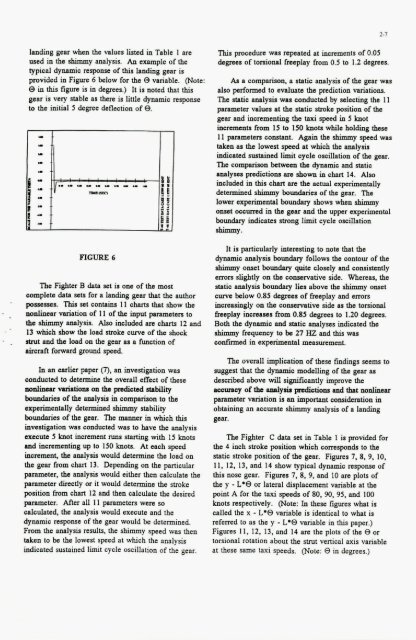
landing gear when the values listed in Table 1 arc<br />
used in the shimmy analysis. An example of the<br />
typical dynamic response of this landing gear is<br />
provided in Figure 6 below for the 8 variable. (Note:<br />
8 in this figure is in degrees.) It is noted that this<br />
gear is very stable as there is little dynamic response<br />
to the initial 5 degree deflection of 0.<br />
Y I I<br />
FIGURE 6<br />
The Fighter B data sCt is one of the most<br />
complete data sets for a landing gear that the author<br />
poswsses. This set contains 11 charts that show the<br />
nonlinear variation of 11 of the input parameters to<br />
the shimmy analysis. Also included arc charts 12 and<br />
13 which show the load stroke curve of the shock<br />
strut and the load on the gear as a function of<br />
aircraft forward ground speed.<br />
In an earlier paper (7). an investigation was<br />
conducted to determine the overall effect of these<br />
nonlinear vuiations on the prrdiotcd stability<br />
boundaries of the analysis in comparison to the<br />
experimentally determined shimmy stability<br />
boundaries of the gear. The manner in which this<br />
investigation was conducted was to have the analysis<br />
execute 5 knot increment runs starting with 15 knots<br />
and incrementing up to 150 knots. At each speed<br />
increment, the analysis would determine the load on<br />
the gear from chart 13. Depending on the particular<br />
parameter, the analysis would either then calculate the<br />
parameter directly or it would determine the stroke<br />
position from chart 12 and then calculate the desired<br />
pwameter. After all I1 parameters were so<br />
calculated, the analysis would execute and the<br />
dynamic response of the gear would be determined.<br />
From the analysis results. the shimmy speed was then<br />
taken to be the lowest speed at which the analysis<br />
indicated sustained limit cycle oscillation of the gear.<br />
2-1<br />
This procedure was repeated at increments of 0.05<br />
degrees of torsional Geeplay from 0.5 to 1.2 degrees.<br />
As a comparison. a static analysis of the gear was<br />
also performed to evaluate the prediction variations.<br />
The static analysis was conducted by selecting the 11<br />
parameter values at the static stroke position of the<br />
gear and incrcmenting the taxi speed in 5 knot<br />
increments from IS to 150 knots while holding these<br />
11 parameters constant. Again the shimmy speed was<br />
taken as the lowest speed at which the analysis<br />
indicated sustained limit cycle oscillation of the gear.<br />
The comparison between the dynamic and static<br />
analyses predictions are shown in chart 14. Also<br />
included in this charr arc the actual experimentally<br />
determined shimmy boundaries of the gear. The<br />
lower experimental boundary shows when shimmy<br />
onset occurred in the gear and the upper experimental<br />
boundary indicates strong limit cycle oscillation<br />
shimmy.<br />
It is particularly interesting to note that the<br />
dynamic analysis boundary follows the contour of the<br />
shimmy onset boundary quite closely and consistently<br />
errors slightly on the conservative side. Whereas, the<br />
static analysis boundary lies above the shimmy onset<br />
curve below 0.85 degrees of freeplay and ermrs<br />
increasingly on the conservative side aa the torsional<br />
freeplay increaser from 0.85 degrees to 1.20 degrees.<br />
Both the dynamic and static analyses indicated the<br />
shimmy frequency to be 27 HZ and this was<br />
confiied in experimental measurement.<br />
The overall implication of these fmdmgs seems to<br />
suggest that the dynamic modelling of the gear as<br />
described above will significantly improve the<br />
~mcy of ths adyrir prsdiotions and that nonlinear<br />
paramcter variation ir on important consideration in<br />
obtaining an accurate shimmy analysis of a landing<br />
gear.<br />
The Fighter C data set in Table I is provided for<br />
the 4 inch stroke position which corresponds to the<br />
static stroke position of the gear. Figures 7.8.9, IO,<br />
11, 12, 13, and 14 show typical dynamic response of<br />
this nose gear. Figures 7, 8, 9, and 10 arc plots of<br />
the y - L*Q or lateral displacement variable at the<br />
point A for the taxi speeds of 80, 90, 95, and 100<br />
knots respectively. (Note: In these figures what is<br />
called the x - L*Q variable is identical to what is<br />
referred to as the y - L*Q variable in this paper.)<br />
Figures 11. 12, 13, and 14 are the plots of the 0 or<br />
torsional rotation about the strut vertical axis variable<br />
at these same taxi speeds. (Note: C3 in degrees.)