of Ban Don Bay and Phangnga Bay, Thailand - WorldFish Center
of Ban Don Bay and Phangnga Bay, Thailand - WorldFish Center
of Ban Don Bay and Phangnga Bay, Thailand - WorldFish Center

You also want an ePaper? Increase the reach of your titles
YUMPU automatically turns print PDFs into web optimized ePapers that Google loves.
i ,<br />
Thcoastal Environmental Pr<strong>of</strong>ile<br />
<strong>of</strong> <strong>Ban</strong> <strong>Don</strong> <strong>Bay</strong> <strong>and</strong> <strong>Phangnga</strong> <strong>Bay</strong>, Thail<strong>and</strong><br />
Edited by<br />
James N. 8 P v,
The Coastal Environmental Pr<strong>of</strong>ile<br />
<strong>of</strong> <strong>Ban</strong> <strong>Don</strong> <strong>Bay</strong> <strong>and</strong> <strong>Phangnga</strong> <strong>Bay</strong>, Thail<strong>and</strong><br />
Edited by<br />
Published by the International Cenrer for Living Aquatic<br />
Resources Management on behalf <strong>of</strong> the Association <strong>of</strong><br />
Southeast Asian Nations/Unired States Coastal Resout-ces<br />
Management Project<br />
PI-inted in Manila, Philippines<br />
Paw, J.N., S. Bunpapong, A.T. Wh~te <strong>and</strong> M.S.M. Sadorra, editors.<br />
1988. The coastal environmental PI-<strong>of</strong>ile <strong>of</strong> <strong>Ban</strong> <strong>Don</strong> <strong>Bay</strong> <strong>and</strong><br />
<strong>Phangnga</strong> <strong>Bay</strong>,Thail<strong>and</strong>. ICLARM Techn~cal Repot-ts 20.<br />
78 p. International <strong>Center</strong> for Living Aquatic Hesources<br />
Management, Manila, Philippines.<br />
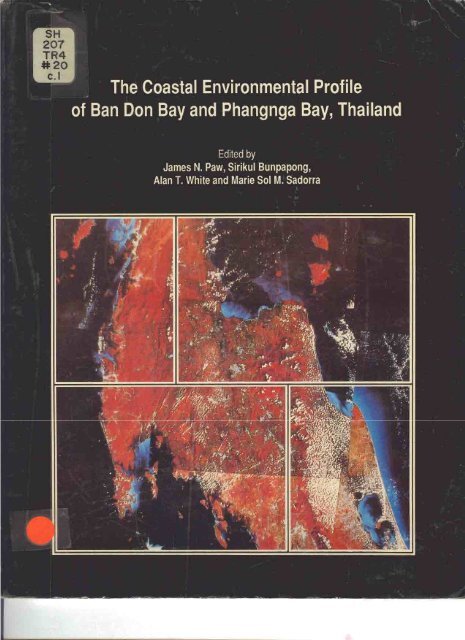
Cover: False color composite l<strong>and</strong>sat images <strong>of</strong> <strong>Ban</strong> <strong>Don</strong> <strong>Bay</strong><br />
<strong>and</strong> <strong>Phangnga</strong> <strong>Bay</strong> linked together to show the whole<br />
Upper South, Thail<strong>and</strong>.<br />
ISSN 01 15 -5547<br />
ISBN 971-1022-40-0<br />
ICLARM Contribution No. 424
m<br />
I0<br />
B<br />
Contents<br />
List <strong>of</strong> Figures ................................................................ vii<br />
List <strong>of</strong> Acronyms <strong>and</strong> Abbreviations .................................................. VIII<br />
Acknowledgements ............................................................. ix<br />
Forewords . .................................................................. xi<br />
Introduction. Teerayut Poopetch <strong>and</strong> James W . Evans<br />
......................................<br />
Chapter 1 . The Upper South: Physical Setting <strong>and</strong> L<strong>and</strong> Use. Sirikul Bunpapong <strong>and</strong> James N . Paw<br />
Location. Topography <strong>and</strong> Geology .......................................... 1<br />
Climate ............................................................. 6<br />
CatchmentArea ....................................................... 6<br />
L<strong>and</strong> Use <strong>and</strong> Agriculture ................................................. 7<br />
Mineral <strong>and</strong> Energy Resources . ............................................. 8<br />
Chapter 2 . Natural Resources <strong>and</strong> Environment<br />
Surface Water Resources. Nisakorn Kosirratana . .................................. 10<br />
Marine Environment. Manuwadi Hungspreugs <strong>and</strong> Prawin Limpsaichol ................... 14<br />
Soi 1s. Pisoot Vijarnsorn ................................................... 17<br />
L<strong>and</strong> Capability. Pisoot Vijarnsorn ............................................ 20<br />
Mangrove Forests. Sanit Aksornkoae <strong>and</strong> Apisit Eiurnnoh ............................ 21<br />
Wildlife <strong>and</strong> Protected Areas. Choompol Ngampongsai . ............................. 26<br />
Chapter 3 . Fisheries <strong>and</strong> Aquaculture: Resource <strong>and</strong> Economics<br />
Fisheries. Somporn Lohsawatkul ............................................ 30<br />
Aquaculture. Niphond Haemaprasit <strong>and</strong> James N . Paw .............................. 32<br />
Chapter 4 . Tourism: Resource <strong>and</strong> Economics. Robert Dobias<br />
. .<br />
Surat Than1 Ma~nl<strong>and</strong> .................................................... 37<br />
Samui<strong>and</strong>Satellitelsl<strong>and</strong>s ................................................ 39<br />
Phuket ............................................................. 40<br />
<strong>Phangnga</strong> <strong>and</strong> Krabi ..................................................... 43<br />
Chapter 5 . Other Economic Sectors. Subarn Panvisavas. Praguyrur Sukumalachart <strong>and</strong><br />
Wilasinee Wongprasert<br />
Agriculture ............................................................ 45<br />
Livestock ............................................................ 47<br />
iii<br />
...<br />
xiv
Industry ............................................................ 47<br />
Trading <strong>and</strong> Service ..................................................... 48<br />
Mining <strong>and</strong> Ports ....................................................... 48<br />
Chapter 6 . Population. Winai Weerawattananon. George A . Attig <strong>and</strong> Shutima Ounock<br />
Demography . ......................................................... 49<br />
Culture ............................................................. 53<br />
Employment ......................................................... 55<br />
Chapter 7 . Institutional <strong>and</strong> Legal Framework. Arthorn Suphapodok <strong>and</strong> Sirikul Bunpapong<br />
Introduction . ......................................................... 58<br />
Laws <strong>and</strong> Regulations .................................................... 59<br />
l nstitutions .......................................................... 61<br />
Chapter 8 . Coastal Resources Management Issues <strong>and</strong> Plan Formulation. Alan T . White<br />
<strong>and</strong> Arthorn Suphapodok<br />
References<br />
Project Boundaries <strong>and</strong> Limits . ............................................. '64<br />
Coastal Resources Management Issues ......................................... 65<br />
Conceptual Framework for Coastal Area Management Planning ........................ 70
List <strong>of</strong> Tables<br />
Geology <strong>of</strong> the Upper South Region. Thail<strong>and</strong> ..............................<br />
Summary <strong>of</strong> agricultural. forestry. fisheries. mineral <strong>and</strong> tourist-based production in<br />
the Upper South. Thail<strong>and</strong> ...........................................<br />
Comparison <strong>of</strong> the gross area (km2) <strong>of</strong> major l<strong>and</strong> use categories in the Upper South.<br />
Thail<strong>and</strong>. in 1973. 1980 <strong>and</strong> 1982 ......................................<br />
Hydrological characteristics <strong>of</strong> selected rivers in the Upper South. Thail<strong>and</strong>. in 1984 . ....<br />
Range <strong>of</strong> water quality parameters from K . Phum Duang. 1986 . ..................<br />
List <strong>of</strong> wastewater sources in Surat Thani Province ...........................<br />
List <strong>of</strong> wastewater sources in <strong>Phangnga</strong> <strong>and</strong> Krabi . ...........................<br />
Classification <strong>and</strong> l<strong>and</strong> capability assessment <strong>of</strong> soils in the Upper South. Thail<strong>and</strong> ......<br />
Area (ha) <strong>of</strong> mangrove forests in <strong>Ban</strong> <strong>Don</strong> <strong>Bay</strong> by provinces in 1979 . ...............<br />
Area (ha) <strong>of</strong> mangrove forests in <strong>Phangnga</strong> <strong>Bay</strong> by provinces <strong>and</strong> districts (amphoe)<br />
in1979 ........................................................<br />
Tree density (treeslha) <strong>of</strong> mangrove foresfs in <strong>Ban</strong> <strong>Don</strong> <strong>Bay</strong> in A . Khanom. Nakhon<br />
SiThammarat . ...................................................<br />
Stem volume (m3/ha) <strong>of</strong> mangrove forests in <strong>Ban</strong> <strong>Don</strong> <strong>Bay</strong> in A . Khanom. Nakhon<br />
SiThammarat . .................................................<br />
2.10 Average density (treeslha) <strong>of</strong> dominant mangrove species in limestone area from<br />
estuary to inl<strong>and</strong> sites <strong>of</strong> <strong>Phangnga</strong> <strong>Bay</strong>. A . Muang. <strong>Phangnga</strong> . ....................<br />
2.1 1 Average density (treeslha) <strong>of</strong> dominant mangrove species in shale <strong>and</strong> quartzitic area<br />
from estuary to inl<strong>and</strong> sites <strong>of</strong> <strong>Phangnga</strong> <strong>Bay</strong>. A . Muang. <strong>Phangnga</strong> . ................<br />
2.12 Average density (treeslha) <strong>of</strong> dominant mangrove species in s<strong>and</strong>stone area from<br />
estuary to inl<strong>and</strong> sites <strong>of</strong> <strong>Phangnga</strong>.<strong>Bay</strong>. A . Muang. <strong>Phangnga</strong> . ....................<br />
2.13 Average volume (m3/ha) <strong>of</strong> dominant mangrove species in limestone area from estuary<br />
to inl<strong>and</strong> sites <strong>of</strong> <strong>Phangnga</strong> <strong>Bay</strong>. A . Muang. <strong>Phangnga</strong> . .........................<br />
2.14 Average volume (m3/ha) <strong>of</strong> dominant mangrove species in shale <strong>and</strong> quartzitic area<br />
from estuary to inl<strong>and</strong> sites <strong>of</strong> <strong>Phangnga</strong> <strong>Bay</strong>. A . Muang. <strong>Phangnga</strong> .................<br />
2.15 Average volume (m3/ha) <strong>of</strong> dominant mangrove species in s<strong>and</strong>stone area from estuary<br />
to inl<strong>and</strong> sites <strong>of</strong> <strong>Phangnga</strong> <strong>Bay</strong>. A . Muang. <strong>Phangnga</strong> . ...............................<br />
Seedling distribution (per ha) <strong>of</strong> mangrove forests <strong>of</strong> <strong>Ban</strong> <strong>Don</strong> <strong>Bay</strong> in A . Khanom.<br />
Nakhon Si Thammarat ....................................................<br />
Average density <strong>of</strong> mangrove seedlings (per ha) in limestone area from estuary to inl<strong>and</strong><br />
sites <strong>of</strong> <strong>Phangnga</strong> <strong>Bay</strong>. A . Muang. <strong>Phangnga</strong> ......................................<br />
Average density <strong>of</strong> mangrove seedlings (per ha) in shale <strong>and</strong> quartzitic area from estuary<br />
to inl<strong>and</strong> sites <strong>of</strong> <strong>Phangnga</strong> <strong>Bay</strong>. A . Muang. <strong>Phangnga</strong> . ...............................<br />
Average density <strong>of</strong> mangrove seedlings (per ha) in s<strong>and</strong>stone area from estuary to inl<strong>and</strong><br />
sites <strong>of</strong> <strong>Phangnga</strong> <strong>Bay</strong>. A . Muang. <strong>Phangnga</strong> ......................................<br />
Protected areas in the Upper South. Thail<strong>and</strong> . ....................................<br />
Catch rate (kglhr) <strong>of</strong> valuable <strong>and</strong> trash fish in <strong>Phangnga</strong> <strong>Bay</strong> <strong>and</strong> the adjacent waters ..........<br />
Catch rate (kglhr) in the stations in <strong>Phangnga</strong> <strong>Bay</strong> <strong>and</strong> the adjacent waters . .................<br />
Blood cockle aquaculture production in <strong>Phangnga</strong>. 1979 -1 984 .........................<br />
Production <strong>of</strong> oysters in <strong>Phangnga</strong>. 1979.1984 ....................................<br />
Shrimp production (t) in <strong>Phangnga</strong>. 1979-1980 . ..................................<br />
3.6 Aquaculture production (t) <strong>of</strong> short-necked clam in the provinces. 1978-1984 . .................<br />
3.7 Shrimp production It) in Krabi. 1978.1983 .........................................<br />
3.8 Shrimp production (t) in Surat Thani .............................................
3.9 Production (t) <strong>of</strong> blood cockle in Surat Thani. 1979 -1984 ...............................<br />
3.10 Production (t) <strong>of</strong> oysters in Surat Thani ............................................<br />
4.1 Forecasts on the number <strong>of</strong> hotel guests in the Upper South. Thail<strong>and</strong> .......................<br />
4.2 Income from tourism for Phuket. 1981-1983 ........................................<br />
4.3 Hotel guest volumes <strong>and</strong> percentages <strong>of</strong> hotels with over 50 rooms for major Phuket<br />
beaches <strong>and</strong> Phuket City in 1985 ................................................<br />
4.4 Comparison <strong>of</strong> increases in the number <strong>of</strong> hotel rooms in various Phuket locations ...............<br />
5.1 Comparison <strong>of</strong> gross product in 1984 at constant 1972 prices <strong>of</strong> <strong>Phangnga</strong>. Phuket <strong>and</strong><br />
Surat Thani with the Southern Region <strong>and</strong> the country (million baht) ........................<br />
5.2 Average income per person in <strong>Phangnga</strong>. Phuket <strong>and</strong> Surat Thani with the Southern<br />
Region <strong>and</strong> the country. 1984 ..................................................<br />
5.3 Value <strong>of</strong> mineral products in Phuket as compared with the Southern Region <strong>and</strong><br />
Thail<strong>and</strong>. ? 977-1980 ........................................................<br />
6.1 Population change <strong>of</strong> Surat Thani. 1979-1985 . ......................................<br />
6.2 Percentage <strong>of</strong> migrating people to Surat Thani. 1980 . ..................................<br />
6.3 Population density in Surat Thani. 1980-1984 . ......................................<br />
6.4 Population density in <strong>Phangnga</strong>. 1980.1984 . ........................................<br />
6.5 Population density in Phuket. 1980-1984 . .........................................<br />
6.6 Number <strong>of</strong> mineral workers in Surat Thani. <strong>Phangnga</strong> <strong>and</strong> Phuket. 1979-1982 . .................<br />
7.1 List <strong>of</strong> institutions <strong>and</strong> agencies responsible for various coastal resources in Thail<strong>and</strong> . .............<br />
8.1 Management issues <strong>and</strong> objectives . ...............................................<br />
8.2 Outline for an action plan . ....................................................
List <strong>of</strong> Figures<br />
The Upper South Region <strong>of</strong> Thail<strong>and</strong> located on the upper part <strong>of</strong> the Malay Peninsula ............ 2<br />
Mountain ranges in the Upper South. Thail<strong>and</strong> (JICA 1985) .............................. 2<br />
Study site in <strong>Ban</strong> <strong>Don</strong> <strong>Bay</strong> with the cross-sectional areas marked . .......................... 3<br />
Coastal cross-sectional pr<strong>of</strong>iles in <strong>Ban</strong> <strong>Don</strong> <strong>Bay</strong> . ...................................... 3<br />
Study site in <strong>Phangnga</strong> <strong>Bay</strong> with the cross-sectional areas marked . .......................... 4<br />
Coastal cross-sectional pr<strong>of</strong>iles in <strong>Phangnga</strong> <strong>Bay</strong> ....................................... 5<br />
Mean annual rainfall in the Upper South. Thail<strong>and</strong>. 1969-1978 . ........................... 6<br />
Tapi-Phum Duang River Watershed. Upper South. Thail<strong>and</strong> .............................. 7<br />
Project boundaries <strong>and</strong> locations <strong>of</strong> large-scale use ..................................... 9<br />
Monthly river discharge to <strong>Ban</strong> <strong>Don</strong> <strong>Bay</strong> (JICA 1984) .................................. 10<br />
Catchment areas <strong>of</strong> rivers in the Upper South. Thail<strong>and</strong> ................................. 11<br />
Sampling stations <strong>and</strong> depth contours in <strong>Phangnga</strong> <strong>Bay</strong> . ................................. 14<br />
Sampling stations for DOF near <strong>Ban</strong> <strong>Don</strong> <strong>Bay</strong>: stations 81. 82 <strong>and</strong> 83 in 1985 ..................<br />
Monthly distribution <strong>of</strong>: dissolved oxygen. phosphorous. nitrate <strong>and</strong> nitrite at stations<br />
15<br />
81. 82<strong>and</strong>83in1985 ....................................................... 16<br />
The site <strong>of</strong> cockle seedbed survey (DO F 1986) . ...................................... 17<br />
General soil types <strong>of</strong> the Upper South. Thail<strong>and</strong> . ..................................... 18<br />
Coral quality in the isl<strong>and</strong>s <strong>of</strong> <strong>Ban</strong> <strong>Don</strong> <strong>Bay</strong> ......................................... 27<br />
Some protected areas in the Upper South. Thail<strong>and</strong> . ................................... 29<br />
Some tourist spots in Surat Thani <strong>and</strong> <strong>Phangnga</strong>IKrabi . ................................. 38<br />
Comparison <strong>of</strong> Non-Thai visitors with total visitors at KO Samui. 1980-1984 . .................. 39<br />
Forecast vs . actual volume <strong>of</strong> tourists at Phuket. 1981-2000 . ............................. 41<br />
Forecasts on the number <strong>of</strong> hotel guests in the Upper South. Thail<strong>and</strong> ....................... 41<br />
Comparison <strong>of</strong> average hotel occupancy rates at Phuket. 1985 . ............................ 42<br />
Comparison <strong>of</strong> tourism volume <strong>of</strong> Phuket <strong>and</strong> <strong>Phangnga</strong> <strong>Bay</strong> NP. 1981-1985 . .................. 44<br />
Legislative administration <strong>of</strong> the coastal area ........................................ 60<br />
Key sector-specific coastal resources issues/constraints in the Upper South. Thail<strong>and</strong> .............. 66<br />
Key intersectoral conflicts resulting in coastal degradation in the Upper South. Thail<strong>and</strong> ........... 66<br />
Conceptual framework for CRM planning in the Upper South. Thail<strong>and</strong>. 1987-1988 . ............. 70<br />
Content <strong>of</strong> management planning in the Upper South. Thail<strong>and</strong>. 1987.1988 . ................... 70<br />
Process for planning policies for CRM . ............................................ 71<br />
Process for protected arealnational park management . .................................. 71<br />
Process for specific issues. actions <strong>and</strong> responsibilities for implementing managemen? plans . ......... 72<br />
Important resources <strong>and</strong> management areas in <strong>Phangnga</strong> <strong>Bay</strong> . ............................. 73<br />
Important resources <strong>and</strong> management areas in <strong>Ban</strong> <strong>Don</strong> <strong>Bay</strong> <strong>and</strong> <strong>of</strong>fshore isl<strong>and</strong>s .................. 74<br />
vii
A.<br />
ASEAN<br />
BAAC<br />
BOD<br />
COD<br />
CPUE<br />
CRM<br />
CRMP<br />
DO<br />
DOF<br />
DOL<br />
DOLD<br />
DOMR<br />
DOPW<br />
DOTCP<br />
EEZ<br />
EGAT<br />
E IA<br />
EQSD<br />
GPP<br />
ICLARM<br />
IWDIMQI<br />
J ICA<br />
K.<br />
MPN<br />
NP<br />
NnWA<br />
ONEB<br />
PAT<br />
PMBC<br />
PMFS<br />
PMP<br />
REDECON<br />
RFD<br />
RTG<br />
TAT<br />
TlSTR<br />
UNESCO<br />
USAID<br />
USDA<br />
ws<br />
List <strong>of</strong> Acronyms <strong>and</strong> Abbreviations<br />
Amphoe (meaning second-order administrative district)<br />
Association <strong>of</strong> Southeast Asian Nations<br />
<strong>Ban</strong>k <strong>of</strong> Agriculture <strong>and</strong> Agricultural Cooperatives<br />
Biological oxygen dem<strong>and</strong><br />
Chemical oxygen dem<strong>and</strong><br />
Catch per unit effort<br />
Coastal resources management<br />
Coastal Resources Management Project<br />
Dissolved oxygen<br />
Department <strong>of</strong> Fisheries<br />
Department <strong>of</strong> Labor<br />
Department <strong>of</strong> L<strong>and</strong> Development<br />
Department <strong>of</strong> Mineral Resources<br />
Department <strong>of</strong> Public Works<br />
Department <strong>of</strong> Town <strong>and</strong> Country Planning<br />
Exclusive Economic Zone<br />
Electricity Generating Authority <strong>of</strong> Thail<strong>and</strong><br />
Environmental Impact Assessment<br />
Environmental Quality St<strong>and</strong>ard Division<br />
Gross Provincial Product<br />
lnternational <strong>Center</strong> for Living Aquatic Resources Management<br />
Industrial Works DepartmentIMinistry <strong>of</strong> Industry<br />
Japan lnternational Cooperation Agency<br />
Khlong (meaning river)<br />
Most Probable Numbers<br />
National Park<br />
Navigation in Thai Territorial Waters Act<br />
Office <strong>of</strong> the National Environment Board<br />
Petroleum Authority <strong>of</strong> Thail<strong>and</strong><br />
Phuket Marine Biological <strong>Center</strong><br />
Phuket Marine Fisheries Station<br />
Phuket Master Plan<br />
Resources <strong>and</strong> Development Consultant Limited<br />
Royal Forestry Department<br />
Royal Thai Government<br />
Tourism Authority <strong>of</strong> Thail<strong>and</strong><br />
Thail<strong>and</strong> Institute <strong>of</strong> Scientific <strong>and</strong> Technological Research<br />
United Nations Educational, Scientific <strong>and</strong> Cultural Organization<br />
United States Agency for International Development<br />
United States Department <strong>of</strong> Agriculture<br />
Wildlife Sanctuary<br />
viii
Acknowledgements<br />
The following are the authors <strong>of</strong> the different chapters <strong>of</strong> this pr<strong>of</strong>ile <strong>and</strong> their respective<br />
institutional affiliations:<br />
Asian Institute <strong>of</strong> Technology: Dr. Apisit Eiumnoh<br />
Chulalongkorn University: Dr. Manuwadi Hungspreugs (Department <strong>of</strong> Marine Science,<br />
Faculty <strong>of</strong> Science)<br />
DOF: Niphond Haemaprasit (Brackishwater Fisheries Division); Prawin Limpsaichol<br />
(PMBC); Somporn Lohsawatdikul<br />
DOLD: Dr. Pisoot Vijarnsorn<br />
ICLARM: James N. Paw <strong>and</strong> Dr. Alan T. White<br />
Kasetsart University: Dr. Sanit Aksornkoae (Faculty <strong>of</strong> Forestry); Dr. Choompol<br />
Ngampongsai<br />
Mahidol University: George A. Attig; Shutima Ounock; Dr. Subarn Panvisavas; Praguyrut<br />
Sukumalachart; Winai Weerawattananon; <strong>and</strong> Wilasinee Wongprasert<br />
ONEB: Sirikul Bunpapong; Robert Dobias; Nisakorn Kositratana; <strong>and</strong> Arthorn<br />
Suphapodok<br />
SEATEC: James W. Evans<br />
Thammasart University: Teerayut Poopetch<br />
The authors are greatly indebted to the Royal Thai Government for providing the<br />
necessary assistance through the following ministries <strong>and</strong> departments:<br />
Ministry <strong>of</strong> Agriculture <strong>and</strong> Cooperatives<br />
Department <strong>of</strong> Fisheries (DOF)<br />
Brackishwater Fisheries Division<br />
Marine Fisheries Division<br />
Phuket Marine Biological <strong>Center</strong> (PMBC)<br />
Phuket Marine Fisheries Station (PMFS)<br />
Department <strong>of</strong> L<strong>and</strong> Development (DOLD)<br />
Royal Forestry Department (RFD)<br />
Ministry <strong>of</strong> Interior<br />
Department <strong>of</strong> Labor (DOL)<br />
Deparlment <strong>of</strong> Public Works (DOPW)<br />
Department <strong>of</strong> Town <strong>and</strong> Country Planning (DOTCP)<br />
Ministry <strong>of</strong> Industry<br />
Department <strong>of</strong> Mineral Resources (DOMR)<br />
Industrial Works Department<br />
Hydrographic Department, Royal Thai Navy<br />
Ministry <strong>of</strong> University Affairs<br />
Chulalongkorn University, Department <strong>of</strong> Marine Science, Faculty <strong>of</strong> Science<br />
Kasetsart University. Faculty <strong>of</strong> Fisheries<br />
Mahidol University, Faculty <strong>of</strong> Environment <strong>and</strong> Resource Studies <strong>and</strong> Faculty <strong>of</strong>
Social Sciences <strong>and</strong> Humanities<br />
Prince <strong>of</strong> Songkla University, Department <strong>of</strong> Aquatic Science, Faculty <strong>of</strong> Science<br />
Srinakharinwirot University, Department <strong>of</strong> Aquatic Science<br />
The directors, commissioners, executive <strong>of</strong>ficers <strong>and</strong> personnel <strong>of</strong> the following<br />
institutions cooperated in making available all required information <strong>and</strong> data <strong>and</strong> in spending<br />
their valuable time with some <strong>of</strong> the authors:<br />
<strong>Ban</strong>k <strong>of</strong> Agriculture <strong>and</strong> Agricultural Cooperatives (BAAC)<br />
Japan International Cooperation Agency (JICA)<br />
Office <strong>of</strong> the National Environment Board (ONEB)<br />
Resources <strong>and</strong> Development Consultant Limited (REDECON)<br />
Thail<strong>and</strong> Institute <strong>of</strong> Scientific <strong>and</strong> Technological Research (TISTR)<br />
Tourism Authority <strong>of</strong> Thail<strong>and</strong> (TAT)<br />
Thanks are also due ICLARM: its Director General, Dr. Ian R. Smith; Rachel Josue <strong>and</strong><br />
Eloisa Espiritu who typed the rnanuscri,pt; <strong>and</strong> Rachel Atanacio who prepared the figures <strong>and</strong><br />
maps.<br />
Gratitude is extended to the pr<strong>of</strong>ile reviewers: Dr. John A. Dixon (Environment <strong>and</strong><br />
Policy Institute; East-West <strong>Center</strong>); Mr. Jay Maclean; Drs. Daniel Pauly; Roger Pullin; <strong>and</strong> Max<br />
Aguero (all four from ICLARM).<br />
The funds for the project <strong>and</strong> the publication <strong>of</strong> this pr<strong>of</strong>ile were made available by<br />
USAID.
Forewords<br />
The coastal zone <strong>of</strong> Thail<strong>and</strong> with a 2,600-km coastline is very rich in natural resources<br />
which include fisheries, coral reefs, mangrove forests, beaches <strong>and</strong> mineral deposits. Over the<br />
past decade, rapid increases in population <strong>and</strong> human activities along the coastal areas have<br />
resulted in degradation <strong>of</strong> these valuable natural resources. Many areas have already<br />
experienced the effects <strong>of</strong> water pollution, depletion <strong>of</strong> mangroves, overgrowth <strong>of</strong> urban<br />
communities <strong>and</strong> other negative consequences.<br />
As indicated by the results <strong>of</strong> a recent Upper South Regional Planning Study by the<br />
Japan lnternational Cooperation Agency (JICA), the development potentials <strong>of</strong> the area are<br />
great <strong>and</strong> that many <strong>of</strong> the activities rely on the use <strong>of</strong> coastal resources. This gives rise to the<br />
need for a plan to guide the management <strong>of</strong> coastal resources utilization that will allow<br />
sustainable development.<br />
Thail<strong>and</strong> is a participant to the Association <strong>of</strong> Southeast Asian Nations (ASEAN)-United<br />
States (US) Coastal Resources Management Project (CRMP). The project, which was initiated<br />
in June 1986, is being carried out in <strong>Ban</strong> <strong>Don</strong> <strong>and</strong> <strong>Phangnga</strong> <strong>Bay</strong>s. A project team was formed,<br />
consisting <strong>of</strong> local experts who conducted preliminary field investigations in the pilot site in July<br />
1986. The field findings <strong>and</strong> other data from secondary sources were collated <strong>and</strong> analyzed.<br />
The coastal environmental pr<strong>of</strong>ile <strong>of</strong> <strong>Ban</strong> <strong>Don</strong> <strong>Bay</strong> <strong>and</strong> <strong>Phangnga</strong> <strong>Bay</strong>, Thail<strong>and</strong> is the<br />
synthesized result <strong>of</strong> the study.<br />
This publication is the first step towards rational management <strong>of</strong> the Upper South coastal<br />
zone. Recommendations for developing plans to sustain coastal resources use are presented. A<br />
Workshop on Project Environmental Pr<strong>of</strong>ile <strong>and</strong> Proposal Refinement held in Pattaya, Thail<strong>and</strong>,<br />
in October 1986 <strong>and</strong> subsequent discussions with government agencies initially helped in<br />
finalizing the draft <strong>of</strong> this pr<strong>of</strong>ile.<br />
It gives me great satisfaction to present this book to coastal resources scientists,<br />
experts, managers, policymakers <strong>and</strong> other interested individuals <strong>and</strong> groups in the ASEAN <strong>and</strong><br />
other countries. I hope that this publication will be useful in the formulation <strong>of</strong> a viable<br />
management plan <strong>and</strong> as a reliable database.<br />
I wish to thank the project <strong>and</strong> other experts for their valuable contributions in bringing<br />
this pr<strong>of</strong>ile to a successful completion. Gratitude is expressed to Mr. James W. Evans for<br />
preparing the first draft <strong>of</strong> the pr<strong>of</strong>ile, <strong>and</strong> to Dr. Suthirak Sujarittanon for helping review it. I wish<br />
to extend my sincere appreciation to the technical <strong>and</strong> support staff <strong>of</strong> the lnternational <strong>Center</strong><br />
for Living Aquatic Resources Management (ICLARM) <strong>and</strong> the Office <strong>of</strong> the National<br />
Environment Board (ONEB) for reviewing <strong>and</strong> editing the pr<strong>of</strong>ile.<br />
Gratitude is due the United States Agency for lnternational Development (USAID) <strong>and</strong><br />
the Royal Government <strong>of</strong> Thail<strong>and</strong>, without whose sponsorships, the study would never have<br />
been possible.<br />
Arthorn Suphapodok<br />
Thail<strong>and</strong> Project Director<br />
ASEAN-US Coastal Resources<br />
Management Project
The coastal waters <strong>of</strong> Southeast Asian countries have some <strong>of</strong> the world's richest<br />
ecosystems characterized by extensive coral reefs <strong>and</strong> dense mangrove forests. Endowed with<br />
warm tropical climate <strong>and</strong> high rainfall, these waters are further enriched with nutrients from l<strong>and</strong><br />
which enable them to support a wide diversity <strong>of</strong> marine life. Because economic benefits could<br />
be derived from them, the coastal zone in these countries are heavily populated. Over 7ooA <strong>of</strong><br />
the population in the region live in coastal areas which have been recently characterized by<br />
high-level resource exploitation. This situation became apparent during the last two decades<br />
when population pressure <strong>and</strong> associated economic activities have increased considerably.<br />
Large-scale destruction <strong>of</strong> the region's valuable resources has caused serious degradation <strong>of</strong><br />
the environment, thus affecting the economic life <strong>of</strong> the coastal inhabitants. This lamentable<br />
situation is mainly the result <strong>of</strong> ineffective or poor management <strong>of</strong> the coastal resources.<br />
It is essential to consider coastal resources as valuable assets that should be utilized on<br />
a sustainable basis. Unisectoral overuse <strong>of</strong> some resources has caused grave problems.<br />
lndiscriminate logging <strong>and</strong> mining in upl<strong>and</strong> areas might have brought large economic benefits<br />
to companies undertaking these activities <strong>and</strong>, to a certain extent, increased government<br />
revenues, but could prove detrimental to lowl<strong>and</strong> activities such as fisheries, aquaculture <strong>and</strong><br />
coastal tourism dependent industries. Similarly, unregulated fishing efforts <strong>and</strong> the use <strong>of</strong><br />
destructive fishing methods, such as mechanized push-nets <strong>and</strong> dynamiting, have caused<br />
serious destruction <strong>of</strong> fish habitats <strong>and</strong> reduction <strong>of</strong> fish stocks. lndiscriminate cutting <strong>of</strong><br />
mangroves for aquaculture, fuel wood, timber <strong>and</strong> the like have brought temporary gains in fish<br />
production, fuel wood <strong>and</strong> timber supply but losses in nursery areas <strong>of</strong> commercially important<br />
fish <strong>and</strong> shrimp, coastal erosion <strong>and</strong> l<strong>and</strong> accretion.<br />
The coastal zone <strong>of</strong> most nations in ASEAN are subjected to increasing population <strong>and</strong><br />
economic pressures manifested by a variety <strong>of</strong> coastal activities, notably, fishing, coastal<br />
aquaculture, waste disposal, salt-making, tin mining, oil drilling, tanker traffic, rural construction<br />
<strong>and</strong> industrialization. This situation is aggravated by the exp<strong>and</strong>ing economic activities<br />
attempting to uplift the st<strong>and</strong>ard <strong>of</strong> living <strong>of</strong> coastal people, the majority <strong>of</strong> which live below the<br />
<strong>of</strong>ficial poverty line.<br />
Some ASEAN nations have formulated regulatory measures for their coastal resources<br />
management (CRM) such as the issuance <strong>of</strong> permits to fishing, logging, mangrove harvesting,<br />
etc. However, most <strong>of</strong> these measures have not proven effective due partly to enforcement<br />
failure <strong>and</strong> largely to lack <strong>of</strong> support for the communities concerned.<br />
Experiences in CRM in developed nations suggest the need for an integrated,<br />
interdisciplinary <strong>and</strong> multisectoral approach in developing management plans providing a course<br />
<strong>of</strong> action usable for daily management <strong>of</strong> the coastal areas.<br />
The ASEAN-US CRMP arose from the existing CRM problems. Its goal is to increase<br />
existing capabilities within ASEAN nations for developing <strong>and</strong> implementing CRM strategies.<br />
The project, which is funded by USAlD <strong>and</strong> executed by ICLARM, attempts to attain its goals<br />
through these activities:<br />
Analyzing, documenting <strong>and</strong> disseminating information on trends in coastal resources<br />
development;<br />
Increasing awareness <strong>of</strong> the importance <strong>of</strong> CRM policies <strong>and</strong> identifying, <strong>and</strong> where<br />
possible, strengthening existing management capabilities;<br />
xii
Providing technical solutions to coastal resources use conflicts; <strong>and</strong><br />
Promoting institutional arrangements that bring multisectoral planning to coastal<br />
resources development.<br />
In addition to implementing training <strong>and</strong> information dissemination programs, CRMP also<br />
attempts to develop site-specific CRM plans to formulate integrated strategies that could be<br />
implemented in the prevailing conditions in each nation.<br />
Thail<strong>and</strong> has taken a major step in the conservation <strong>and</strong> protection <strong>of</strong> its valuable<br />
coastal resources by participating in the development <strong>of</strong> its CRM for the Upper South Region.<br />
The region, covering an area <strong>of</strong> about 52,600 km2, is situated at the upper part <strong>of</strong> the Malay<br />
Peninsula <strong>and</strong> comprises the provinces <strong>of</strong> Surat Thani, Phuket, <strong>Phangnga</strong> <strong>and</strong> a portion <strong>of</strong><br />
Krabi. But the main foci <strong>of</strong> activities are <strong>Ban</strong> <strong>Don</strong> <strong>Bay</strong> area in the Gulf <strong>of</strong> Thail<strong>and</strong> <strong>and</strong> <strong>Phangnga</strong><br />
<strong>Bay</strong> area in the Andaman Sea side.<br />
A reliable database from secondary sources, crucial to the formulation <strong>of</strong> a viable rnan-<br />
agement plan, was made available to the project <strong>of</strong> which this pr<strong>of</strong>ile is a product. This data-<br />
base was strengthened through a number <strong>of</strong> collective field surveys by an interdisciplinary team<br />
<strong>of</strong> scientists from Kasetsart University; Chulalongkorn University; Department <strong>of</strong> Fisheries<br />
(DOF); Phuket Marine Biological <strong>Center</strong> (PMBC); Department <strong>of</strong> L<strong>and</strong> Development (DOLD);<br />
Mahidol University; <strong>and</strong> ONEB <strong>of</strong> Thail<strong>and</strong> <strong>and</strong> with the assistance <strong>of</strong> the pr<strong>of</strong>essional staff <strong>of</strong><br />
ICLARM. These research efforts will ultimately lead to a practical CRM plan for the Upper<br />
South.<br />
xiii<br />
Chua Thia-Eng<br />
Project Coordinator<br />
ASEAN-US Coastal Resources<br />
Management Project
Introduction<br />
TEERAYUT POOPETCH AND JAMES W. EVANS<br />
A development planning study was carried out for the Upper South Region under JICA<br />
(JICA 1985) which has been designated by the Royal Thai Government (RTG) as one <strong>of</strong> the<br />
target regions for development. The government's initial Master Plan identified several potential<br />
areas for development, including coastal resources, but no consideration for CRM was made.<br />
ONEB, recognizing the need for integrated development <strong>and</strong> management <strong>of</strong> coastal<br />
resources, prepared a proposal for a CRM plan for the Upper South. The proposal, which<br />
identified <strong>Ban</strong> <strong>Don</strong> <strong>Bay</strong> <strong>and</strong> <strong>Phangnga</strong> <strong>Bay</strong> as the two key planning areas, was approved for<br />
inclusion in the ASEAN-US CRMP.<br />
This book presents a pr<strong>of</strong>ile <strong>of</strong> literature <strong>and</strong> a collation <strong>of</strong> available data for the<br />
preparation <strong>of</strong> CRM plans for <strong>Ban</strong> <strong>Don</strong> <strong>Bay</strong> <strong>and</strong> <strong>Phangnga</strong> <strong>Bay</strong>. Contained are information on<br />
their physical setting, natural <strong>and</strong> human resources, economic conditions <strong>and</strong> institutional<br />
framework. Existing constraints (e.g., lack <strong>of</strong> institutional coordination, adequate plans <strong>and</strong><br />
strategies) to effective management are also evaluated, <strong>and</strong> issues <strong>of</strong> special concern are<br />
identified. The preparation <strong>of</strong> these plans is the primary objective <strong>of</strong> the project. The plans are<br />
expected to serve as a practical guide in pursuing RTG activities related to the two areas'<br />
optimal "economic-cum-environmental" development.<br />
Recent trends <strong>of</strong> exploitation <strong>and</strong> importance <strong>of</strong> marine resources in Thail<strong>and</strong> show that<br />
the fisheries resources <strong>of</strong> the Gulf <strong>of</strong> Thail<strong>and</strong> have already passed maximum sustainable<br />
production. "Trash fish" now represent more than 40% <strong>of</strong> the total marine l<strong>and</strong>ings from Thai<br />
waters with up to 50% <strong>of</strong> the "trash fish" being juveniles <strong>of</strong> valuable fish <strong>and</strong> shrimp. In coastal<br />
areas, l<strong>and</strong> use patterns are changing. In the Eastern Seaboard, emphasis is on heavy<br />
industries, whereas in the Upper South, tourism <strong>and</strong> tin mining are <strong>of</strong> economic importance to<br />
Phuket <strong>and</strong> <strong>Phangnga</strong>. Aquaculture, particularly for shrimp, is being exp<strong>and</strong>ed in <strong>Ban</strong> <strong>Don</strong> <strong>and</strong><br />
is encroaching into the adjacent mangrove areas (TDRI 1987).<br />
The Thai fishing sector supplies about 23 kg <strong>of</strong> fish/person/year to a population <strong>of</strong> 52<br />
million. Marine capture fisheries account for over 90% <strong>of</strong> total fish production but many<br />
problems threaten the sustainability <strong>of</strong> the industry <strong>and</strong> the catch. Poverty <strong>and</strong> overfishing <strong>of</strong><br />
inshore fisheries resources have exacerbated the conflicts between small-scale fishermen <strong>and</strong><br />
large trawlers. Further, the declaration <strong>of</strong> the Exclusive Economic Zones (EEZ) by neighboring<br />
countries has reduced Thai fishing grounds. Thus, there is a need in Thail<strong>and</strong> for management<br />
<strong>of</strong> all coastal resources such as estuaries, mangroves <strong>and</strong> coral reefs.<br />
It is important to formulate a CRM plan for <strong>Ban</strong> <strong>Don</strong> <strong>Bay</strong> before development goes too<br />
far. This area is rich in natural resources which have vast development potential. The coastal<br />
resources appear to be in relatively good condition at present, but this is expected to change<br />
because <strong>of</strong> population pressures <strong>and</strong> l<strong>and</strong>-based development. This bay receives run<strong>of</strong>f from<br />
one <strong>of</strong> the largest catchments in the Upper South so that water resource development may alter<br />
xiv
the bay's hydrological <strong>and</strong> water quality conditions in the future. Surat Thani, for instance, is one<br />
<strong>of</strong> the largest urban zones. Continued development here will increase change in l<strong>and</strong> use<br />
patterns, pollution loads <strong>and</strong> coastal resources exploitation pressures.<br />
Although on the west <strong>of</strong> <strong>Phangnga</strong> <strong>Bay</strong> are ecological characteristics similar to most<br />
other areas in the Upper South, it harbors the largest intact mangrove forest in the country.<br />
Wildlife is an important component in <strong>Phangnga</strong> National Park which also protects part <strong>of</strong><br />
this mangrove area. Important coastal resources abound with fertile fishing grounds <strong>and</strong><br />
aquaculture areas. Also, tourism is an important sector that could be sustained <strong>and</strong> enhanced.<br />
Although population density is high, the bay's population has a traditional life-style <strong>and</strong><br />
shares similar cultural <strong>and</strong> life values with the other areas. The economic status <strong>and</strong> structure <strong>of</strong><br />
the populace are higher than those <strong>of</strong> the general Thai levels where resources are typically<br />
based on agriculture, fisheries, mining <strong>and</strong> industry.<br />
The CRM plan will provide the necessary background information for the preparation <strong>of</strong> a<br />
macrolevel plan for the Upper South coastal zone management. Data on the interaction1<br />
relationship <strong>of</strong> coastal resources <strong>and</strong> the various uses by people will assist in the formulation <strong>of</strong><br />
CRM guidelines applicable in the Upper South <strong>and</strong> to a degree, throughout the ASEAN region.
Chapter 1<br />
The Upper South: Physical Setting <strong>and</strong> L<strong>and</strong> Use<br />
SIRIKUL BUNPAPONG AND JAMES N. PAW<br />
Location, Topography <strong>and</strong> Geology<br />
The Upper South Region has a total area <strong>of</strong> about 52,600 km2 <strong>and</strong> is situated on the<br />
upper part <strong>of</strong> the Malay Peninsula. The region faces the Gulf <strong>of</strong> Thail<strong>and</strong> on the east <strong>and</strong> the<br />
Andaman Sea on the west. The area <strong>of</strong> study covers the coastal areas between Surat Thani in<br />
the northeast <strong>and</strong> <strong>Phangnga</strong>lPhuket in the southwest. The project site comprises the provinces<br />
<strong>of</strong> Surat Thani, <strong>Phangnga</strong> <strong>and</strong> a portion <strong>of</strong> Krabi but the main foci <strong>of</strong> activities are <strong>Ban</strong> <strong>Don</strong> <strong>Bay</strong><br />
area in the Gulf <strong>of</strong> Thail<strong>and</strong> <strong>and</strong> <strong>Phangnga</strong> <strong>Bay</strong> area in the Andaman Sea side (Fig. 1 .I).<br />
Two parallel ranges are situated on the Upper South Region (Fig. 1.2). The Phuket<br />
Range runs southward along the peninsula from Khlong (K. from here, <strong>and</strong> which means "river")<br />
Khura Buri, close to the west coast <strong>and</strong> south to Phuket Isl<strong>and</strong> descending into the Andaman<br />
Sea. The range is roughly 400 km long <strong>and</strong> 25-75 km wide. The mountains reach heights <strong>of</strong> 600<br />
to 900 m.<br />
Located about 100 krn from Phuket Range to the east is Nakhon Range. The latter<br />
stretches from the southwesternmost <strong>of</strong> Satun to the north where the mountain chains lie under<br />
the Gulf <strong>of</strong> Thail<strong>and</strong> marked by a few isl<strong>and</strong>s such as Samui <strong>and</strong> Phangan. The mountains<br />
between Surat Thani <strong>and</strong> Nakhon Si Thammarat reach heights <strong>of</strong> 1,300-1,400 m <strong>and</strong> the 'range<br />
between Thung Song <strong>and</strong> Trang reaches 500-800 m only. The Central Lowl<strong>and</strong>, a flat l<strong>and</strong><br />
forming the watershed <strong>of</strong> the Tapi River System, is situated between the two ranges (JICA<br />
1985). The topography <strong>and</strong> cross-sectional pr<strong>of</strong>iles <strong>of</strong> the study area are schematically shown in<br />
Fig. 1.3-1.6 <strong>and</strong> the typical geology is in Table 1 .l.<br />
The Upper South Region lies in a rich tin-bearing granite belt which intrudes folded<br />
sedimentary rocks along the length <strong>of</strong> the upper Malay Peninsula. This granite belt extends from<br />
Indonesia to the north in Thail<strong>and</strong> where sinistral displacement occurs southwest along K. Marui<br />
Fault. There are two major faults occurring in the north-south <strong>and</strong> northeast-southwest directions<br />
which strongly influence the topography <strong>of</strong> the region. Sedimentary rocks, particularly remnants<br />
<strong>of</strong> Permian limestones, form steep-sided hills <strong>and</strong> ridges which are extensive in the west coast.<br />
Along <strong>Phangnga</strong> <strong>Bay</strong>, some <strong>of</strong> these large limestone ridges display a well-marked karst<br />
topography. Lowl<strong>and</strong>s, particularly along the coast <strong>and</strong> the central basin, are composed<br />
generally <strong>of</strong> alluvial deposits. Detrital materials along beaches contain economically important<br />
minerals such as tin, rare-earth minerals <strong>and</strong> quartz. Most <strong>of</strong> these minerals are derived from<br />
erosion <strong>of</strong> coastal mineral-bearing granitic formations. Marine sediments, on the other h<strong>and</strong>, are
Swat Thani<br />
h-<br />
Nokhon Si<br />
Thammarat \<br />
I<br />
Fig. 1 .l. (Left) The Upper South Region 01 Thail<strong>and</strong> located on the<br />
upper part <strong>of</strong> the Malay Peninsula.<br />
Fig. 1.2. (Above) Mountain ranges in the Upper South, Thail<strong>and</strong><br />
(JICA 1985).
S -<br />
N<br />
<strong>Ban</strong> <strong>Don</strong> <strong>Bay</strong><br />
Q<br />
*<br />
0<br />
0 o<br />
A<br />
5 10 15km<br />
L I " I<br />
I I I<br />
99O15' 99"301 99"45'<br />
Fig. 1.3. Study site in <strong>Ban</strong> <strong>Don</strong> <strong>Bay</strong> with the cross.jectional areas marked.<br />
o-+&-<br />
Lowl<strong>and</strong> I zfil~nulond 1 Tidal llat Mudflat ; sea<br />
1-1 I I<br />
IS! / I<br />
I!=<br />
Cross section A-A'<br />
Cross section 0-8'<br />
I 1<br />
I I<br />
Cross section C-C' Y<br />
Cross section D-d '---I<br />
Fig. 1.4. Cross-sectional pr<strong>of</strong>iles <strong>of</strong> the coasts along <strong>Ban</strong> <strong>Don</strong> <strong>Bay</strong>.<br />
Sichon<br />
0
Table 1.1. Geology <strong>of</strong> the Upper South Region, Thail<strong>and</strong> (modified after JlCA 1985)<br />
Area Typical geology<br />
Surat Thani Chiang Mai loams<br />
Central Lowl<strong>and</strong> Mountainous soils derived from igneous (granitic) <strong>and</strong><br />
metamorphic (Khuntan s<strong>and</strong>y loams) rocks <strong>and</strong> soils<br />
from shales, conglomerates <strong>and</strong> limestone (Pak Chong<br />
loams)<br />
<strong>Phangnga</strong> coastal strip Recent alluvial soils <strong>and</strong> lowl<strong>and</strong>s<br />
Krabi coastal strip Same as Central Lowl<strong>and</strong> area<br />
Phuket Recent alluvial soils <strong>and</strong> those from granites, s<strong>and</strong>stone,<br />
schist, shale <strong>and</strong> gneiss, including limestone<br />
Fig. 1.5. Study site in <strong>Phangnga</strong> <strong>Bay</strong> with the cross-sectional areas marked.
Cross sectlon A-A'<br />
Uplond Sea I<br />
I<br />
m I , I I I ,<br />
Tidol flat<br />
Cross section 0-8'<br />
Cross section C-C'<br />
I<br />
u<br />
44-<br />
n I Uplond<br />
E I<br />
;I I<br />
* I<br />
5 1<br />
WO- Stsapl<strong>and</strong> upl<strong>and</strong><br />
400 -<br />
300-<br />
0 1 2 3 4 5 6 7 8 9 10 11 12 13 14 15 16 17 I0 19 20 21 22 23 24 25 28km<br />
Cross section D-D'<br />
Fig. 1.6. Cross-sectional pr<strong>of</strong>iles <strong>of</strong> the coasts along <strong>Phangnga</strong> <strong>Bay</strong>.<br />
I<br />
I<br />
!<br />
Upl<strong>and</strong>
mostly composed <strong>of</strong> mud, s<strong>and</strong>, silt <strong>and</strong> gravel which probably came from fluvial sediment<br />
deposits as well as from weathering <strong>and</strong> erosion <strong>of</strong> rock formations along the coast (Siripong<br />
1987).<br />
Climate<br />
The climate is inte.rmediate between equatorial <strong>and</strong> tropical monsoon types <strong>and</strong> is<br />
favored by constant high temperature without extremes <strong>of</strong> heat; high rainfall with little risk <strong>of</strong><br />
monsoon failure; <strong>and</strong> a diy season <strong>of</strong> moderate severity.<br />
The topography <strong>of</strong> the region with its mountain chains running along the peninsula has<br />
considerable effect on the climate especially on the rainfall distribution. Dry season is generally<br />
experienced in February <strong>and</strong> March on both the east <strong>and</strong> west coasts. In April, rainfall starts on<br />
the west coast due to the southwest monsoon <strong>and</strong> lasts from June to September. Dry season<br />
prevails until December. Rainfall on the east coasts is moderate at about 100 mmlmonth until<br />
the onset <strong>of</strong> the northeast monsoon in September. Precipitation intensifies up to 500 mm around<br />
November (Fig. 1.7). Although the rainfall patterns <strong>of</strong> Krabi <strong>and</strong> Phuket are <strong>of</strong> west coast type,<br />
precipitation is considerably lower than the average <strong>of</strong> Ranong <strong>and</strong> <strong>Phangnga</strong> (JICA 1985).<br />
n<br />
J F M A M J J A S O N D<br />
Month<br />
- Eost Coast<br />
Fig. 1.7. Mean annual rainfall in the Upper South, Thail<strong>and</strong>, 1969-1978.<br />
Mean monthly temperature ranges from 290C (sometimes up to 390C inl<strong>and</strong>), usually in<br />
the wettest month, to 33-350C, usually in April. Mean monthly minimum ranges from 200C in<br />
January to 240C in May. Inl<strong>and</strong> temperature may fall to 130C in January. Extremes at some<br />
sheltered inl<strong>and</strong> sites may be outside the 120C <strong>and</strong> 390C range, but coastal areas have more<br />
uniform temperatures.<br />
Catchment Area<br />
There are a number <strong>of</strong> catchment areas between Phuket Range <strong>and</strong> Nakhon Range.<br />
The Phum Duang River Basin is the largest, covering 6,125 km2, or 41% <strong>of</strong> the total catchment
area. This is followed by the Tapi River Basin covering about 5,460 km2 or 37% <strong>of</strong> the total<br />
catchment area (Fig. 1.8). The headwater <strong>of</strong> K. Phum Duang is situated in the west <strong>and</strong> drains<br />
mainly on the eastern slopes <strong>of</strong> Phuket Range with several substantial tributaries such as K.<br />
Saeng, K. Sok <strong>and</strong> K. Yan. From the south is K. Tapi which drains into an extended part <strong>of</strong> the<br />
Central Lowl<strong>and</strong> <strong>and</strong> the western slopes <strong>of</strong> Nakhon Range. The two main rivers join about 10<br />
km west <strong>of</strong> Surat Thani, forming an extended delta as they discharge into the Gulf <strong>of</strong> Thail<strong>and</strong>.<br />
I I I 1<br />
98%' 99bd 93'30' IOOW<br />
Fig. 1.8. Tapi-Phum Duang River Watershed, Upper South, Thail<strong>and</strong>.<br />
L<strong>and</strong> Use <strong>and</strong> Agriculture<br />
Present l<strong>and</strong> use comprises cultivated areas <strong>of</strong> tree crops <strong>and</strong> paddies covering 23% <strong>of</strong><br />
the total l<strong>and</strong> area. Low intensity l<strong>and</strong> use areas cover 41% <strong>and</strong> forested areas, 36%. Most <strong>of</strong><br />
the forested areas are in the highl<strong>and</strong>s <strong>and</strong> need to be reforested <strong>and</strong>/or rehabilitated for<br />
environmental protection or reserved for future use. These areas also include mangrove forests<br />
along the coastal zone. Cultivated l<strong>and</strong> will most likely remain at 23% <strong>of</strong> the total area but uses<br />
will be intensified <strong>and</strong> diversified. The replacement <strong>of</strong> old rubber trees by high-yielding varieties<br />
<strong>and</strong> the introduction <strong>of</strong> irrigation in the paddy areas are likely in the near future.<br />
The Upper South Region is endowed with a large area <strong>of</strong> unused or underused l<strong>and</strong><br />
which is estimated to cover about 6,900 km2 or 66% <strong>of</strong> the l<strong>and</strong> area suitable for agricultural
development. Water resources are available in most <strong>of</strong> the areas. The most common crops are<br />
cash crops <strong>of</strong> rubber <strong>and</strong> oil palm, which are limited to such tropical zones.<br />
The region contributes a substantial amount to national production. Crops contribute<br />
more than 10% <strong>of</strong> the national production in oil palm, cashew nuts, long beans, rubber,<br />
rambutan, c<strong>of</strong>fee <strong>and</strong> coconut. Forestry production, although declining, exceeds more than 1 Ooh<br />
<strong>of</strong> the national total (Table 1.2 <strong>and</strong> Fig. 1.9).<br />
The region contributes a substantial amount to national production. Crops contribute<br />
more than 10% <strong>of</strong> the national production in oil palm, cashew nuts, long beans, rubber,<br />
rambutan, c<strong>of</strong>fee <strong>and</strong> coconut. Forestry production, although declining, exceeds more than 10%<br />
<strong>of</strong> the national total (Table 1.2 <strong>and</strong> Fig. 1.9).<br />
Table 1.3 summarizes the results <strong>of</strong> l<strong>and</strong> use studies in 1973, 1980 <strong>and</strong> 1982 as<br />
Table 1.2. Summary <strong>of</strong> agricultural, forestry,<br />
fisheries, mineral <strong>and</strong> tourist-based production in<br />
the Upper South. Thail<strong>and</strong>. (See footnotes on year<br />
or period covered.)<br />
Items Percentage value <strong>of</strong> national<br />
total resources/products<br />
Cropsa<br />
Oil palm<br />
Cashew nuts<br />
Sataw<br />
Rubber<br />
Rambutan<br />
C<strong>of</strong>fee<br />
Lancet<br />
Coconut<br />
Durian<br />
Jackfruit<br />
Tangerine<br />
Forestry product&<br />
Firewood<br />
Charcoal<br />
Non-teak trees<br />
Marine fish catchc<br />
Mineral productsd<br />
Tantalite<br />
Zircon<br />
Tin concentrates<br />
Monazite<br />
Xenotime<br />
Lignite<br />
Gypsum<br />
Antimony ore<br />
Columbite<br />
Barite<br />
Flourite<br />
Touristse<br />
Domestic<br />
Foreign<br />
Sources:<br />
"ource: Office <strong>of</strong> Southern Agricultural Cooperatives<br />
(1981 1.<br />
b~tatistics from the Department <strong>of</strong> Royal Forcstry<br />
'~ourcc: 1982 catch stafistics from TDRI (1987).<br />
d~tatistics from JICA (1985) cover the period<br />
from 1976 to 1980.<br />
e~latistics from the Tourism Authority <strong>of</strong> Thail<strong>and</strong>.<br />
conducted by the Resources <strong>and</strong> Development<br />
Consultant Limited (REDECON 1975), DOLD<br />
(1 980) <strong>and</strong> JlCA (1985). Only the essential<br />
types <strong>of</strong> l<strong>and</strong> use are indicated to show trends.<br />
It appears that within the agricultural sector,<br />
rubber is by far the most widespread crop in the<br />
upl<strong>and</strong> areas <strong>of</strong> the four provinces. Paddy rice<br />
is the second major crop gown in the region,<br />
with the greatest concentration located in Surat<br />
Thani. Although there was some decrease in<br />
gross area for paddy rice in three provinces, the<br />
overall agricultural area for each <strong>of</strong> the<br />
provinces increased from 1973 to 1982. The<br />
figures on forest l<strong>and</strong> during the same period<br />
are variable <strong>and</strong> difficult to explain. However,<br />
such variations could be due to differences in<br />
scale <strong>and</strong> lack <strong>of</strong> field information to distinguish<br />
areas with mixed features, e.g., secondary1<br />
forest mixed with tree crops (JICA 1985). Man-<br />
grove areas are being reduced markedly from<br />
year to year. Idle l<strong>and</strong>s suited for agriculture<br />
showed variability but this could be due to<br />
shifting availability <strong>of</strong> labor <strong>and</strong> capital to<br />
sustain cultivation <strong>of</strong> these areas.<br />
Mineral <strong>and</strong> Energy Resources<br />
The Upper South Region is the largest<br />
tin mining area in Thail<strong>and</strong>. Tin mining provides<br />
the highest foreign exchange earning for the<br />
region, constituting 64.5% <strong>of</strong> the national tin<br />
production from 1976 to 1980 (see Table 1.2).<br />
Production has declined since then due to low<br />
price <strong>and</strong> oversupply in the world market (TDRI<br />
1987). In 1983, 5goA <strong>of</strong> the total national<br />
production <strong>of</strong> tin concentrates came from the<br />
Upper South with <strong>Phangnga</strong> <strong>and</strong> Phuket<br />
producing 15.3% <strong>of</strong> the total regional production<br />
mainly from <strong>of</strong>fshore mining (TDRI 1986).
Drainage system<br />
Chapter 2<br />
Natural Resources <strong>and</strong> Environment<br />
Surface Water Resources<br />
N ISAKORN KOSITRATANA<br />
The majority <strong>of</strong> surface freshwater discharge to the estuarine zone <strong>of</strong> <strong>Ban</strong> <strong>Don</strong> <strong>Bay</strong> is<br />
from the Tapi-Phum Duang River Watershed (Fig. 1.8 <strong>and</strong> Fig. 2.1). Several smaller coastal<br />
watersheds (Fig. 2.2 <strong>and</strong> Table 2.1) also contribute to the total freshwater run<strong>of</strong>f to the bay. The<br />
Tapi-Phum Duang River System includes several subwatersheds in the peninsular mountains <strong>of</strong><br />
Surat Thani which form a drainage system flowing to the north <strong>and</strong> northeast <strong>and</strong> discharging<br />
into the bay in Amphoe (A. from here, <strong>and</strong> which means "second-order administrative district")<br />
Muang, Surat Thani.<br />
The surface freshwater discharge to the <strong>Phangnga</strong> <strong>Bay</strong> planning area is from several<br />
relatively small coastal watersheds in <strong>Phangnga</strong> <strong>and</strong> Krabi Provinces. The most significant flow<br />
comes from K. <strong>Phangnga</strong>, K. Bo San <strong>and</strong> K. Marui in <strong>Phangnga</strong> Province, <strong>and</strong> K. Krabi <strong>and</strong> K.<br />
Tom in Krabi (Fig. 2.2 <strong>and</strong> Table 2.1).<br />
sOO r 0---o Topi<br />
450 1 Phum Duang<br />
A<br />
Month<br />
Fig. 2.1. Monthly river discharge to <strong>Ban</strong> <strong>Don</strong> <strong>Bay</strong> (JICA<br />
1984).
Table 2.1. Hydrological characteristics <strong>of</strong> selected rivers in the Upper South, Thail<strong>and</strong>, in 1984.<br />
Tha Krachai<br />
Taktrian<br />
Chaiya<br />
Phum Duang<br />
Saerrg<br />
Chong Lorn<br />
So k<br />
Yan<br />
Yan<br />
Mae Nam Ta Pi<br />
Tan<br />
Sang<br />
Ao Yan<br />
Tha Thong<br />
Mae Nam Trang<br />
Chi<br />
Kalasi Yai<br />
Larnphu La<br />
Fig. 2.2. Catchment areas <strong>of</strong> rivers in<br />
the Upper South, Thail<strong>and</strong>.<br />
No. River (Khlong) Catchment Discharge (m3Is) Ratio Annual run<strong>of</strong>f<br />
area(km2) Mean Minimum Maximum Maximum1 (million m3)<br />
Minimum<br />
Tha Krachai<br />
Takhian<br />
Chaiya<br />
Phum Duang<br />
Saeng<br />
Chong Lorn<br />
Sok<br />
Yan<br />
Yan<br />
Mae Narn Ta Pi<br />
Tan<br />
Sang<br />
Ao Yan<br />
Tha Thong<br />
Mae Narn Trang<br />
Chi<br />
Kalasi Yai<br />
Larnphu La<br />
Source: JlCA (1985).
The hydrological characteristics <strong>of</strong> the rivers in the Upper South are summarized in<br />
Table 2.1 <strong>and</strong> Fig. 2.1 <strong>and</strong> 2.2. The ratio <strong>of</strong> the maximum <strong>and</strong> minimum discharges appear to be<br />
extremely high in most rivers which implies that monthly discharges fluctuate according to<br />
seasonal precipitations. As shown in Table 2.1, K. Tapi shows a typical eastern regime since the<br />
upper watershed is found in eastern <strong>and</strong> central parts <strong>of</strong> the region. K. Phum Duang, however,<br />
shows a western regime because the headwater is in the west.<br />
Water quality<br />
A monitoring program <strong>of</strong> the lower K. Phum Duang has been developed as a cooperative<br />
effort between ONEB <strong>and</strong> the Industrial Works DepartmentIMinistry <strong>of</strong> Industry (IWDIMOI). The<br />
program monitoring includes chemical oxygen dem<strong>and</strong> (COD), conductivity, temperature, pH<br />
<strong>and</strong> dissolved oxygen (DO) at two sampling sites. The purpose <strong>of</strong> this monitoring is to determine<br />
the effects <strong>of</strong> wastewater discharges from the new Suratip Sri Talung Distillery Plant (EQSD<br />
1985). The distillery also initiated monitoring <strong>of</strong> the river water quality in 1986.<br />
The results <strong>of</strong> the monitoring, which show a large range in conductivity, are summarized<br />
in Table 2.2. This indicates the influx <strong>of</strong> freshwater during the rainy season while tidal infuence<br />
is apparent during dry season which results in brackishwater condition.<br />
A two-day nearshore water quality survey was carried out in 1984 at K. Boa Dan which<br />
discharges into <strong>Phangnga</strong> <strong>Bay</strong>. This study provides limited information on diurnal fluctuation <strong>of</strong><br />
water quality at the mouth <strong>of</strong> the river including some nutrient concentrations.<br />
In general, information on surface water quality is limited, but the most significant<br />
influence is that <strong>of</strong> silt from upl<strong>and</strong> activities. Also, extreme fluctuations in salinity have<br />
implications for culture activities in the area.<br />
Table 2.2. Range <strong>of</strong> water quality parameters from K. Phum Duang, 1986.<br />
Month<br />
"""~ -"<br />
PH Temperature<br />
(OC)<br />
--- "" -?<br />
Jan 7.4-7.9 28 2-29 7<br />
Feb 7.1-7.8 27.1-30.4<br />
Mar 7.4-7.9 26.6-31.5<br />
Jun 7.0-7.8 26.7-29.5<br />
Source: Statistics from the Suratip Sri Talung Distillery Plant.<br />
Water uses<br />
Range<br />
conductivity<br />
(pm holcm)<br />
The beneficial uses <strong>of</strong> the waters can be categorized as follows:<br />
1. Upper watershed: village water supply; subsistence fisheries; small streamside<br />
irrigation.<br />
2. Flood plains: domestic water supply; subsistence fisheries; irrigation.<br />
3. Coastal zone: urban <strong>and</strong> domestic water supply; industrial water supply; commercial<br />
<strong>and</strong> artisanal fisheries <strong>and</strong> aquaculture.<br />
A major multipurpose dam-reservoir project, Chiew Larn, will enhance water resource<br />
use by hydroelectric power generation <strong>and</strong> irrigation development. The effects <strong>of</strong> Chiew Larn
<strong>and</strong> other planned damlreservoir projects on the salinity <strong>and</strong> hydrology <strong>of</strong> the <strong>Ban</strong> <strong>Don</strong> <strong>Bay</strong><br />
estuarine zone are yet to be assessed.<br />
The Upper South planning study included a sectoral report on water resources indicating<br />
that the Tapi-Phum Duang River System has potential for further water resource development.<br />
JlCA (1 985) recommended that this development also include measures for watershed<br />
protection, water management <strong>and</strong> fisheries development.<br />
L<strong>and</strong>-based water pollution sources<br />
Water pollution in <strong>Ban</strong> <strong>Don</strong> <strong>Bay</strong> is primarily due to wastewater from domestic rural <strong>and</strong><br />
urban sources, industries, mining <strong>and</strong> ports <strong>and</strong> from natural watershed sediment <strong>and</strong><br />
agricultural run<strong>of</strong>f. Some <strong>of</strong> the wastewater sources in Surat Thani Province are shown in Table<br />
2.3, while Table 2.4 gives such sources in <strong>Phangnga</strong> <strong>and</strong> Krabi.<br />
Table 2.3. List <strong>of</strong> wastewater sources in Surat Thani Province.<br />
A. Industrial sources<br />
1. Fish Mill Factory Co., Ltd.<br />
2. Num Surat Fish Mill<br />
3. <strong>Ban</strong> <strong>Don</strong> Fishery Co.. Ltd.<br />
4. Surat Thani Freezer<br />
5. Chao Pramong <strong>Ban</strong> <strong>Don</strong> Co., Ltd.<br />
6. Saa Horse Surat Thani Tr,ading Co.. Ltd.<br />
7. Yang Thai Pak Tai Go., Ltd.<br />
8. Huay Chuan Co., Ltd. (Surat Thani Branch)<br />
9. Taksin Palm (2521) Co., Ltd.<br />
10. Saha Sinka Yang Surat, Ltd.<br />
11. Pan Asia (1981) Co.. Ltd.<br />
12. United Surat Rubber Co., Ltd.<br />
13. Surat Seafood Co., Ltd.<br />
14. Muang Yang Sin Thai Co., Ltd.<br />
15. Seng Mui Para, Ltd.<br />
16. Huay Chuan Co., Ltd. (<strong>Ban</strong> Na San Branch)<br />
1'7. Yang Tai Tawee, Ltd.<br />
18. Suratip Sri Talung Distillery Plant<br />
0. Domestic sources: dense residential areas along:<br />
1. K. Tapi 4. K. Chanak<br />
2. K. Phum Duang 5. K. Kradae<br />
3. K. Phun Phin 6. K. <strong>Don</strong> Sak<br />
C. Hotel: Wang Tai Hotel<br />
D. Ports<br />
1. Fisheries ports<br />
a. lnner <strong>Ban</strong> <strong>Don</strong> Port<br />
b. <strong>Ban</strong> <strong>Don</strong> Private Ports<br />
c. Others in A. <strong>Don</strong> Sak. A. Kanchanadit.<br />
A. Tha Chana, etc.<br />
2. Commercial <strong>and</strong> passenger ports<br />
a. lnner <strong>Ban</strong> <strong>Don</strong> Port<br />
b. Ferry Port<br />
c. Tha Thong Port<br />
d. Na Thorn Port<br />
3. Oil fuel <strong>and</strong> LPG ports<br />
a. Petroleum Authority <strong>of</strong> Thail<strong>and</strong><br />
b. Caltex<br />
c. Shell<br />
d. Esso<br />
Table 2.4. List <strong>of</strong> wastewater sources in <strong>Phangnga</strong> <strong>and</strong> Krabi.<br />
- ., .. .-<br />
<strong>Phangnga</strong><br />
A. Industrial sources - no data (field survey needed)<br />
B. Domestic sources: dense residential areas along:<br />
1. K. <strong>Phangnga</strong><br />
2. K. Bo San<br />
3. K. Marui<br />
C. L<strong>and</strong> mining<br />
D. Hotel: <strong>Phangnga</strong> <strong>Bay</strong> Resort<br />
Krabi<br />
A. Industrial sources<br />
1. Saha Palm Oil Industry Co., Ltd.<br />
2. Siam Palm Oil <strong>and</strong> lndustry Co., Ltd.<br />
3. Thai Oil Industry <strong>and</strong> Suan Palm Co., Ltd.<br />
4. Muang Yang Sin Thai Co., Ltd.<br />
5. United Krabi Rubber Co., Ltd.<br />
6. Krabi Adin Go., Ltd.<br />
B. Domestic sources: dense residential areas along:<br />
1. Mouth <strong>of</strong> K. Krabi<br />
2. K. Tom<br />
C. Hotel: Wiang Thong Hotel<br />
D. Port: Krabi Port
Biology<br />
Marine Environment<br />
MANUWADI HUNGSPREUGS AND PRAWIN LIMPSAICHOL<br />
The distribution <strong>of</strong> plankton <strong>and</strong> benthic communities in the Gulf <strong>of</strong> Thail<strong>and</strong> was studied<br />
by the Marine Fisheries Laboratory <strong>and</strong> Exploratory Unit <strong>of</strong> DOF. Most <strong>of</strong> the studies on<br />
zooplankton concentrated on fish larvae <strong>and</strong> fish eggs. None were done in the nearshore zone<br />
<strong>of</strong> <strong>Ban</strong> <strong>Don</strong> <strong>Bay</strong>; the closest were done at Ang Thong Isl<strong>and</strong>, Surat Thani. Vibrio spp., coliform<br />
bacteria like Escherichia colidistribution in water, sediment <strong>and</strong> some marine organisms were<br />
studied in many coastal areas in the gulf (Saitanu et al. 1984a; 1984b). Total bacterial counts<br />
were 440 to 893,300 per ml <strong>of</strong> water samples <strong>and</strong> 3,000 to 58,500,000 per g <strong>of</strong> mollusk. Most<br />
Probable Numbers (MPN) <strong>of</strong> <strong>of</strong> coliform <strong>and</strong> fecal coliform bacilli were 0 to 1,600 per 100 ml <strong>of</strong><br />
water <strong>and</strong> 0 to 100 g <strong>of</strong> mollusk. Vibrio parahaemolyticus was found in 85% <strong>of</strong> mollusk samples<br />
<strong>and</strong> 56% <strong>of</strong> water samples. Based on the above findings, it can be inferred that culture areas in<br />
the Upper Gulf <strong>of</strong> Thail<strong>and</strong>, oyster farms in Surat Thani, cockle farms in Nakhon Si Thammarat<br />
<strong>and</strong> some cockle farms in <strong>Phangnga</strong> were contaminated with fecal wastes.<br />
Zooplankton community structure, abundance <strong>and</strong> distribution on the east coast <strong>of</strong><br />
Phuket Isl<strong>and</strong> <strong>and</strong> <strong>Phangnga</strong> <strong>Bay</strong> (Fig. 2.3) were analyzed by Boonruang (1 985) who reported<br />
Fig. 2.3. Sampling ?rations <strong>and</strong> depth contours in Plianrjnya <strong>Bay</strong>.
the highest density during the northeast monsoon with a maximum abundance occurring in the<br />
uppermost part <strong>of</strong> <strong>Phangnga</strong> <strong>Bay</strong>. In a related study by Boonruang <strong>and</strong> Tongvichit (unpublished)<br />
on the abundance <strong>and</strong> composition <strong>of</strong> zooplankton in <strong>Phangnga</strong> <strong>Bay</strong> for the entire 1984,<br />
monthly variations were observed. Abundant zooplankton population occurred during January to<br />
March with copepods having the highest species composition (20-60% followed by Lucifer spp.<br />
(1 -50%). Shrimp larvae were also observed constituting 1-5% at the inner part <strong>of</strong> the bay.<br />
A preliminary study on fish larvae abundance <strong>and</strong> composition was also undertaken from<br />
January to June 1984 by Janekarn <strong>and</strong> Nateewathana (unpublished). About 41 families were<br />
recorded with 21 <strong>of</strong> economic importance constituting 57.5% <strong>of</strong> the collected materials. Among<br />
the families were Engraulidae, Leiognathidae, Carangidae <strong>and</strong> Sciaenidae which was the most<br />
abundant. Seasonal variations were observed to be greatly affected by the monsoon periods.<br />
However, long-term observations are required to establish trends.<br />
The primary productivity was measured in situ along the east coast <strong>of</strong> Phuket Isl<strong>and</strong> <strong>and</strong><br />
<strong>Phangnga</strong> <strong>Bay</strong> in I982 (Fig. 2.3) using carbon-1 4 technique. It was reported that low <strong>and</strong> high<br />
primary productivity was recorded during northeast <strong>and</strong> southwest monsoons, respectively<br />
(Sunstrom et al. 1986).<br />
Chemical <strong>and</strong> physical oceanography<br />
I I<br />
0 0<br />
48 49<br />
0 0<br />
52 53<br />
0<br />
66<br />
0<br />
60<br />
Gulf <strong>of</strong><br />
O Thailond<br />
64<br />
Fig. 2.4. Sampling stations fol- DOF near <strong>Ban</strong> <strong>Don</strong> <strong>Bay</strong>: statlons<br />
81.82 <strong>and</strong> 83 in 1985.<br />
Along with the DOF biological surveys, limited studies on chemical parameters such as<br />
DO, pH <strong>and</strong> nutrients were conducted. The closest sampling stations to <strong>Ban</strong> <strong>Don</strong> <strong>Bay</strong> were 81,<br />
82 <strong>and</strong> 83 (Fig. 2.4). Stations 87 <strong>and</strong> 88 could not be sampled because they were too shallow<br />
0<br />
68<br />
0<br />
74
-<br />
Station 81<br />
' d<br />
I 1 . L L L u<br />
J F M A M J J A S O N D<br />
.- 2 ---- Cr<br />
+<br />
z o 1 A-1 1<br />
J F M A M J J A S O N D<br />
Station 82<br />
3 LLU<br />
T 4-<br />
5 3.5 - 3.5<br />
1 3-<br />
rn<br />
f. 2.5 -<br />
."+<br />
ur 2-<br />
1.5- 1.5<br />
c<br />
CL 1 -<br />
0.5<br />
J F M A M J J A S O N D<br />
" &* I\\\<br />
---<br />
J F M A M J J A S O N D<br />
Station 83<br />
4.9<br />
J F M A M J J A S O N D<br />
J F M A M J J A S O N D J F M A M J J A S O N D J F M A M J J A S O N D<br />
J F M A M J J A S O N D<br />
J F M A M J J A S O N D<br />
Month Month Month<br />
Fig. 2.5. Monthly distribution <strong>of</strong> (top to bottom): dissolved oxygen, phosphorous, nitrate <strong>and</strong> nitrite at stations c---• B ~ + ~ ~<br />
81.82 <strong>and</strong> 83 in 1985.<br />
&---0 Surface<br />
for the DOF vessel. Monthly distribution <strong>of</strong> DO, nitrate, nitrite <strong>and</strong> phosphate in 1985 at stations<br />
81 to 83 are shown in Fig. 2.5. At stations 82 <strong>and</strong> 83, DO at surface <strong>and</strong> bottom water samples<br />
did not show marked difference <strong>and</strong> varied from 3.7-5.3 mg/l indicating vertical water mixing.<br />
Salinity measured throughout the water column ranged from 3.7-5.3 ppt which also<br />
indicates vertical water mixing. The higher DO in bottom layers as compared to the surface at<br />
station 81 cannot be explained. However, DO peaks in July at station 81 <strong>and</strong> in September at<br />
stations 82 <strong>and</strong> 83 may be the result <strong>of</strong> water turbulence caused by the monsoon. Nutrients at<br />
stations 81 <strong>and</strong> 83 did not show much monthly variation except for nitrate levels at the latter.<br />
Fluctuation <strong>of</strong> nutrients at station 82 may be due to the release from resuspended sediments<br />
during turbulence since the station was shallow.
The only other report available on water quality in <strong>Ban</strong> <strong>Don</strong> <strong>Bay</strong> is by Chindanonda et al.<br />
(1 985). The site was a cockle farm at A. Tha Chang <strong>and</strong> A. Chaiya: DO was between 3.9-4.9<br />
mgll; pH, 7.76-8.7; Secchi disc visibility, 20-131 cm; nitrate nitrogen, less than 0.0138 mg/l;<br />
orthophosphate, 0.04-0.67 mgll; ammonia nitrogen, 0-0.69 mgll; <strong>and</strong> silica 5-42 mgll.<br />
In the west coast, chemical marine environmental data were collected to investigate<br />
diurnal <strong>and</strong> seasonal variations which are still being analyzed. <strong>Phangnga</strong> Provincial Fisheries<br />
Office conducted some monitoring in the cockle beds on the upper east coast <strong>of</strong> the bay, near<br />
K. Hin Rhum (Fig. 2.6). The results obtained in March to July 1986 indicated significant<br />
Fig. 2.6. Tht site <strong>of</strong> cockle seedbed survey (DOF 1986).<br />
seasonal variations in the environmental conditions. During southwest <strong>and</strong> northeast monsoons,<br />
salinity varied from 22-30 ppt, respectively, while water transparency (Secchi disc reading)<br />
varied from 0.8 to 1 .O m, respectively. The pH varied from 7.5 to 7.9 with a relatively uniform<br />
temperature <strong>of</strong> about 290C.<br />
In Phuket, several field measurements were completed by PMBC. The physical data,<br />
including tidal exchange <strong>and</strong> directions, temperature <strong>and</strong> salinity, were sent to the University <strong>of</strong><br />
South Carolina, USA, for modeling purposes.<br />
Based on the existing data for <strong>Phangnga</strong> <strong>Bay</strong>, the primary productivity is high because <strong>of</strong><br />
the influx <strong>of</strong> nutrients from mangrove <strong>and</strong> estuaries within the bay area. This is further enhanced<br />
by the hydrodynamic conditions prevailing in the bay, particularly tidal movements (Sunstrom et<br />
al. 1986; Parsons et al. 1977). Such high primary production has a significant impact on<br />
fisheries production <strong>and</strong> indicates good potential for shellfish farming (Petersen <strong>and</strong> Curtis 1980;<br />
Charpy-Roubaud et al. 1982). Despite such potential, however, mollusk larvae are not present<br />
in significant amounts (Kurt, pers. cornm.). It is, therefore, necessary to import seeds to realize<br />
this potential.<br />
Soils<br />
DOLD classified the soils <strong>of</strong> the Upper South according to theii types <strong>and</strong> agricultural<br />
uses. Soil types follow the st<strong>and</strong>ard set by the US Department <strong>of</strong> Agriculture (USDA) on soil<br />
taxonomy (refer to Table 2.7 <strong>and</strong> Fig. 2.7 on the units mentioned in the following paragraphs).
Fig. 2.7. Gencral soil types <strong>of</strong> the Upper Soulh, Thail<strong>and</strong><br />
Coastal soils<br />
Soils occurring on mangrove swamp (unit 1) <strong>and</strong> tidal flats or beach ridges (unit 1 .I), in<br />
general, are classified as Sulfaquents or Hydraquents. These soils are permanently saturated<br />
with saline water. Sulfaquents have an appreciable amount <strong>of</strong> sulfides <strong>and</strong> are generally<br />
associated with acid sulfate soils.<br />
In <strong>Ban</strong> <strong>Don</strong>, two main soil types can be distinguished: the muddy soils developed in the<br />
lower part <strong>of</strong> the tidal range <strong>and</strong> the acid sulfate or potentially acid sulfate soils (unit 2.1) in the<br />
upper part.<br />
The less developed muddy soils are mostly found in submerged condition <strong>and</strong> are<br />
alkaline in reaction. They have dark gray color, clayey texture <strong>and</strong> many decayed roots in the<br />
pr<strong>of</strong>ile. The surface layer is about 20-30 crn thick.<br />
The acid sulfate soils have gray color <strong>and</strong> clayey texture in the surface with reddish <strong>and</strong><br />
yellowish mottles. The soils are mildly acidic to strongly acidic in reaction.<br />
Most soils in <strong>Phangnga</strong> <strong>Bay</strong> mangrove areas are derived from clayey <strong>and</strong> silty<br />
sediments. The soils have clayey texture throughout the pr<strong>of</strong>il'e when undisturbed by mining<br />
activities. Yellowish or brownish mottles are observed in the upper soil pr<strong>of</strong>ile, particularly the<br />
L'1 BR'A'RY<br />
IWTEPNATIONAL CENTER FOR I.IVIWO<br />
AQUATIC RESOURCES MAHAGEMEBT
oxidized layers. The lower part <strong>of</strong> the pr<strong>of</strong>ile, the C-horizon, is always saturated with water which<br />
results in bluish color or strong graying condition. The soils are alkaline (ph 7-8) in reaction <strong>and</strong><br />
are generally moderately fertile <strong>and</strong> high in organic matter content. Mudballs are almost always<br />
observed.<br />
Disturbed mangrove soils along <strong>Phangnga</strong> Estuary occurred as a result <strong>of</strong> tin mining. But<br />
these soils were colonized by nipah palm after being ab<strong>and</strong>oned as mines.<br />
Soils developed on beach ridges or dunes normally have a predominant s<strong>and</strong>y texture<br />
<strong>and</strong> form long narrow strips parallel to existing shoreline. They are classified as Tropohumods<br />
<strong>and</strong> Quartzipsamments. Most have been used for cultivation <strong>of</strong> coconuts. However, the former<br />
is less desirable due to severe limitation in root zones.<br />
Lowl<strong>and</strong> soils<br />
Most <strong>of</strong> the lowl<strong>and</strong> soils are cultivated for paddy rice. They may be developed on<br />
brackish deposits or riverine alluvium. Internal drainage is poor <strong>and</strong> commonly flooded in the<br />
rainy season.<br />
The acid sufate soils (unit 2.1) form on brackishwater deposits with relatively high sulfur<br />
content. They are extremely acidic in reaction <strong>and</strong> are classified as Acid Tropaquepts. Rice yield<br />
commonly depends upon the degree <strong>of</strong> acidification <strong>and</strong> management level.<br />
Most <strong>of</strong> the loamy soils (unit 2.2) occupy the lower part <strong>of</strong> alluvial terraces or transitional<br />
sites between terraces <strong>and</strong> coastal lowl<strong>and</strong>. These soils are commonly classified into<br />
Plinthaquults <strong>and</strong> Paleaquults. The former have dark red mottles usually in platy, polygonal or<br />
reticulate pattern; the latter do not have these. Loamy soils are exclusively used for paddy rice.<br />
Average yield under ordinary management ranges from 1,560-2,190 kglha.<br />
The clayey soils (unit 2.3) occupy the basin <strong>of</strong> large rivers or former tidal flats. They<br />
include Tropaquepts <strong>and</strong> Paleaquults <strong>and</strong> most have been cultivated for paddy rice, with yield<br />
somewhat higher than that <strong>of</strong> loamy soils.<br />
Upl<strong>and</strong> soils<br />
These commonly occur on undulating to rolling topography with slopes ranging from 3%-<br />
35%. Their parent materials vary from old alluvium to transported material derived from various<br />
rocks. Areas where these types <strong>of</strong> soils occur are generally cleared <strong>of</strong> natural vegetation <strong>and</strong><br />
cultivated primarily for rubber, fruit trees, oil palm <strong>and</strong>, to a lesser extent, annual upl<strong>and</strong> crops<br />
such as maize, ground nuts <strong>and</strong> cassava. However, parts <strong>of</strong> the area are left idle <strong>and</strong> revert to a<br />
low secondary vegetation consisting <strong>of</strong> low shrubs, canes, bamboos <strong>and</strong> grasses, especially<br />
lmperata cylindrica. Upl<strong>and</strong> soils are subdivided into the following units:<br />
The deep to moderately deep loamy soils (unit 3.1) comprise those in groups<br />
Paleudults, Tropudults <strong>and</strong> Plinthudults which are moderately to well-drained <strong>and</strong> have rapid to<br />
moderate run<strong>of</strong>f. The natural fertility is relatively low. Lateritic gravels may occur in the lower<br />
subsoils.<br />
The deep to moderately deep clayey soils (unit 3.2) belong only to Paleudults. Their<br />
characteristics are similar to those described in unit 3.1 except that the former have more clay<br />
content in subsoils.<br />
The shallow soils (unit 3.3) comprise those containing lateritic gravels or rock<br />
fragments throughout the soil pr<strong>of</strong>iles. Those containing lateritic gravels can be classified into<br />
Paleudults; otherwise, they can be into Tropudults or Troporthents. In general, these soils are<br />
cultivated for rubber but parts are left idle <strong>and</strong> commonly revert to a type <strong>of</strong> low shrubs <strong>and</strong><br />
grassy undergrowth.
Steepl<strong>and</strong> soils<br />
About 32% <strong>of</strong> the total area <strong>of</strong> the Upper South are soils which occur on steepsided hills<br />
<strong>and</strong> mountains. The soil texture <strong>and</strong> the thickness <strong>of</strong> the solum are variable depending upon the<br />
nature <strong>of</strong> the parent rocks. These soils are highly susceptible to erosion even though they are<br />
cultivated with tree crops. In general, tropical evergreen forest remains dominant except on<br />
areas with commercial timbers.<br />
L<strong>and</strong> Capability<br />
L<strong>and</strong> capability classification is one <strong>of</strong> the important interpretations that can be made<br />
from the soil characteristics described above. Table 2.5 gives the l<strong>and</strong> capability for upl<strong>and</strong><br />
crops <strong>and</strong> the soil suitability for paddy rice with their extent <strong>and</strong> percentage <strong>of</strong> the total area.<br />
Table 2.5. Classification <strong>and</strong> l<strong>and</strong> capability assessment <strong>of</strong> soils in the Upper South, Thail<strong>and</strong>.<br />
.,, ,, . -, -<br />
Mapr soil group Unita Classification L<strong>and</strong> capability assessmentb Appmx. wxtenl<br />
(based on USDA soil taxonomy) Upl<strong>and</strong> crops Paddy rice Km2 Percentage<br />
-- . ,,,, . , . -.<br />
Coastal soils 1<br />
Mangrove soils 1.1 Hydraquents, Sulfaquents U-V P-V ti00 2.97<br />
S<strong>and</strong>y soils 1.2 Quartzipsarnments, Tropohumods U-IV P-IV 131 0.65<br />
Lowl<strong>and</strong> soils 2<br />
Acid sulfate soils 2.1 Sulfuric tropaquents U-IV P-IV G 0.03<br />
Loamy soils 2.2 Plinthaquults, Paleaquutls U-IV P-Ill 693 3.42<br />
Clayey soils 2.3 Tropaquepls, Paleaquults U-IV P-ll 693 3.42<br />
Upl<strong>and</strong> soils 3<br />
Deep to moderately 3.1 Dystropests, Paleudults U-Ill P-V 9.203 45.48<br />
deep loamy soils Tropudults, Plintliudults<br />
Dccp to moderately 3.2 Paleudults U-ll P-V 2,080 10.28<br />
clayey soils<br />
Shallow soils 3.3 Tropudults. Troporthents U-VI P-V 292 1.44<br />
Sleepl<strong>and</strong> soils 4 U-VII P-V 6,537 32.31<br />
Total 20,235 100.00<br />
--<br />
Source: DOLD (1980).<br />
a~or acomprehenrive discussion <strong>of</strong> the units, see section on soils in this chapter.<br />
bL<strong>and</strong> capability classes:<br />
U-l : soils very woll suited for upl<strong>and</strong> crops, having no significant limitations that restrict their use.<br />
U-ll : soils well-suited for upl<strong>and</strong> crops, having slight limitations that restrict their use.<br />
U-Ill : soils moderately suited for upl<strong>and</strong> crops, having moderate limitations thar reduce tho choice <strong>of</strong> crops <strong>and</strong>lor require<br />
special management.<br />
U-IV : soils poorly suited for upl<strong>and</strong> crops, having severe limitations that rcstricr the choice <strong>of</strong> crops <strong>and</strong>lor require very<br />
careful management.<br />
U-V : soils having littlc or no erosion hazard, but having other limitations that are impractical to remove, making them not<br />
suitable for upl<strong>and</strong> crops.<br />
U-VI : soils having severe limitations that make <strong>and</strong> limit thoir use to pasture, woodl<strong>and</strong>, wildlife food <strong>and</strong> covor, wntor<br />
supply <strong>and</strong> recreation.<br />
U-VII : soils having very sevorc limitations that make them not suitable for cultivated crops <strong>and</strong> that restrict their use largely<br />
to woodl<strong>and</strong>, wildlife fwd <strong>and</strong> covor, water supply <strong>and</strong> recreation.<br />
U-VIII : soils <strong>and</strong> l<strong>and</strong> types having limitations that preclude their use <strong>of</strong> commercial plant production <strong>and</strong> restrict their use to<br />
recreation, wildlife food <strong>and</strong> cover <strong>and</strong> water supply.<br />
L<strong>and</strong> suitability classes:<br />
P-l : soils vary well suited for paddy l<strong>and</strong> having no significant limitations for rico production.<br />
P-ll : soils well-suitod for paddy l<strong>and</strong> having slight limitations that restrict their use !or rice production.<br />
P-Ill : soils moderately suited for paddy l<strong>and</strong>, haling moderate limitations that restrict their use for rice production <strong>and</strong>lor<br />
require special management.<br />
P-IV : soils poorly suited for paddy l<strong>and</strong>, having severe limitations that restrict thcir use for rice production <strong>and</strong>lor requlre<br />
very careful management.<br />
P-V : soils generally not suitod for paddy l<strong>and</strong>, having very seveie limitations that preclude their use for rice production<br />
with ordinary methods.
About 56% <strong>of</strong> the total area <strong>of</strong> the Upper South is suitable for upl<strong>and</strong> crops.<br />
Approximately 32% are steepl<strong>and</strong>s which are not recommended for agricultural uses. Marginal<br />
l<strong>and</strong>s for upl<strong>and</strong> crop production comprise 9%. The others are unsuitable for upl<strong>and</strong> crops due<br />
to regular flooding by seawater. The largest part <strong>of</strong> the Upper South (93%) is generally not<br />
suited for paddy l<strong>and</strong> <strong>and</strong> comprises l<strong>and</strong> too steep or too high to impound water.<br />
There are limits <strong>of</strong> arable l<strong>and</strong> to absorb more agriculture rapidly which is exacerbated by<br />
diminishing soil resources due to improper use. Most <strong>of</strong> the forest areas (not only on the<br />
mountains but also along the estuaries) have been cleared to some extent. In some areas, the<br />
rate <strong>of</strong> clearance is beyond control.<br />
For protection <strong>of</strong> the l<strong>and</strong> resources in the coastal areas from irreparable damage,<br />
individual l<strong>and</strong> units must be evaluated in terms <strong>of</strong> their capability <strong>and</strong> compared to present<br />
uses. The use <strong>of</strong> l<strong>and</strong> capability data combined with other physical <strong>and</strong> socioeconomic data will<br />
help in appropriate management <strong>and</strong> development planning <strong>of</strong> the coastal resources.<br />
Coastal morphology<br />
Mangrove Forests<br />
SANIT AKSORNKOAE AND APISIT EIUMNOH<br />
Strong wave energy inhibits the formation <strong>of</strong> extensive mangrove forests on <strong>Ban</strong> <strong>Don</strong>.<br />
Along the river mouth, muddy sediments were deposited, <strong>and</strong> mangrove forest is well-<br />
established. The tidal range is not great so coverage is along a narrow strip.<br />
In <strong>Phangnga</strong> <strong>Bay</strong>, the tidal range is larger <strong>and</strong> a very gentle sloping or flat l<strong>and</strong>form is<br />
found. Because <strong>of</strong> the flat topography <strong>and</strong> low wave energy there has been much deposition <strong>of</strong><br />
sediments, clay, silt <strong>and</strong> organic matter. Limestone <strong>and</strong> some other rock hills also provide good<br />
shelter <strong>and</strong> wind protection.<br />
The total mangrove areal extent <strong>of</strong> Thail<strong>and</strong> in 1986 was about 268,694 ha. The<br />
mangrove forests <strong>of</strong> Surat Thani, <strong>Phangnga</strong>, Phuket <strong>and</strong> Krabi constitute about 30% <strong>of</strong> the<br />
national total or 81,574 ha which decreased by about 3% from 1975 to 1986. Dominant species<br />
are Rhizophora spp., Avicennia alba, Sonneratia alba, Xylocarpus spp. <strong>and</strong> Bruguiera spp.<br />
The primary contributing factors to the decrease are clear cutting for wood for charcoal<br />
or construction <strong>and</strong> l<strong>and</strong> reclamation for urban development, aquaculture, tin mining <strong>and</strong><br />
industry. L<strong>and</strong> use data showed that as <strong>of</strong> 1986, 38% <strong>of</strong> the total converted mangroves in the<br />
country were for aquaculture purposes. L<strong>and</strong> reclamation for agriculture, urban <strong>and</strong> industrial<br />
sites took 46% <strong>and</strong> conversion for tin mining, about 3.5%. Along the Andaman Sea, tin mining<br />
has been a major cause <strong>of</strong> mangrove degradation. About 2% <strong>of</strong> the mangrove forests were<br />
affected. Degradation is largely a result <strong>of</strong> sedimentation from tin mine tailings.<br />
Area distrlbutlon<br />
The mangrove forests along the coast <strong>of</strong> <strong>Ban</strong> <strong>Don</strong> <strong>Bay</strong> cover the provinces <strong>of</strong><br />
Chumphon, Surat Thani <strong>and</strong> Nakhon Si Thammarat (Table 2.6.) <strong>and</strong> are estimated to be 25,570<br />
ha (Klankamsorn <strong>and</strong> Charuppat 1982).<br />
In <strong>Phangnga</strong> <strong>Bay</strong>, mangrove forests (Table 2.7) occur on the seashore, lagoon <strong>and</strong><br />
along the rivers at levels between low <strong>and</strong> high tides. The extent <strong>of</strong> mangrove forests in
Table 2.6. Area (ha) <strong>of</strong> mangrove torests in <strong>Ban</strong> <strong>Don</strong> <strong>Bay</strong> by provinces in 1979.<br />
. . . - . .- ......<br />
-<br />
Province Area Percentage <strong>of</strong> the<br />
total area<br />
Chumplion<br />
A. Muang<br />
A. Sawi<br />
A. Pathiu<br />
A. Lang Sum<br />
Subtotal<br />
Surat Thani<br />
A. Muang<br />
A. Chaiya<br />
A. Tha Chang<br />
A. Tha Chana<br />
A. Kanchanadit<br />
A. <strong>Don</strong> Sak<br />
Subtotal<br />
Table 2.7. Area (ha) <strong>of</strong> mangrove forests in <strong>Phangnga</strong> <strong>Bay</strong> by provinces <strong>and</strong><br />
districts (amphoe) in 1'379.<br />
........<br />
Province Aron Pqcenlage <strong>of</strong><br />
tho total aroa<br />
....................<br />
<strong>Phangnga</strong><br />
A. Muang 8.800<br />
A. Takua Thur~g 8.144<br />
A. Thap Put 3.164<br />
King A. KO Yao 1,072<br />
Subtotal 21.180 38.0<br />
Krabi<br />
A. Muang<br />
A. Ao Luk<br />
A. Khlorq Thom<br />
Kor-lunta<br />
Subtotal<br />
Phuket<br />
Naklion Si Thammarat A. Muang<br />
A. Muang 4,768 A. Thalang<br />
A. Phanom 592 Subtotal<br />
A. Pak Phanang 7,472<br />
Subtotal 12.832 50.2 Total<br />
Total 25,568 100<br />
<strong>Phangnga</strong> <strong>Bay</strong>, as estimated by using satellite imagery in 1979, was about 55,790 ha<br />
(Klankamsorn <strong>and</strong> Charuppat 1982).<br />
Species composition<br />
Species composition <strong>of</strong> mangrove communities <strong>of</strong> <strong>Ban</strong> <strong>Don</strong> <strong>Bay</strong> was observed at A.<br />
Muang, Chumphon Province; A. Chaiya <strong>and</strong> A. <strong>Don</strong> Sak, Surat Thani Province (Miyawaki et al.<br />
1975); <strong>and</strong> A. Khanom, Nakhon Si Tharnmarat Province (Aksornkoae 1985). The main species<br />
at A. Muang are composed <strong>of</strong> S. alba, A. alba, Rhizophora mucronata, R. apiculata, Ceriops<br />
tagal, Xylocarpus granatum <strong>and</strong> Excoecaria agallocha.<br />
The important species at A. Chaiya are R. apiculata, S. alba, A. alba, X. granatum, E.<br />
agallocha, C. dec<strong>and</strong>ra <strong>and</strong> Nypa fruticans. The common species at A. <strong>Don</strong> Sak are R.<br />
mucronata, R. apiculata, A, <strong>of</strong>ficinalis, X. moluccensis, E. agallocha <strong>and</strong> Phoenix sp. At A.<br />
Khanom, there are more species; <strong>and</strong> the common ones are R. apiculata, R. mucronata, X.<br />
granatum, X. moluccensis, A. alba, C. tagal, Lumnitzera sp., E. agallocha, Bruguiera<br />
gymnorrhira, B. cylindrica, Heritiera littoralis, Acrostichum aureum, S. alba <strong>and</strong> Phoenix<br />
paludosa.<br />
Mangrove species at A. Muang, <strong>Phangnga</strong> Province were studied by Aksornkoae <strong>and</strong><br />
Kongsangchai (1 980). There are three habitats, each having a different species composition:<br />
1. Near the limestone area - R. mucronata, R. apiculata, X. granatum, X. moluccensis,<br />
B, sexang ula, 6. cylindrica, B. parviflora, B. gymnorrhira, Sonnera tia sp . , C. tag all K<strong>and</strong>elia<br />
c<strong>and</strong>el <strong>and</strong> A. alba.<br />
2. Near the shale <strong>and</strong> quartzitic formations - R. mucronata, R. apiculata, X. granatum,<br />
B, sexangula, B. cylindrica, B. parviflora <strong>and</strong> C. tagal. There are less species found in these<br />
areas compared to those in the southeastern part <strong>of</strong> the country such as in Chonburi Province<br />
(Aksornkoae 1975).<br />
3. Near the s<strong>and</strong>stone area - R. apiculata, S. alba, X, granatum, Lumnitzera sp. <strong>and</strong><br />
Melaleuca leucadendron.<br />
Species zonation<br />
Species zonation at <strong>Ban</strong> <strong>Don</strong> <strong>Bay</strong> was intensively studied only at A. Phanom<br />
(Aksornkoae 1985). Along the margin <strong>of</strong> rivers <strong>and</strong> channels running through the mangroves,
<strong>and</strong> where the soil surface is waterlogged <strong>and</strong> very muddy, pure st<strong>and</strong>s <strong>of</strong> Rhizophora are found<br />
with roots arching into the water. R. apiculata <strong>and</strong> Rhizophora spp. are found from the river<br />
margin to about 100 m inl<strong>and</strong>.<br />
The zone <strong>of</strong> Avicennia, variable in width, occurs behind the zone <strong>of</strong> Rhizophora.<br />
Occasionally, trees <strong>of</strong> Avicennia may also be found in the wetter area near the forest margin.<br />
Bruguiera is observed behind Avicennia. The l<strong>and</strong>s behind Avicennia <strong>and</strong> Bruguiera<br />
communities, which are more elevated <strong>and</strong> subject to less frequent tidal inundation, are<br />
occupied by Xylocarpus. The drier l<strong>and</strong> behind this zone is colonized by Ceriops, Lumnitzera<br />
<strong>and</strong> Excoecaria. Occasionally, on the elevated <strong>and</strong> drier area at the riverbank, Xylocarpus,<br />
Ceriops, Lumnitzera <strong>and</strong> Excoecaria are observed. The fern, A. aureurn, is found sporadically<br />
covering an area where the forest has been disturbed by cutting. The palm, P. paludosa, grows<br />
sparsely in mangroves <strong>and</strong> covers only the area along the river margin.<br />
In the mangrove forests at A. Muang, <strong>Phangnga</strong>, different species tend to dominate<br />
certain zones due chiefly to species adaptation to adverse site factors such as soil condition,<br />
topographic relief <strong>and</strong> strong prevailing seashore winds.<br />
St<strong>and</strong> density <strong>and</strong> stem volume<br />
St<strong>and</strong> densities <strong>and</strong> stem volumes <strong>of</strong> all mangrove forests <strong>of</strong> both <strong>Ban</strong> <strong>Don</strong> <strong>Bay</strong> (A.<br />
Phanom) (Tables 2.8 <strong>and</strong> 2.9) <strong>and</strong> <strong>Phangnga</strong> <strong>Bay</strong> (A. Muang) (Tables 2.1 0-2.1 5) were observed<br />
Table 2.8. Tree density (treestha) <strong>of</strong> mangrove lorests in <strong>Ban</strong> <strong>Don</strong> <strong>Bay</strong> in A. Khanom. Nakhon Si Thammarat.<br />
Species Tree density<br />
Scientific name Common Thai name Distanm from forest margin Total Average<br />
(riverbank) towards inl<strong>and</strong> (m)<br />
0.10 30-40 60-70 40100 120-130<br />
Rhizophora apiculata<br />
R. mucronata<br />
Xylocarpus granarum<br />
X. moluccensis<br />
Avicennia alba<br />
Ceriops tagal<br />
Lumnitrera spp.<br />
Excoecaria agallocha<br />
Bruguiera gymnorrhiza<br />
B. cylindrica<br />
Total<br />
Kong-kang-bi-lek<br />
Kong-kang-bi-yai<br />
Taboon-khao<br />
Taboon-durn<br />
Sarnae-khao<br />
Prong<br />
Fard<br />
Ta-tum<br />
Pra-sak<br />
Tua-khao<br />
Table 2.9. Stem volume (mslha) <strong>of</strong> mangrove forests in <strong>Ban</strong> <strong>Don</strong> Bey in A. Khanom. Nakhon Si Thammarat.<br />
2,L". ., , , -- .<br />
Species Stern volume<br />
Scientific name Distance tom forest margin Total ' Average<br />
(rivorbank) towards inl<strong>and</strong> (m)<br />
0-10 30-40 60-70 90-lM3 120-130<br />
1 ,up<br />
Rhizophora apiculata 30.52 6.29 9.72 3.50 50.03 10.01<br />
R. rnucronata 27.97 8.99 36.96 7.39<br />
Xylacarpus granatum 18.02 11 .46 34.87 18.81 5.46 88.61 17.72<br />
X. moluccensis 0.93 26.51 3.00 30.44 6.09<br />
Avicennia alba 38.92 0.47 39.38 7.88<br />
Ceriops raga1 3.95 7.49 2.33 12.95 9.39 36.12 7.22<br />
Lurnnitzera spp. 2.50 0.60 4.46 4.53 12.09 2.42<br />
Excoecaria agallocha 15.56 4.00 0.47 7.59 27.61 5.52<br />
Bruguiera gymnorrhiza 1.76 9.02 5.66 7.23 23.68 4.74<br />
B. cylindrica 0.47 0.47 0.09<br />
Total 121.88 53.08 91.36 49.39 29.67 345.39 69.08<br />
- .. . . -. . ..
Table 2.10. Avcrage densify (trcoslha) <strong>of</strong> dominant mangrovo species in limcstonc area from estuary lo inl<strong>and</strong> slles <strong>of</strong> Phangqa<br />
<strong>Bay</strong>, A Muang. <strong>Phangnga</strong><br />
Species<br />
Scienlllie name<br />
Rhizuphora rnucronara<br />
R. apiculata<br />
Xylocarpus granalum<br />
X. moluccensis<br />
Bruguicra sexangulata<br />
B cylindrica<br />
B. parvifioran<br />
B. gymnorrhim<br />
Cerioos SD.<br />
~unnktia sp.b<br />
K<strong>and</strong>eiia c<strong>and</strong>cP<br />
A vicennia alba<br />
Wens~ty<br />
D~stance lrom estuary to inl<strong>and</strong> sites (m)<br />
0 10 20-30 40-50 60-70 80-90<br />
.- - -. .<br />
1,200 325 200 125<br />
725 1,200 1,325 800 575<br />
150 175 225 225 500<br />
175 50 50<br />
75 50 175 50<br />
50 175<br />
200 50<br />
25<br />
50 50 325 550 475<br />
Total<br />
100 110<br />
-<br />
- 1,850<br />
125 4,750<br />
450 1.725<br />
275<br />
350<br />
75 300<br />
25 275<br />
25 50<br />
- 1 450<br />
Tolal 2,350 2,375 2,575 2.100 1,875 750 12.025 2,004.2<br />
.a,"-- - ., ., , , ,. .. . , ., ,,<br />
Common Thai names; aTua-dam. b Lam-pan. CRang-ka-tae.<br />
Table 2.1 1. Average density (treeslha) <strong>of</strong> dominant mangrove species in shale <strong>and</strong> quartzitic area from cstuary to inl<strong>and</strong> sites <strong>of</strong><br />
<strong>Phangnga</strong> <strong>Bay</strong>, A. Muang, <strong>Phangnga</strong>.<br />
Rh~zophura mucronata<br />
R. apiculata<br />
Xylocarpus granaturn<br />
Bruguiera soxangulata<br />
B. cylindrica<br />
B. parvillor3<br />
Ceriops sp.<br />
Dendty<br />
Distance from estuary to inl<strong>and</strong> sites (m)<br />
0.10 20-30 40-50 60-70 80-90 100-110 120-130 140-150 160,,170<br />
.- ,,,, --<br />
400 200 -<br />
1,600 700 1,100 600 500 450 750<br />
100 350 250 200 300 300 650 500 550<br />
- 250 100 250 -<br />
- 200 150<br />
-<br />
50<br />
100<br />
50<br />
550 550 200 600<br />
- 100 200 200 100 150 250 400<br />
Total Average<br />
Total 2,100 1,500 1,750 1,400 1.150 1,450 2,100 950 1,550 13,950 1.550.1<br />
-<br />
Tablo 2.12. Average density (treeslha) <strong>of</strong> dominant mangrove species in s<strong>and</strong>stone area from cstuary to inl<strong>and</strong> sites <strong>of</strong> <strong>Phangnga</strong><br />
<strong>Bay</strong>, A. Muang, <strong>Phangnga</strong>.<br />
,-<br />
Species Density<br />
Scientific Distance from estuary to inl<strong>and</strong> sites (m) Total Avrmgo<br />
name 0-10 10-20 20.40 30-40 40-50 5060<br />
Rhizophora apiculala 25 37.5 62.5 12.5 137.5 22.9<br />
Sonneratia alba 75 25 100.0 16.7<br />
Aviccnnia alba 50 75 100 25 50 300.0 50.0<br />
Xylocarpus granaturn 62.5 50 37.5 100 250.0 41.7<br />
Melaleuca leucadendruna 37.5 37.5 6.2<br />
Lurnnitzcra sp. 25 25.0 1.2<br />
Tolal 125 162.5 175 100.0 237.5 50.0 850.0 141.7<br />
-, . , A ... ,- ,<br />
acorninon Thai name: Sa-mcd.<br />
Table 2.13. Average volume (m3/ha) <strong>of</strong> dominant mangrove species in limestone area from estuary to inl<strong>and</strong> sites <strong>of</strong> <strong>Phangnga</strong> Ray,<br />
A. Muang, <strong>Phangnga</strong>.<br />
-<br />
Spec~ws<br />
Scientihc name<br />
Rhizophora rnucronata<br />
R. apiculat.?<br />
Xylocarpus granatum<br />
X. rnolucccnsis<br />
Bruguiera sexanguI31a<br />
8. cylindrica<br />
B. gymnorrhim<br />
B. parviflora<br />
Ceriops sp.<br />
Sormeratia sp.<br />
K<strong>and</strong>elia c<strong>and</strong>el<br />
Aviccnni;l alba<br />
Tolal<br />
Volume<br />
Distance from esluary to inl<strong>and</strong> sites (m)<br />
0.10 20,,30 40-50 60-70 80 90<br />
100-110<br />
Total<br />
Average
Table 2.14. Average volume (m3/ha) <strong>of</strong> dominant mangrove spades in shale <strong>and</strong> quamitic area from estuary to inl<strong>and</strong> sites <strong>of</strong><br />
<strong>Phangnga</strong> <strong>Bay</strong>. A. Muang, <strong>Phangnga</strong>.<br />
Rhizophora mucronefa 11.8 6.2 - - 18.1 2.0<br />
R apiculata 35.0 20.6 26.2 17.5 15.0 13.1 22.5 - - 149.9 16.6<br />
Xylocarpus granafum 10.0 28.8 25.0 20.0 30.0 30.0 40.0 35.6 28.1 247.5 27.5<br />
Bruguiera sexangulara - 7.5 3.1 7.5 - - 18.1 2.0<br />
6. cylindrica - 5.6 4.4 1.2 1.B - - 13.1 1.4<br />
6. paM"t70ra - 2.5 15.0 13.1 5.0 16.2 51.8 5.8<br />
Ceriops sp. - 1.9 3.8 3.8 1.9 3.1 5.0 8.1 27.6 3.1<br />
Total 56.8 63.1 61.8 53.2 52.5 61.9 78.7 45.6 52.4 526.1 58.4<br />
Table 2.15. Average volume (m3/ha) <strong>of</strong> dominant mangrove species in s<strong>and</strong>stone area from estuary to inl<strong>and</strong> sites <strong>of</strong> <strong>Phangnga</strong><br />
<strong>Bay</strong>. A. Muang, <strong>Phangnga</strong>.<br />
SPA Vdwne<br />
Schtifb n m Dhtgnca horn esbafy to inl<strong>and</strong> &IS (m) fa<br />
0-10 l&W XI-30 3040 UOSD 50.BO<br />
Rhizophora apiculara 0.6 1.2 3.1 0.6 5.5 0.9<br />
Sonnerafia alba 20.0 12.5 32.5 5.4<br />
Avicennia alba 13.1 15.0 13.8 5.0 11.2 58.1 9.7<br />
Xylocarpus granarum 12.5 13.1 15.0 16.9 57.5 9.6<br />
Melaleuca leucadendron 19.4 19.4 3.2<br />
Lumnitzera sp. 0.6 0.6 0.1<br />
Total 33.1 40.0 27.5 21.2 31.8 20 173.6 28.9<br />
to be variable. Particularly in the latter, it was observed that forests near shale formation area<br />
had the highest densities <strong>and</strong> volumes while those close to the s<strong>and</strong>stone had the lowest.<br />
Seedling distribution<br />
Natural regeneration <strong>of</strong> mangroves around <strong>Ban</strong> <strong>Don</strong> <strong>Bay</strong> was studied at A. Phanom only<br />
(Table 2.1 6). There was an average density <strong>of</strong> about 9,500 seedlingslha, which was quite<br />
impressive.<br />
In <strong>Phangnga</strong> <strong>Bay</strong> (Tables 2.17-2.19), natural regeneration is generally abundant,<br />
especially in areas close to limestone, shale <strong>and</strong> quartzitic formations. However, regeneration in<br />
s<strong>and</strong>stone areas is rarely observed due to poor soil condition.<br />
Information on structural characteristics <strong>of</strong> mangrove communities along <strong>Ban</strong> <strong>Don</strong> <strong>Bay</strong><br />
<strong>and</strong> <strong>Phangnga</strong> <strong>Bay</strong> is limited. Only the communities at A. Phanom, Nakhon Si Thammarat, <strong>and</strong><br />
at A. Muang, <strong>Phangnga</strong> Province, have been studied.<br />
Table 216. Seedling distribution (per ha) <strong>of</strong> mangrove forests <strong>of</strong> <strong>Ban</strong> <strong>Don</strong> <strong>Bay</strong> in A. Khanom. Nakhon Si Thammarat.<br />
Rhizophora apiculata<br />
R mucronata<br />
Xylocarpus granarum<br />
X moluccensis<br />
Avicennia alba<br />
Ceriops fagal<br />
Lumnitrera spp.<br />
Excoecaria agallocha<br />
Bruguiera gymnorrhiza<br />
8. cylindrica<br />
Total
lnl<strong>and</strong><br />
Table 2.17. Average density <strong>of</strong> mangrove seedlings (per ha) in limestone area from estuary to inl<strong>and</strong> sites <strong>of</strong> <strong>Phangnga</strong> <strong>Bay</strong>. A.<br />
Muang, <strong>Phangnga</strong>.<br />
Species<br />
Sdentiflc name Distance h m eshr Rd si*tB (m) Total A m p<br />
0-10 20-50 40-M 80-90 100-110<br />
Rhizophora rnucrwala<br />
R. apiculata<br />
Xylocarpus granatum<br />
K<strong>and</strong>elia c<strong>and</strong>el<br />
Ceriops sp.<br />
Avicennia alba<br />
Bruguiera spp.<br />
Sonneratia sp.<br />
Total 6.500 3.950 2.350 2.550 2,625 963 18.938 3,156.5<br />
-<br />
Table 2.18. Avorage density <strong>of</strong> mangrove seedlings (per ha) in shale <strong>and</strong> quattzitie area lrom estuary to inl<strong>and</strong> sites <strong>of</strong> <strong>Phangnga</strong><br />
<strong>Bay</strong>, A. Muang, <strong>Phangnga</strong>.<br />
-. -<br />
Speclee Deity<br />
Scientific name Distance fmm eslu to inl<strong>and</strong> ates (m) Totirl Amqe<br />
C-10 20-30 4450 80-70 & IOlFllO 120-130 140-150<br />
-.<br />
p-<br />
Rhizophora mucronata 450 112 - 562 70.2<br />
R apiculata 2,750 3,300 2,900 1,800 700 BOO 600 - 12.850 1.606.2<br />
Xylocarpus granatum - 1,250 600 700 1,100 600 750 600 5,600 700.0<br />
Geriops sp. - 1,000 1,050 1,100 600 525 500 4,775 596.9<br />
Bruguiera spp. - 2,500 2,000 3.100 2.500 2,850 1,600 - 14.600 1,825.0<br />
Total 3,200 7,162 6.500 6.650 5,450 4,850 3,475 1,100 38,387 4,798.3<br />
Table 2.19. Average density <strong>of</strong> mangrove soodlings (pcr ha) In s<strong>and</strong>stone area from ostuary to inl<strong>and</strong> sites <strong>of</strong> <strong>Phangnga</strong> <strong>Bay</strong>. A.<br />
Muana. Phananaa.<br />
-. - - -,-"-<br />
Specie6 <strong>Don</strong>slly<br />
Scientific name Distance hrn wWqf inl<strong>and</strong> sites (m) " Total Average<br />
0-10 10-20 20-30 &40 4C-50 50,60<br />
,,,, -,"-," -"., , .,,, "-.-<br />
Rhizophora apicu/sla 150 150 25<br />
Avicennia alba 100 250 300 1.700 100 2,450 408.3<br />
Sonneratia sp. 250 100 150 50 100 650 108.3<br />
Xylocarpus granatum 50 500 50 350 100 1.050 175.0<br />
Melaleuca leucadcndron 100 100 16.6<br />
Total 400 850 500 2,100 550 4,400 733.2<br />
Wildlife <strong>and</strong> Protected Areas<br />
The inl<strong>and</strong> habitat <strong>of</strong> upl<strong>and</strong>, moist, evergreen forest in <strong>Ban</strong> <strong>Don</strong> <strong>Bay</strong> is valuable as<br />
wildlife habitat <strong>and</strong> watershed cover. Important wildlife species include banteng, several wild<br />
cats, elephant, gibbon, argus pheasant <strong>and</strong> helmeted hornhill, among others.<br />
The Electricity Generating Authority <strong>of</strong> Thail<strong>and</strong> (EGAT 1980) made a study on the<br />
environmental <strong>and</strong> ecological impacts <strong>of</strong> Chiew Larn Dam Project. Inl<strong>and</strong> fauna tallied in the<br />
report were 38 mammal, 69 bird, 12 amphibian <strong>and</strong> reptile species; 8 species were categorized<br />
as endangered.<br />
In <strong>Phangnga</strong> <strong>Bay</strong>, the fauna is relatively impoverished due to the absence <strong>of</strong> large forest<br />
tracts, which have been mostly converted to rubber plantations.
Mangroves<br />
Even though the importance <strong>of</strong> mangroves as wildlife habitats is well known, in<br />
<strong>Phangnga</strong> <strong>Bay</strong>, the mangrove forests faunal species are not well documented. In <strong>Ban</strong> <strong>Don</strong> <strong>Bay</strong>,<br />
mangrove forests are not as extensive as in <strong>Phangnga</strong> <strong>and</strong> wildlife studies are also limited.<br />
Beaches <strong>and</strong> isl<strong>and</strong>s<br />
In <strong>Ban</strong> <strong>Don</strong> <strong>Bay</strong>, coral reefs are located around the Samui-Phangan-Ang Thong group <strong>of</strong><br />
isl<strong>and</strong>s. These areas are in relatively good condition <strong>and</strong> serve as tourist attractions (Fig. 2.8). In<br />
<strong>Phangnga</strong> <strong>Bay</strong>, beaches <strong>and</strong> isl<strong>and</strong>s are relatively impoverished but important for rare species<br />
<strong>of</strong> terns <strong>and</strong> gulls. Hat Nai Yang Beach in Phuket is one <strong>of</strong> the region's few remaining green sea<br />
turtle nesting sites.<br />
Mudflats<br />
1m<br />
AO Mae Hal \--Qi----i;<br />
00: wag<br />
KO Too A<br />
0 5 10 15 20km<br />
Ao Moe Nan1 <strong>and</strong> KO Ma<br />
AO Hot Lot -. \<br />
-, \<br />
Fig. 2.8. Coral quality in the isl<strong>and</strong>s <strong>of</strong> <strong>Ban</strong> <strong>Don</strong> Bav.<br />
Coral quality ~Io~sificaH~n<br />
High , ,--... , LOW<br />
A B C D E :<br />
Surat Thani's mudflats are significant for shorebirds, particularly migrants, <strong>and</strong> provide<br />
habitat for many crabs <strong>and</strong> some bivalves. A small area <strong>of</strong> mudflats in <strong>Phangnga</strong> is <strong>of</strong> equal<br />
importance.
Protected areas<br />
In <strong>Ban</strong> <strong>Don</strong> <strong>Bay</strong>, there are two national parks (NP) <strong>and</strong> one wildlife sanctuary (WS). Mu<br />
KO Ang Thong NP (84 km2) is the only marine protected area. Khao Sok NP (645 km2) <strong>and</strong><br />
Khlong Saeng WS (1,155 km2) protect upl<strong>and</strong> moist evergreen forests. There are also two<br />
nonhunting areas (34 km2) <strong>and</strong> two forest parks (24 km2) (Table 2.20 <strong>and</strong> Fig. 2.9).<br />
Table 2.20. Protected areas in the Upper South, Thail<strong>and</strong>.<br />
Name Ty?P Area(ha) Typ <strong>of</strong>forest Wl& Cord<br />
Aa BD Ille reel<br />
-. .<br />
Khao Sok Surat Thani NPC 64,552 x x<br />
Khao Luang Nakhon Si Thammarat NP 57.000 x x<br />
Khao Phanom Benja Krabi NP 5,000 x<br />
KO Surin <strong>Phangnga</strong>, Andarnan Sea NP (marine) 13.500 x x x<br />
Mu KO Phi Phi<br />
Hat Nopparatthara Krabi NP (marine) 38,900 x x<br />
Ao <strong>Phangnga</strong> <strong>Phangnga</strong> <strong>Bay</strong> NP (marine) 40,000 x x x<br />
Khao Lam Pi <strong>Phangnga</strong> NP 7,600 x x x<br />
Hat Thai Muang <strong>Phangnga</strong> NP x x<br />
Hat Nai Yang Phuket NP (marine) 9.000 x x<br />
Mu KO Ang Thong Surat Thani, <strong>Ban</strong> <strong>Don</strong> <strong>Bay</strong> NP (marine) 10.200 x x<br />
Khlong Saeng Surat Thani WSd 115,615 x x<br />
Khlong Phraya Krabi WS 9.500 x x<br />
Khao Phra Taeo Phuket NHe 2,228 x x<br />
Nong Thung Thong Surat Thani NH 2,956 x x<br />
Khao Tha Phet Surat Thani NH 463 x x<br />
aA - upl<strong>and</strong>.<br />
bB -<br />
CNP -<br />
~ W S -<br />
mangrove.<br />
national park.<br />
wildlife sanctuary.<br />
eNH - nonhunting area.<br />
The following are the most important protected areas in terms <strong>of</strong> resource conservation:<br />
1. Khlong Saeng WS is a large area <strong>of</strong> high regional <strong>and</strong> national significance where<br />
there is a good population <strong>of</strong> several uncommon wildlife species such as banteng, tiger, clouded<br />
leopard, elephant, lur gibbon, argus pheasant <strong>and</strong> helmeted hornhill. Capture operations were<br />
conducted to rescue wildlife str<strong>and</strong>ed by the Chiew Lam Dam. The sanctuary's forests were<br />
destroyed when Chiew Larn Dam was constructed.<br />
2, Khao Sok NP is contiguous with Khlong Saeng WS, <strong>and</strong> is <strong>of</strong> similar importance.<br />
3. Mu KO Ang Thong NP is a marine park <strong>of</strong> considerable significance as one <strong>of</strong> the<br />
few remaining areas in the gulf which contain relatively well-developed <strong>and</strong> undamaged coral<br />
reefs.<br />
4. Other areas: The province's eastern mountains encompass some intact humid<br />
evergreen forests. Although not included in the protected areas system, these forests extend to<br />
Khao Luang NP in Nakhon Si Thammarat <strong>and</strong> are considered valuable for species conservation<br />
<strong>and</strong> watershed protection.<br />
The waters around Sarnui-Phangan-Ang Thong Isl<strong>and</strong>s contain undamaged coral reefs,<br />
some <strong>of</strong> which have been recommended for protected area status.<br />
In <strong>Phangnga</strong>, there are five national parks <strong>and</strong> one wildlife sanctuary. Three <strong>of</strong> the<br />
former cover upl<strong>and</strong> moist evergreen forests. Marine parks include <strong>Phangnga</strong> <strong>Bay</strong> NP (347 km2)<br />
which has most <strong>of</strong> the region's protected mangrove areas <strong>and</strong> Hat Nai Yang NP (326 km2,<br />
marine) in Phuket. Khlong Phraya WS (95 km2) <strong>and</strong> Phanom Bencha WS (50 km2) in Krabi<br />
cover upl<strong>and</strong> evergreen forests <strong>and</strong> are important for watershed protection. There are one<br />
nonhunting area (22 km2) <strong>and</strong> four forest parks (2 km2) which primarily serve as small, domestic<br />
tourist spots.<br />
The following are the most important protected areas in terms <strong>of</strong> resource conservation:<br />
1. <strong>Phangnga</strong> <strong>Bay</strong> NP encompasses one <strong>of</strong> the largest areas <strong>of</strong> mangrove forest <strong>of</strong> any<br />
park or sanctuary in Thail<strong>and</strong>, though most <strong>of</strong> the bay's mangroves are located outside the park.
Khiri Rotthonlkhorn<br />
Mu KO Ang Thong<br />
Notional Park<br />
I<br />
Thail<strong>and</strong><br />
0 10 20 30 40km<br />
11111<br />
Cy Wildlife sanctuary<br />
see30' 99%' 9'30' I@OO<br />
Fig. 2.9. Sonre protected areas in the Upper South, Thail<strong>and</strong>.<br />
It is considered a site <strong>of</strong> high national significance for bird species dependent on mangrove<br />
habitat even though no detailed wildlife surveys were conducted there.<br />
2. Khao Phra Taeo Nonhunting Area represents the last remaining patch <strong>of</strong> primary<br />
forest in Phuket.<br />
3. Hat Nopharatthara-KO Phi Phi NP is the only marine park in <strong>Phangnga</strong> <strong>Bay</strong> outside<br />
the bay's national park; marine resources such as corals are degrading rapidly here.<br />
4. Hat Nai Yang is marginally important for turtle nesting.
Chapter 3<br />
Fisheries <strong>and</strong> Aquaculture: Resource <strong>and</strong> Economics<br />
Fisheries<br />
The Upper South marine fisheries production in 1982 was 175,600 t, constituting 8.75%<br />
<strong>of</strong> the total national output. Surat Thani contributed 98,400 t while the west coast provinces had<br />
a combined production <strong>of</strong> 77,200 t (JICA 1985).<br />
The fishermen in <strong>Ban</strong> <strong>Don</strong> area were mostly small scale. Fishing gears included shrimp<br />
gill nets <strong>and</strong> crab gill nets; although threadfin gill nets were also used. Income was primarily<br />
from catches <strong>of</strong> shrimp <strong>and</strong> swimming crab. The dominant catch in terms <strong>of</strong> income was white<br />
shrimp (Penaeus merguiensis) from a total <strong>of</strong> about 60 species <strong>of</strong> marine organisms caught.<br />
The maximum catch rate was 2.1 kglboatlday (in May). The average fishing effort using shrimp<br />
gill nets in 1981 was 240 fishing days. The total annual shrimp catch was estimated to be 150 t<br />
with a market value <strong>of</strong> about 150 million baht.* Various species <strong>of</strong> swimming crabs were<br />
recorded from crab gill nets. The maximum catch was 24.2 kglboatlday (in October). The fishing<br />
effort <strong>of</strong> 200 fishing days in 1981 supported a catch <strong>of</strong> about 1,357 t valued at 30 million baht<br />
(DOF 1983a).<br />
A survey <strong>of</strong> demersal fisheries was carried out around Samui, Phangan <strong>and</strong> Ang Thong<br />
Isl<strong>and</strong>s in 1981 to determine the demersal resources, species composition, distribution <strong>of</strong> major<br />
species <strong>and</strong> spawning periods. The average catch rate was about 40 kgthour <strong>and</strong> comprised <strong>of</strong><br />
squid, cuttlefish, crab, shrimp, octopus, whiting, sardine, herring, anchovies, gizzard shad <strong>and</strong><br />
croaker.<br />
<strong>Ban</strong> <strong>Don</strong> <strong>Bay</strong>, because <strong>of</strong> its importance as spawning <strong>and</strong> rearing grounds for<br />
anchovies, some mollusk species <strong>and</strong> club mackerel (<strong>of</strong>fshore), has been declared by DOF as a<br />
conservation zone. Trawl fishing <strong>and</strong> purse seine fishing are prohibited from 1 January to 31<br />
March <strong>and</strong> from 1 June to 31 July <strong>of</strong> every year. However, it is reported that illegal fishing (day<br />
<strong>and</strong> night) is still common, particularly by trawlers (single <strong>and</strong> twin types) on the northern side <strong>of</strong><br />
Ang Thong Isl<strong>and</strong>s for club mackerel <strong>and</strong> in the area between Ang Thong <strong>and</strong> Samui-Phangan<br />
Isl<strong>and</strong>s. Enforcement <strong>of</strong> the fishery management regulations is not effective in part because <strong>of</strong><br />
lack <strong>of</strong> manpower, equipment <strong>and</strong> budget at the district fisheries <strong>of</strong>fice at Samui (DOF 1983a).<br />
Another field survey was carried out in the same area in 1981 on the abundance <strong>and</strong><br />
species composition <strong>of</strong> fish larvae. Specimens from 42 families <strong>of</strong> fish larvae were collected.<br />
The most abundant families were Gobiidae (37%), Leiognathidae (1 4%), Clupeidae (1 Ox),<br />
Callionyrnidae (6%) <strong>and</strong> Engraulidae (5%). Fish eggs <strong>and</strong> larvae were most abundant between<br />
US$^ = 25 baht as <strong>of</strong> June 1988.<br />
30
March <strong>and</strong> May. It was concluded that the area was important as a feeding ground for fish<br />
larvae <strong>and</strong> a spawning ground for some marine fish species (DOF 1983b).<br />
Additional study was carried out in A. Tha Chang, Surat Thani Province, in 1984 to<br />
evaluate the effect <strong>of</strong> the use <strong>of</strong> push nets on demersal fish. This net catches many small fish<br />
(usually in shallow waters), including juveniles (on the nurserylfeeding grounds) <strong>of</strong> several<br />
commercially important species. The study revealed that about 43% <strong>of</strong> the catch was small-<br />
sized but <strong>of</strong> commercial value <strong>and</strong> 57% were low-value trash fish <strong>and</strong> juveniles <strong>of</strong> valuable fish.<br />
Of the trash fish, about 53% were low-quality species <strong>and</strong> 47% were juveniles <strong>of</strong> economic<br />
species (2-6 cm in length).<br />
It was deduced that the total catch per unit effort (CPUE) is not significantly declining<br />
because by modernizing the equipment, fishermen are increasing their catch efficiency but the<br />
value <strong>of</strong> CPUE is declining, reflecting the change in catch composition. Also, the number <strong>of</strong><br />
push net vessels is rapidly increasing, <strong>and</strong> thus the effect on economic fish yields is significant.<br />
It has been recommended that action be taken immediately to discourage the entry <strong>of</strong> new push<br />
net vessels into the area to protect the juveniles (Monton et al. 1984).<br />
In <strong>Phangnga</strong> <strong>Bay</strong>, fisheries surveys were carried out by Phuket Marine Fisheries Station<br />
(PMFS) staff from 1967 to 1978 to: (1) compare the abundance <strong>of</strong> fisheries resources; (2) study<br />
species composition; (3) compare the catch <strong>of</strong> valuable fish <strong>and</strong> trash fish; <strong>and</strong> (4) study the<br />
species composition <strong>of</strong> valuable fish in the trash fish component. Aside from <strong>Phangnga</strong> <strong>Bay</strong>,<br />
adjacent areas at stations 14, 17 <strong>and</strong> 18 were also surveyed. The trawling survey was<br />
conducted specifically in 1967 to 1971 <strong>and</strong> 1975 to 1978.<br />
The catch rate reached a maximum <strong>of</strong> 21 9 kglhour in 1969, with the highest at 536<br />
kglhour at station 14, which was <strong>Phangnga</strong> <strong>Bay</strong> proper (Tables 3.1 <strong>and</strong> 3.2). The catch rate<br />
decreased to 22 kglhour in 1976 <strong>and</strong> increased to 127 kglhour in 1978. The trash fish catch in<br />
the area reached a maximum <strong>of</strong> 81 % <strong>of</strong> the total catch in 1969 <strong>and</strong> dropped to 69% in 1978.<br />
The major <strong>and</strong> commercially important marine resources at station 14 were squid, wolf<br />
herring, lizardfish <strong>and</strong> gizzard shad. The percentage <strong>of</strong> penaeid shrimp, the most valuable<br />
species, decreased from 10% in 1968 to less than 1 % in 1978. The juveniles <strong>of</strong> many high-value<br />
fish such as snapper, grouper, goatfish, club mackerel, pomfret, lizardfish <strong>and</strong> threadfin bream<br />
comprised a large proportion in trash fish catch. This report was very important <strong>and</strong> effective for<br />
the decision on closing <strong>Phangnga</strong> <strong>Bay</strong> for trawl fisheries in 1979 by DOF.<br />
Table 3.1. Catch rate (kglhr) <strong>of</strong> valuable <strong>and</strong> trash fish in <strong>Phangnga</strong> <strong>Bay</strong> <strong>and</strong> the adjacent waters.<br />
"- ,- -,up<br />
Year No. <strong>of</strong> Valuable fish Trash fish Total<br />
hauls kglhr % kglhr YO kg/hr<br />
Source: DOF (1980).<br />
Table 3.2. Catch rate (kglhr) in the stations in <strong>Phangnga</strong> <strong>Bay</strong> <strong>and</strong> the adjacent waters.
The yearly composition <strong>of</strong> the average catch among the three stations indicated that<br />
station 14 in <strong>Phangnga</strong> <strong>Bay</strong> was more productive than the other two. The catch composition<br />
showed that about 50% <strong>of</strong> small valuable fish were taken in the catch, <strong>and</strong> all <strong>of</strong> them were<br />
added to the trash fish. It is assumed that many fish larvae drift into <strong>and</strong> feed in <strong>Phangnga</strong> <strong>Bay</strong>.<br />
Aquaculture<br />
NIPHOND HAEMAPRASIT AND JAMES N. PAW<br />
Aquaculture is a traditional practice in the Upper South Region, particularly in <strong>Ban</strong> <strong>Don</strong><br />
<strong>Bay</strong>. under the JlCA (1985) study, the coastal areas <strong>of</strong> <strong>Ban</strong> <strong>Don</strong> <strong>and</strong> <strong>Phangnga</strong> <strong>Bay</strong>s are<br />
tentatively designated as "aquaculture zone". The potential for further aquaculture development<br />
in the region is great considering the biophysical, oceanographic <strong>and</strong> geographic conditions<br />
prevailing, especially in the east coast.<br />
<strong>Phangnga</strong> <strong>Bay</strong> is a wide <strong>and</strong> irregular, indented bay bounded by Phuket, <strong>Phangnga</strong> <strong>and</strong><br />
Krabi provinces. The inner part is shallow with extensive mudflats becoming deeper towards the<br />
eastein part along Krabi. shrimp culture <strong>and</strong> finfish cage culture are becoming more common<br />
along the coastal waters. Mollusk culture is significant. Overall, aquaculture, except cage<br />
culture, in the west coast has declined over the years (Tables 3.3 to 3.7).<br />
Table 3.3. Blood cockle aquaculture production in Table 3.4. Production <strong>of</strong> oysters in <strong>Phangnga</strong>,<br />
<strong>Phangnga</strong>, 1979-1984. 1979-1 984.<br />
Year No. <strong>of</strong> farms Area (ha) Year No. <strong>of</strong> farms Area (ha)<br />
--<br />
Source: DOF (1986). Source: DOF (1986).<br />
Table 3 5. Shr~mp production (t) in <strong>Phangnga</strong>, 1979-1980.<br />
- -<br />
Year No. <strong>of</strong> farms Area (ha) &sntity Value Kglha<br />
," u) (x 1,000 baht)<br />
-- .<br />
Source: DOF (1986).<br />
Table 3.6. Aquaculture production (t) <strong>of</strong> short-necked dam in the provinces, 1978-1984.<br />
Churnphon<br />
Surat Thani<br />
Nakhon Si Thammarat<br />
<strong>Phangnga</strong><br />
Krabi
Table 3.7. Shrimp production (t) in Krabi, 1978-1983.<br />
Year No, <strong>of</strong> farms Area (ha) Quantsty Value<br />
(2)<br />
(X 1,000 baht)<br />
-<br />
Source: DOF (1986).<br />
Mariculture in the Upper South has also declined possibly due to water quality<br />
degradation <strong>of</strong> farming areas (TDRI 1987). Moreover, the areas are subjected to run<strong>of</strong>f from the<br />
four main rivers in the Central Plain. The <strong>Ban</strong> <strong>Don</strong> <strong>Bay</strong> area has a relatively good water quality<br />
as pollution from industrial sites <strong>and</strong> agricultural areas is minimal compared to the upper gulf<br />
area (JICA 1985).<br />
The development <strong>of</strong> the Upper South will have an apparent impact on the aquaculture<br />
activities such as siltation resulting from coastal dredging <strong>and</strong> tin mining in the west coast as<br />
well as domestic <strong>and</strong> industrial pollution due to population increase, tourism <strong>and</strong><br />
industrialization. Such resource use conflicts are <strong>of</strong>ten due to sectoral miscoordination. Thus,<br />
closer coordination among concerned government agencies <strong>and</strong> stricter enforcement <strong>of</strong><br />
environmental protection regulations are essential. A comprehensive plan is also necessary to<br />
ensure optimal use <strong>of</strong> the coastal zone (ADB 1985).<br />
Shrimp<br />
<strong>Ban</strong> <strong>Don</strong> has an abundance <strong>of</strong> natural stocks <strong>of</strong> shrimp larvae, including the<br />
economically important species Penaeus rnonodon <strong>and</strong> P. rnerguiensis, <strong>and</strong> ismore suitable for<br />
the development <strong>of</strong> shrimp farms than the west coast. In 1977, the total shrimp culture area<br />
was about 250 ha with 19 farms; production was about 50 t with a value <strong>of</strong> 897,000 baht.<br />
Shrimp culture developed very rapidly in the area with support from both the Asian Development<br />
<strong>Ban</strong>k (ADB) <strong>and</strong> the World <strong>Ban</strong>k. This led to the allocation <strong>of</strong> areas for shrimp culture to poor<br />
fishermen in 1983. The culture area was increased to more than 3,260 ha with 273 farms (Table<br />
3.8). ADB financed the brackishwater shrimplfish pond estate resettlement project amounting to<br />
US$14 million with the Department <strong>of</strong> Cooperatives Promotion, DOF <strong>and</strong> BAAC as executing<br />
agencies. This project involved the construction <strong>of</strong> shrimp farms in Surat Thani <strong>and</strong> Nakhon Si<br />
Thammarat. The World <strong>Ban</strong>k financed a similar project in Surat Thani adjacent to the ADB<br />
project with 54 farms (ADB 1985). In the Andaman Sea side, only Krabi has extensive shrimp<br />
farms.<br />
Table 3.8. Shrimp production (t) in Surat Thani<br />
Source: DOF (1986).<br />
Value<br />
(X f ,dm 'bhtl<br />
897.01<br />
895.64<br />
1,391 -20<br />
15,748.26<br />
10,920.35<br />
8,793.38<br />
20,051 -71<br />
----<br />
Kcma
Shrimp culture is generally extensive <strong>and</strong> relies on entry <strong>of</strong> fry through water pumping or<br />
on stocking <strong>of</strong> wild fry. DOF efforts to increase production through the use <strong>of</strong> hatchery-bred fry<br />
have been successful. However, the technology is yet to be widely disseminated. The prevailing<br />
problem is the lack <strong>of</strong> viable spawners <strong>of</strong> P. monodon resulting in the shifting to the culture <strong>of</strong> P.<br />
merguiensis, especially during summer months, partly due to high salinity <strong>of</strong> pond waters <strong>and</strong><br />
the abundance <strong>of</strong> spawners.<br />
The number <strong>of</strong> shrimp farms gradually increases in the Upper South every year. In 1976,<br />
there were 33 farms operating in 303 ha in Nakhon Si Thammarat. Culture area increased to<br />
6,912 ha in 1983 representing 19% <strong>of</strong> the total shrimp farm area (35,537 ha) in Thail<strong>and</strong>. In the<br />
west coast, the development <strong>of</strong> shrimp culture is not as widespread as in the gulf area. Notable<br />
shrimp producer is Krabi. The farm areas have decreased since 1980, although production has<br />
steadily increased due to adoption <strong>of</strong> better technology <strong>and</strong> culture management (Table 3.7).<br />
Cockle<br />
Cockle (Anadara granosa) culture in Surat Thani started in 1980 with seed cockle<br />
imported from Malaysia. The culture area exceeded 392 ha with two farms <strong>and</strong> 4,800-t<br />
production. Only one farm was in operation in 1984, but the culture area remained the same.<br />
Production decreased to 776 t valued at 1,656 million baht (Table 3.9).<br />
Table 3.9. Production (t) <strong>of</strong> blood cockle In Surat than^. 1979-1984<br />
. ". --<br />
Year No <strong>of</strong> forms Area (ha) Product~on<br />
In the Andaman Sea coast, cockle culture started in <strong>Phangnga</strong> in 1981 with about 100<br />
farms covering 40 ha. From 1982-1 984, the number <strong>of</strong> farms decreased to 10, but culture area<br />
increased to about 254 ha. In A. Takua Thung, the yield averaged about 2,120 kglha. Phuket<br />
<strong>and</strong> Krabi have only one farm each in operation, the former up to 1984 only.<br />
Cockle seeds (weighing less than 1.0 g each) are stocked at a density on biomass basis,<br />
at 3,375-6,750 kglha. Initially, a portion <strong>of</strong> the cockle farm is stocked. After 3 to 6 months, young<br />
cockles are redistributed over the whole culture area using mud sled. Reaching a size <strong>of</strong> 4 cm,<br />
these cockles are harvested after 1 to 1.5 years using h<strong>and</strong>-held mud rakes. Poaching <strong>and</strong><br />
illegal push netting within cockle farms are discouraged by fencing the farm boundaries <strong>and</strong><br />
posting security guards. Yield <strong>of</strong> cockle is very much dependent on the natural productivity <strong>of</strong><br />
the waters (Broom 1985; ADB 1985).<br />
Cockles used to spawn <strong>and</strong> set naturally in some coastal areas <strong>of</strong> Thail<strong>and</strong>. This<br />
problem is probably due to overfishing <strong>of</strong> cockle broodstocks <strong>and</strong> intense illegal push netting<br />
activities along the coast which disturb the substrate <strong>and</strong> kill newly set cockle seeds. Present<br />
cockle seeds are imported from Malaysia, although against Thail<strong>and</strong>'s laws. Importation,<br />
however, is not sufficient to meet local dem<strong>and</strong>. In 1983, itwas reported that natural set <strong>of</strong><br />
cockles occurred down current <strong>of</strong> a cockle farm in Nakhon Si Thammarat. Such an occurrence<br />
should prompt DOF to promote natural cockle sets by encouraging farmers to leave a portion <strong>of</strong><br />
their leased area unharvested so that some <strong>of</strong> their cultured stock can grow to broodstock size<br />
(ADB 1985).
Oysters, short-necked clam <strong>and</strong> mussel<br />
Apart from cockle, commercially important mollusk species being cultured in the Upper<br />
South are oysters (Saccostrea lugubris, S. commercialis <strong>and</strong> Crassostrea belcheri), green<br />
mussel [Perna viridis (= Mytilus srnaragdinus)], short-necked clam (Paphia undulata) <strong>and</strong> pearl<br />
oyster (Pinctada sp.). The last one was cultured for sometime between 1979 <strong>and</strong> 1984 in<br />
Phuket with one farm operating a culture area <strong>of</strong> 0.53 ha.<br />
S. lugubris is a major aquaculture product <strong>of</strong> Surat Thani. It is more expensive than S.<br />
commercialis <strong>and</strong> is in great dem<strong>and</strong> for fresh consumption. In 1979, the culture area was 83 ha<br />
with about 100 farms <strong>and</strong> a production <strong>of</strong> 530 t. The culture area increased in 1984 to 158 ha<br />
with 214 farms; production was around 590 t valued at 11.7 million baht (Table 3.1 0).<br />
Table 3.10. Production (t) <strong>of</strong> oysters in Surat Thani.<br />
~ .<br />
Year No. <strong>of</strong> farms Areas (ha) Production<br />
Oyster spats occur during May-July <strong>and</strong> October-November. Methods <strong>of</strong> culture range<br />
from traditional to semitraditional, <strong>and</strong> the most suitable for a particular area depends on the<br />
bottom condition (Saraya 1982). Date-palm <strong>and</strong> bamboo stakes are used as cultch in certain<br />
areas in Ranong <strong>and</strong> Surat Thani. Stake method is usually practiced on s<strong>of</strong>t <strong>and</strong> muddy bottom.<br />
Spats settling on cultch are allowed to grow for a year before harvesting.<br />
<strong>Ban</strong> <strong>Don</strong> <strong>Bay</strong> is a very important seedbed for short-necked clams. Clams are harvested<br />
from nature, <strong>and</strong> no culture activities are done. In 1976, total harvest was 4,700 t. Harvest in<br />
1984 was 33,360 t valued at 61.5 million baht. For mussel, culture started in Phuket in 1984 with<br />
two farms having a total culture area <strong>of</strong> 32 ha.<br />
Fish cage <strong>and</strong> pond culture<br />
Cage culture is popular in the Andaman Sea side because <strong>of</strong> the several protected bays<br />
<strong>and</strong> coves. Species being cultured are grouper (Epinephelus spp.) <strong>and</strong> sea bass (Lates<br />
calcarifer). Coastal waters are relatively unpolluted except near mining areas, <strong>and</strong> the wide tidal<br />
fluctuations provide ideal conditions for cage culture. In contrast, the east coast has fewer<br />
protected bays. Water pollution, especially from the Upper Gulf area, as well as the low tidal<br />
range limit the potential for cage culture (ADB 1985).<br />
Grouper culture is popular along the coastline <strong>of</strong> Krabi, Satun <strong>and</strong> <strong>Phangnga</strong> provinces.<br />
More than 300 families own about 250 farms with 1,025 cages in about 1 ha. <strong>Phangnga</strong> <strong>Bay</strong> has<br />
more than 75% <strong>of</strong> the total number <strong>of</strong> grouper farmers. Grouper fingerlings, at an average<br />
weight <strong>of</strong> 100-300 g at 10-1 6 bahtlpiece (pc), are collected from natural waters. Trash fish are<br />
used as feed. Culture duration is 6-7 months. The selling price <strong>of</strong> reared fish differs by sizes, as<br />
follows: 0.4-0.8 kg - 85-1 00 bahtlkg; 0.9-1 kg - 75-85 bahtlkg; <strong>and</strong> zl kg - 65-75 bahtlkg. These<br />
are prices in the export wholesale market. Exporters sell to the markets in Malaysia <strong>and</strong><br />
Singapore at 120-1 50 bahtlkg <strong>of</strong> grouper 0.4-0.8 kg in size.
The estimated costs <strong>of</strong> grouper cage culture for the small, medium <strong>and</strong> big farms were<br />
22,700; 41,910; <strong>and</strong> 88,960 baht, respectively. The average returns by size were 35,585;<br />
65,270; <strong>and</strong> 117,170 baht, respectively. And the average pr<strong>of</strong>its by size, respectively, were<br />
12,885; 23,360; <strong>and</strong> 28,210 baht.<br />
Sea bass are either cultured in netcages or in ponds with the former being more widely<br />
done. In 1984, there were about 160 farms <strong>and</strong> 390 netcages with a total area <strong>of</strong> 0.9 ha in<br />
Trang, <strong>Phangnga</strong> <strong>and</strong> Ranong provinces.<br />
The initial size <strong>of</strong> fingerlings used in rearing is 1.5-2.5 cm in length at 1.5-2.5 bahWpc. At<br />
first, farmers nurse fingerlings in the nursing pond for 3-4 months until these grow to 7.5-1 0 cm.<br />
Then, juveniles are transferred to cages at a stocking density <strong>of</strong> 10-30 pclm? Trash fish are<br />
used as feed. Culture period is 8-1 0 months. The fish can grow to a marketable size <strong>of</strong> more<br />
than 500 g. The selling price is about 65-80 bahukg.<br />
An important factor in the expansion <strong>of</strong> cage culture <strong>of</strong> sea bass is the mass production<br />
<strong>of</strong> fry in DOF <strong>and</strong> private sector hatcheries. Most <strong>of</strong> these fry are sold to nursery operators who<br />
rear them to fingerling size <strong>and</strong> export them to Hong Kong, Taiwan <strong>and</strong> Singapore. However,<br />
some fingerlings are reared to marketable sizes for domestic consumption (ADB 1985).<br />
A major problem in grouper culture is the availability <strong>of</strong> fry since hatchery production is<br />
still experimental. For sea bass, mortalities from cannibalism <strong>and</strong> disease result in survival rates<br />
<strong>of</strong> only 20-30%, thus the needs for further improvement in rearing techniques. The development<br />
<strong>of</strong> both grouper <strong>and</strong> sea bass cultures is also constrained by the availability <strong>of</strong> high-quality but<br />
low-priced feeds.
Chapter 4<br />
Tourism: Resource <strong>and</strong> Economics<br />
ROBERT DOBIAS<br />
The major tourist areas in the Upper South--Phuket, <strong>Phangnga</strong>, Krabi <strong>and</strong> Surat Thani--<br />
are situated among three large tourism markets, namely, <strong>Ban</strong>gkok, Singapore <strong>and</strong> Kuala<br />
Lumpur. This situation has allowed recent tourist increases in the four areas. In contrast to other<br />
tourist spots in the country where entertainment type <strong>of</strong> attractions are dominant, the Upper<br />
South generally <strong>of</strong>fers scenic sites <strong>and</strong> desirable environment such as beaches, coral reefs <strong>and</strong><br />
cultural/historical sites. In Phuket, an isl<strong>and</strong> resort, the beaches are a prime attraction. Within<br />
<strong>Phangnga</strong> <strong>Bay</strong>, the <strong>Phangnga</strong> <strong>Bay</strong> NP <strong>of</strong>fers unique attractions composed <strong>of</strong>, among others,<br />
limestone isl<strong>and</strong>s with overhanging cliffs; the famous Phingkan Isl<strong>and</strong> (also sometimes called<br />
"James Bond Isl<strong>and</strong>"); <strong>and</strong> the Muslim sea village in Panyi Isl<strong>and</strong>. In Krabi, the coral reefs in the<br />
Phi Phi NP are the main coastal tourist spot.<br />
Surat Thani Malnl<strong>and</strong><br />
TlSTR (1 985) identified 42 potential <strong>and</strong> existing tourist spots in the Surat Thani<br />
Mainl<strong>and</strong> <strong>and</strong> classified them into natural (27 sites); historical <strong>and</strong> religious (12), which are the<br />
prominent features; <strong>and</strong> artistic <strong>and</strong> cultural (3) attractions (Fig. 4.1).<br />
Surat Thani Province received 256,180 tourists in 1981 ; 204,370 in 1982; <strong>and</strong> 21 8,850 in<br />
1984, <strong>of</strong> which 15% were non-Thais, About 45% visited A. Chaiya <strong>and</strong> 279'0, Surat Thani City.<br />
The province's share <strong>of</strong> national tourism in 1984 was 1.0%, but 1.4% <strong>of</strong> non-Thai tourists in the<br />
country visited the province, mainly Samui.<br />
The Tourism Authority <strong>of</strong> Thail<strong>and</strong> (TAT) forecasted that tourism volume will be 246,560<br />
in 1987; 293,575 in 1992; <strong>and</strong> 338,220 in 1997. About 40% will visit A. Chaiya <strong>and</strong> 24% Surat<br />
Thani City. The proportion <strong>of</strong> non-Thai tourists is expected to grow from 17% in 1985 to 21 % in<br />
1987 (TAT 1986a). JlCA (1 985) forecasted, on the other h<strong>and</strong>. 330.000 in 1990 <strong>and</strong> 756,000 in<br />
the year 2000.<br />
In 1981, the mainl<strong>and</strong> had 30 hotels <strong>and</strong> 1,060 rooms which increased to 40 hotels <strong>and</strong><br />
1,710 rooms in 1985. Surat Thani City had 19 hotels <strong>and</strong> 1,395 rooms in 1985, while Phun Phin<br />
had 14 hotels <strong>and</strong> 247 rooms. Occupancy was about 50% for the city's hotels <strong>and</strong> 40% for Phun<br />
Phin's (TAT 1986a).<br />
The province's road network is generally quite good, but some access roads to tourist<br />
sites remain in poor condition. Air, rail <strong>and</strong> bus services to Surat Thani are relatively sufficient.<br />
Electricity supply will greatly be enhanced when Chiew Larn Dam becomes operational after
"<br />
i<br />
0<br />
Khlrl RaldOnlkhm<br />
14<br />
13 ,Phanom<br />
<strong>Ban</strong> TO Khun<br />
Strait <strong>of</strong> MotoCCo<br />
PL mln I<br />
2<br />
~gn ~a San f<br />
\<br />
Knao Pmnom<br />
I<br />
/.<br />
<<br />
r'<br />
Nalthon $1<br />
Trang<br />
Thammarat<br />
1.<br />
2.<br />
3.<br />
4.<br />
5.<br />
6.<br />
7.<br />
8.<br />
9.<br />
10.<br />
11.<br />
12.<br />
13.<br />
14.<br />
15.<br />
16.<br />
17.<br />
18.<br />
19.<br />
20.<br />
21.<br />
22.<br />
23.<br />
24.<br />
25.<br />
26.<br />
27.<br />
28.<br />
29.<br />
30.<br />
31.<br />
32.<br />
33.<br />
34.<br />
35.<br />
36.<br />
37.<br />
38.<br />
Khao Tha Phet<br />
Bung Khun Thale<br />
Laern Sui<br />
Laern Pho<br />
Wat Phra Borommathat Chaiya<br />
Suan Mokkhaphalaram<br />
Phumriang<br />
Thung Sai Ngam<br />
KO Nok Pao Kikan<br />
Klang Thong Waterfall<br />
Wiphawadi Waterfall<br />
Suan Phai Weruwan<br />
Khao Sok National Park<br />
Chiew Larn Dam<br />
Wiang Sa Ancient Village<br />
KO Samui<br />
KO Phangan<br />
Mu KO Ang Thong National Park<br />
Hat Nopharatthara Beach<br />
Phra Nang <strong>Bay</strong><br />
Fossil Shells<br />
KO Phi Phi Isl<strong>and</strong><br />
Wat Thurn Sua<br />
Huai To Waterfall<br />
Lignite Mine<br />
Sodet Cave<br />
Hin Phoeng Waterfall<br />
Har Bo Marnuang Beach<br />
Sa Kaco<br />
Phet Cave<br />
Phra Cave<br />
Suan Rukachat Than Bok Khorani<br />
Tharn Lot, Tham Phi Hua To<br />
Laem Sak<br />
Laem Kho Kwang<br />
Khlong Haeng Waterfall<br />
Ton Han Watel-fall<br />
Hat Thai Muang Beach<br />
Fig 4.1, Some tourist spots in Surat<br />
Thani (ahove) <strong>and</strong> <strong>Phangnga</strong>IKrabi<br />
(below).
1987. Water supply is a severe limitation in the mainl<strong>and</strong>. Telecommunications are adequate<br />
<strong>and</strong> are still being exp<strong>and</strong>ed, Entertainment places are restricted to bars <strong>and</strong> nightclubs.<br />
General deterioration <strong>of</strong> water quality was not yet a problem in 1985, but lack <strong>of</strong> plans for<br />
treatment in the near future may result in significant pollution. Community waste water is passed<br />
through drainage pipes or open drains. The oil palm <strong>and</strong> whisky industries are major sources <strong>of</strong><br />
wastewater in Tapi River. The Department <strong>of</strong> Town <strong>and</strong> Country Planning (DOTCP) produced a<br />
l<strong>and</strong> use plan for mainl<strong>and</strong> communities in 1985, but the present situation is chaotic, in general.<br />
Revenue from tourism in 1984 was about 242.4 million baht, with Thai tourists<br />
contributing 75% <strong>of</strong> the total. Revenue projections for 1986 <strong>and</strong> 1991 are 300.6 million baht <strong>and</strong><br />
467.5-773.5 million baht, respectively. Tourism has not caused much change in the mainl<strong>and</strong>'s<br />
socioeconomic status (TISTR 1985).<br />
Samui <strong>and</strong> Satellite Isl<strong>and</strong>s<br />
The major tourism resources are the many beaches, corals <strong>and</strong> natural attractions in<br />
Samui <strong>and</strong> Phangan Isl<strong>and</strong>s <strong>and</strong> Mu KO Ang Thong NP. The majority <strong>of</strong> coral reefs have been<br />
destroyed or seriously degraded. However, some good ones still remain (Fig. 2.8).<br />
Tourism volume in Samui has experienced a radical surge. In 1980, there were only<br />
about 14,870 visitors; this increased to 33,155 in 1981. In 1982, there were 138,785 <strong>and</strong> in<br />
1984, there were 142,320 (65% <strong>of</strong> all tourists in Surat Thani Province). Non-Thais accounted for<br />
I8O/o <strong>of</strong> tourism volume in 1984 (Fig. 4.2). In 1984, Phangan tourists totaled 22,910 <strong>and</strong> Mu KO<br />
Ang Thong NP had 54,155 (TISTR 1985).<br />
- Total<br />
tourists<br />
~n-Thai rourisra<br />
100 ,--,<br />
Fig. 4.2. Comparison <strong>of</strong> Non-Thai visitors with told visitors at KO Samui,<br />
1980-1984.<br />
The Thail<strong>and</strong> Institute <strong>of</strong> Scientific <strong>and</strong> Technological Research (TISTR) projections for<br />
tourism growth in Samui, Phangan <strong>and</strong> Mu Ko Ang Thong NP were, respectively: 155,035;<br />
25,260; <strong>and</strong> 58,160 in 1986; 186,810; 31,245; <strong>and</strong> 68,120 in 1991 ; <strong>and</strong> 21 6,935; 36,900; <strong>and</strong><br />
77,620 in 1996.<br />
Non-Thais were expected to make up 19% <strong>of</strong> the tourism volume in 1986 <strong>and</strong> 24% in<br />
1996 in Sarnui; 32% <strong>and</strong> 39%, respectively, in Phangan; <strong>and</strong> 5% <strong>and</strong> 7% respectively, in Mu KO<br />
Ang Thong NP. Most non-Thais will tend to be young <strong>and</strong> to be students, hired laborers or<br />
teachers. They will average 14 days in Samui, <strong>and</strong> each will spend about 186 bahtlday; while<br />
Thai tourists will average 2.5 days <strong>and</strong> each will spend about 593 bahtlday.
The roads in Samui are good though they still need improvement. Express boats run<br />
from the mainl<strong>and</strong> to Samui twice daily, taking about three hours per way. There is a temporary<br />
airport in Samui. There is severe water shortage in Phangan <strong>and</strong> Samui.<br />
Marine pollution in Sarnui <strong>and</strong> the other major isl<strong>and</strong>s was not a problem in 1984,<br />
according to TISTR, though some were registered <strong>of</strong>f Hat Lamai. Pollution became significant in<br />
some areas around 1987. Garbage collection is a problem in Phangan <strong>and</strong> Samui. TISTR stated<br />
that the good quality <strong>of</strong> marine water in 1985 could deteriorate quickly if more buildings would<br />
be constructed near beaches <strong>and</strong> water sources. Though l<strong>and</strong> uses in beach areas did not pose<br />
significant problems, l<strong>and</strong> use plans <strong>and</strong> controls, however, should be formulated <strong>and</strong> enforced<br />
without delay.<br />
Collecting corals, fishing <strong>and</strong> natural disasters have led to destruction <strong>of</strong> coral reefs in<br />
the area. About 75% <strong>of</strong> the reefs surveyed by TISTR suffered medium to severe deterioration.<br />
Tourism revenue in Samui in 1984 was estimated to be 154.81 million baht; Thai tourists<br />
comprised 67% <strong>of</strong> the total (TISTR 1985). The majority <strong>of</strong> Thai expenditures went to transport<br />
(41%) <strong>and</strong> food (24%); while those <strong>of</strong> non-Thais went to food (49%) <strong>and</strong> accommodation (26%).<br />
Tourism, thus, has made a substantial economic impact.<br />
Phuket<br />
Phuket is the Upper South's major tourist attraction, with its beaches as its major assets.<br />
Phuket has no less than 10 good recreational features, including those for marine activities such<br />
as boating <strong>and</strong> diving. The development <strong>of</strong> this isl<strong>and</strong> <strong>and</strong> its attractions is more advanced than<br />
any other area in the Upper South. The potential for further development remains, particularly<br />
concerning improvement <strong>of</strong> utility services, parks <strong>and</strong> amenities. Most <strong>of</strong> the tourists spend not<br />
less than 7 days. Approximate tourism income was 375.5 million baht in 1981 ; 546.2 million baht<br />
in 1982; <strong>and</strong> 705 million baht in 1983.<br />
Phuket attracted 6% <strong>of</strong> Thail<strong>and</strong>'s total non-Thai tourist volume in 1985. The number <strong>of</strong><br />
hotel guests increased to 137% between 1981 -1 985 (TAT 1986). The recorded estimated<br />
volumes were: 1981 - 145,700; 1983 - 233,670; I984 - 239,950; <strong>and</strong> 1985 - 345,270. These<br />
figures are in marked contrast to forecasts made in the 1979 Master Plan (PC1 Design 103 Ltd.,<br />
1979), which predicted 302,700 guests in 1987, <strong>and</strong> in the JlCA report (1 985), which forecasted<br />
333,000 guests by 1990 (Table 4.1 <strong>and</strong> Fig. 4.3). Changes in tourism revenue for 1981 -1983 are<br />
shown in Table 4.2.<br />
\<br />
Table 4.1. Forecasts on the number <strong>of</strong> hotel guests in the Upper South, Thail<strong>and</strong>, 1980-2000. Unit: 1,000 personslyr.<br />
1980 2000 Average gmwth rare (%)<br />
Phuket Non-Thai 52.9 120 273<br />
Thai 92.8 213 49 1<br />
Total 145.7 333 764 8.6<br />
Surat Thani Non-Thai 22.7 52 119<br />
f hai 121.1 278 637<br />
Total 143.8 330 756 8.7<br />
Krabi Non-Thsi 0.3 1 2<br />
Thai 28.3 65 151<br />
Total 28.6 66 153 8.8<br />
<strong>Phangnga</strong> Non-Thai 5.0 11 26<br />
Thai 20.2 46 104<br />
Total 25.2 57 130 8.6<br />
Upper South Non-Thai 80.9 184 420<br />
Thai 262.4 602 1,383<br />
Total 343.3 786 1,803 8.7
*.+ Actual<br />
JICA forecoat (19051<br />
4---a f aster Plan fafacart 11979)<br />
Fig. 4.3. Forecast vs. actual volume <strong>of</strong> tourists<br />
at Phuket, 1981-2000.<br />
Table 4.2. lnwme from tourism for<br />
Phuket, 1981-1983.<br />
Year Income (baht)<br />
Tourists have begun moving from city to beach accommodations undoubtedly due to the<br />
rapid increase in the latter's facilities. The number <strong>of</strong> non-Thais in proportion to the total number<br />
<strong>of</strong> visitors rose from 24OA in 1980 to 45% in 1985 (Fig. 4.4). The city-to-beach guest ratio was<br />
highest in 1983 (64:36), but in 1985, the ratio (48:52) was reversed in favor <strong>of</strong> beach<br />
accommodations.<br />
- .---a TIW wsts<br />
Non-Than<br />
--4 Total<br />
pasta<br />
Year<br />
/'<br />
i<br />
,/'<br />
Fig. 4.4. Forecasts on the number <strong>of</strong> hotel<br />
guests in the Upper South,Thail<strong>and</strong>.<br />
Patong Beach, <strong>of</strong> all beaches, received the most hotel guests (45,150), 38% <strong>of</strong> the total<br />
in 1985. This represented a decrease from the 1984 level (46%) due to a larger choice <strong>of</strong> beach<br />
facilities. The hotel guest volumes <strong>and</strong> relative percentages <strong>of</strong> large hotels in the city <strong>and</strong><br />
various beaches is presented in Table 4.3.<br />
The number <strong>of</strong> city hotels <strong>and</strong> rooms decreased slightly from 1981 to 1985 while that <strong>of</strong><br />
beaches increased dramatically. In 1982, there were 25 hotels <strong>and</strong> 1,485 rooms in Phuket but<br />
these dropped to 21 <strong>and</strong> 1,323, respectively, in 1985. Conversely, beach accommodations rose<br />
from 52 hotels/bungalows <strong>and</strong> 1 ,I 82 rooms in 1981 to 94 <strong>and</strong> 2,650 in 1985. These represent<br />
an increase <strong>of</strong> 81% in the number <strong>of</strong> accommodations <strong>and</strong> 124% in that <strong>of</strong> rooms (Table 4.4).<br />
Patong Beach experienced the largest increase in hotel rooms, from 365 in 1981 to<br />
1,185 in 1985 or an increase <strong>of</strong> 226% over five years <strong>and</strong> 57% above the 1984 figure. Karon
Table 4.3. hotel guest volumas <strong>and</strong> percentages <strong>of</strong> hotels with over 50<br />
moms for major Phuket beaches <strong>and</strong> Phuket City in 1985.<br />
Place NO. <strong>of</strong> guesh * % Hotels with<br />
over 50 rmms<br />
Patong 45,153 20<br />
Karon 16.427 0<br />
Kata 21,471 8<br />
Phuket City 226.883 36<br />
Table 4.4. Comparison <strong>of</strong> increases in the number <strong>of</strong> hotel rooms in various Phuket locations.<br />
- ... . . - -- ,-<br />
No, <strong>of</strong> hoUl rooms<br />
Year City Patong Kata Karon Other beaches All beachos Total<br />
, -<br />
1977 890 480 1,370<br />
(-) (-) !-)<br />
1981 1.338 364 231 99 488 1.182 2,520<br />
(50%) (-) (-) (") (-1 (1 46%) (84%)<br />
1982 1,465 457 256 99 530 1.342 2,827<br />
(1 1%) (26%) (1 1%) (0%) (9%) (1 4%) (1 2%)<br />
1983 1,414<br />
(-5%)<br />
1984 1,325 868 414 139 599 2.020 3.345<br />
(-7%) (90%) (62%) (40%) (13%) (51%) (1 8%)<br />
1985 1,323 1.185 489 272 704 2.650 3.973<br />
(-0.2%) (37%) (1 8%) (96%) (1 8%) (31%) (1 9%)<br />
Increase -15 821 258 173 216 1.468 1,453<br />
1981-I985 (-1.1%) (226%) (1 12%) (1 75%) (44%) (1 24%) (56%)<br />
Beach had the most rapid increase from 1984-1 985; 140 to 270 rooms or an increase <strong>of</strong> 175%.<br />
In 1985, Kata, the third major beach, had 490 rooms, an 18% increase over 1984 (TAT 1986b).<br />
The number <strong>of</strong> rooms on the isl<strong>and</strong> in 1985 already exceeded by 713 the Phuket Master<br />
Plan's (PMP) projections for 1987; beach rooms in 1985 were 1,240 rooms above the 1987<br />
projection. The JICA report (1985) recommended that the total number <strong>of</strong> beach rooms should<br />
not exceed 2,780 to maintain a high-quality resort environment. However, an excess will occur<br />
with the opening in 1987 <strong>of</strong> the new Pearl Hotel near Nai Yang Beach.<br />
The average occupancy rates in 1985 were 46% in the beaches <strong>and</strong> 49% in the city (Fig.<br />
4.5). Rates in the beaches fluctuated from 73% in December to 26% in September; while those<br />
- Patong<br />
...... Karon<br />
100 - Kata<br />
Phuket C~fy<br />
Avaroga<br />
(all accommodomns)<br />
J F M A M J J A S O N D<br />
Month<br />
Fig. 4.5. Comparison <strong>of</strong> average hotel occupancy rates<br />
at Phuket, 1985.
in the city were 62% in December <strong>and</strong> 37% in September. Average length <strong>of</strong> stay for all visitors<br />
was 1.82 days in the city <strong>and</strong> 6.25 days in the beaches (TAT 1986a).<br />
The opening <strong>of</strong> Phuket Airport to international flights has also helped increase access to<br />
the province, but dem<strong>and</strong> still appears to be higher than available seats, at least on weekends<br />
<strong>and</strong> during the peak holiday seasons. The supply <strong>of</strong> piped water is a major service problem. The<br />
JlCA (1 985) report stated that some beach establishments were spending 37 bahVm3 for<br />
potable water. Communication routes within the province are still insufficient. The same report<br />
does not comment on environmental conditions except to stress the need for addressing this<br />
issue <strong>and</strong> to recommend a ceiling on beach development.<br />
PMP identified tin mining as a major factor in water quality deterioration, though it stated<br />
that general water quality in 1979 was excellent. The plan also recommended a ban on<br />
dynamite fishing <strong>and</strong> spearfishing as well as control <strong>of</strong> coral collection <strong>and</strong> tropical fish export.<br />
PMP estimated that 2,200 people worked in the tourism industry in 1979, roughly half <strong>of</strong><br />
whom were employed by hotels directly. This accounted for about 5% <strong>of</strong> the total provincial<br />
employment. The plan projected a need for 6,600 hotel employees between 1988-1 997 <strong>and</strong> 30-<br />
40 additional trained guideslinterpreters per year. The JlCA report, on the other h<strong>and</strong>, estimated<br />
that tourism expenditure (hotel guests only) will reach 3.1 billion baht in the year 2000 for the<br />
entire Upper South; Phuket's share <strong>of</strong> this will be substantial.<br />
<strong>Phangnga</strong> <strong>and</strong> Krabl<br />
TAT identified 36 tourist areas in <strong>Phangnga</strong> <strong>and</strong> Krabi, 8 <strong>of</strong> which are nature-based<br />
having good potential for tourism development: <strong>Phangnga</strong> <strong>Bay</strong> NP; Khao Lam Pi Forest Park;<br />
Thai Muang Beach; KO Phi Phi NP; Fossiliferous (Shell) Cretaceous Formation near Ao Phra<br />
Nang; Hat Nopharatthara Beach; Phra Nang <strong>Bay</strong>; <strong>and</strong> Suan Rukachat Than Bok Khorani Park<br />
(Fig. 4.1). The first 3 sites are in <strong>Phangnga</strong> <strong>and</strong> the rest, in Krabi.<br />
The JlCA report (1 985) added Wat Suwannakuha (cave), <strong>Phangnga</strong> Waterfall <strong>and</strong> Khao<br />
Lak Forest Park in <strong>Phangnga</strong>; <strong>and</strong> Saet Cave <strong>and</strong> the islets <strong>of</strong> Khao Khanab Nam in Krabi.<br />
<strong>Phangnga</strong> <strong>Bay</strong> <strong>and</strong> KO Phi Phi NP have good potential for tourism development <strong>and</strong> are<br />
expected to attract mainly Thai tourists.<br />
Most tourists do not consider <strong>Phangnga</strong> as the primary destination in their tour despite<br />
its natural attractions. They come to <strong>Phangnga</strong> by passing through Phuket. They usually spend<br />
the day in the former <strong>and</strong> the night in the latter.<br />
There are many problems on the development <strong>of</strong> tourism in <strong>Phangnga</strong>:<br />
1. Environmental degradation, e.g., at waterfalls <strong>and</strong> caves;<br />
2. Private invasion, i.e., squatters who sell items to tourists <strong>and</strong> occupy public l<strong>and</strong>;<br />
3. Comrnmity change;<br />
4, Communication <strong>and</strong> transportation: because tourism places are mostly located out<br />
at sea, many tourists would not go by boat during the monsoon season; <strong>and</strong><br />
5. Poor maintenance.<br />
Both <strong>Phangnga</strong> <strong>and</strong> Krabi Provinces depend on Phuket for tourists as the majority <strong>of</strong><br />
them do not consider the provinces as primary destinations. However, while Phuket tourism<br />
volume has increased substantially since 1983, visits to <strong>Phangnga</strong> <strong>Bay</strong> have decreased (Fig.<br />
4.6). <strong>Phangnga</strong> <strong>and</strong> Krabi rely mainly on domestic tourists (about 80% in the former <strong>and</strong> 98% in<br />
the latter).<br />
In 1981, Krabi received 472,695 tourists, the majority presumably Thai day-visitors from<br />
Surat Thani, Trang <strong>and</strong> other neighboring provinces. <strong>Phangnga</strong> received 185,604 tourists in the<br />
same year, most <strong>of</strong> whom visited <strong>Phangnga</strong> <strong>Bay</strong> NP.
[7 Phuket<br />
<strong>Phangnga</strong> <strong>Bay</strong> NP<br />
1983<br />
Year<br />
Fig. 4.6. Comparison <strong>of</strong> tourism volume <strong>of</strong> Phuket <strong>and</strong> <strong>Phangnga</strong> <strong>Bay</strong> NP,<br />
1981-1985, Sratistics for <strong>Phangnga</strong> <strong>Bay</strong> in 1981 <strong>and</strong> for Phuket in 1982<br />
are nor available. Statistics for <strong>Phangnga</strong> <strong>Bay</strong> included only 10 mon'ths<br />
in 1981 <strong>and</strong> 9 months in 1985. Total volume was estimated by adding<br />
17% <strong>and</strong> 25%, respectively, to rhe recorded volume.<br />
TAT'S forecasts <strong>of</strong> hotel guests for <strong>Phangnga</strong>IKrabi were, respectively: 1986 - 85,6151<br />
35,230; 1991 - 1 OS,783/43,915; 1996 - 125,638150,970; <strong>and</strong> 2001 - li'l,435/59,090. The<br />
proportion <strong>of</strong> <strong>Phangnga</strong>'s non-Thai visitors is expected to remain at about 22% <strong>of</strong> the total until<br />
the year 2001 when it will inexplicably jump to 34%, <strong>and</strong> that for Krabi is expected to be about<br />
2% throughout the period.<br />
In 1985, <strong>Phangnga</strong> had 23 hotels, the same number as in 1981, <strong>and</strong> 615 rooms, an<br />
increase <strong>of</strong> 38 rooms. Krabi had 7 hotels in 1985, 1 less than in 1981, but the number <strong>of</strong> rooms<br />
increased to 316 which is 83 more than in 1981. <strong>Phangnga</strong> has one first-class hotel <strong>and</strong> Krabi,<br />
one good quality bungalow resort. It can be assumed that neither province gains substantially<br />
from tourism at present because both do not attract significant numbers <strong>of</strong> multipleday, high-<br />
spending visitors.<br />
Communication routes, public services <strong>and</strong> the level <strong>of</strong> utilities development are all<br />
insufficient. Nevertheless, it does not appear that special effort for provision <strong>of</strong> additional<br />
accommodation or improvement <strong>of</strong> other services is needed except as regards normal rural<br />
development operations. In the future, however, <strong>Phangnga</strong> <strong>and</strong>/or Krabi will need to strengthen<br />
tourism infrastructure in anticipation <strong>of</strong> spillover from Phuket.<br />
The only mention <strong>of</strong> environmental conditions in the reviewed literature is on problems<br />
with <strong>of</strong>fshore tin mining along <strong>Phangnga</strong>'s west coast. Two other concerns that should be<br />
mentioned are mangrove cutting in <strong>Phangnga</strong> <strong>Bay</strong> <strong>and</strong> destruction <strong>of</strong> corals around Phi Phi<br />
through blast fishing.
Chapter 5<br />
Other Economic Sectors<br />
SUBARN PANVISAVAS, PRAGUYRUT SUKUMALACHART<br />
AND WILASINEE WONGPRASERT<br />
In 1984, the Gross Provincial Product (GPP) (at 1972 fixed price) <strong>of</strong> Surat Thani was<br />
5,286.2 million baht or about 11 % <strong>and</strong> 1 % <strong>of</strong> the regional product <strong>of</strong> the South <strong>and</strong> Thail<strong>and</strong>,<br />
respectively.<br />
Agriculture is the most important economic sector with about 57% <strong>of</strong> the total production<br />
value. However, it is now faced with fluctuation in production <strong>and</strong> marketing problems. The GPP<br />
is exp<strong>and</strong>ing in the wholesale <strong>and</strong> retail trade <strong>and</strong> the services sectors. The latter is especially<br />
high, affecting socioeconomic development <strong>of</strong> the region especially tourism.<br />
<strong>Phangnga</strong>, in 1984, had a GPP value <strong>of</strong> 2,876.7 million baht at 1972 fixed price or about<br />
6% <strong>and</strong> 0.6% <strong>of</strong> the provincial products <strong>of</strong> the South <strong>and</strong> the country, respectively (Table 5.1).<br />
With a provincial production <strong>of</strong> 4394, agriculture is also the main economic activity; followed by<br />
mining <strong>and</strong> forestry with about 18% <strong>and</strong> 10% <strong>of</strong> the GPP, respectively.<br />
In 1984, Phuket had a GPP <strong>of</strong> 1,673.3 million baht or 3.45% <strong>and</strong> 0.4% <strong>of</strong> the regional<br />
product <strong>of</strong> the South <strong>and</strong> the country, respectively, at 1972 fixed price. Apart from agriculture,<br />
the wholesale <strong>and</strong> retail trade sector is second in importance, constituting 12% <strong>of</strong> the GPP<br />
(TISTR 1984) (Table 5.1).<br />
Half <strong>of</strong> Phuket's area is used for agriculture, i-e., planting rubber, which was the main<br />
source <strong>of</strong> income (about 259 million baht) in 1984. The second most significant crop is coconut<br />
which earns 46 million baht, followed by orchard products at 33 million baht (TISTR 1984).<br />
In Surat Thani, rubber comprises a total <strong>of</strong> 379,705 t; accounts for the most cultivated<br />
l<strong>and</strong> in this province; <strong>and</strong> ranks sixth in Thail<strong>and</strong>. A. <strong>Ban</strong> Na San is the most productive,<br />
followed by Phun Phin <strong>and</strong> A. Wiang Sa. The agricultural income <strong>of</strong> Surat Thani depends to a<br />
large degree on rubber. Production problems are: reduction in the world price <strong>of</strong> rubber; quality<br />
<strong>of</strong> rubber; <strong>and</strong> lack <strong>of</strong> bargaining groups. Potential solutions to these are: educating farrnors<br />
about improved production methods <strong>and</strong> setting government policies concerning price supports<br />
<strong>and</strong> foreign market outlets.<br />
In <strong>Phangnga</strong>, rubber is second only to mineral extraction in GPP value. The areas for<br />
rubber cultivation are A. Takua Thung, A, Muang, A. Thai Muang <strong>and</strong> King A. Khura Buri. Most<br />
plantations are small <strong>and</strong> use family labor. Fertilizers are applied without pesticides. Raw rubber<br />
is sent out to Phuket's factories <strong>and</strong> exported to Singapore, Malaysia, Engl<strong>and</strong> <strong>and</strong> Japan. The<br />
problems with rubber production are that the owners receive only a small income because <strong>of</strong><br />
small l<strong>and</strong>holdings; poor soil quality; <strong>and</strong> lack <strong>of</strong> water <strong>and</strong> suitable l<strong>and</strong> for expansion.
Table 5.1. Comparison <strong>of</strong> gross product in 1984 at constant 1972 prices <strong>of</strong> <strong>Phangnga</strong>, Phuket <strong>and</strong> Surat Thani with the Southern Region <strong>and</strong> the country (million baht).<br />
<strong>Phangnga</strong> Phuket Surat Thani<br />
Production Gross Gross Gross<br />
sector product Percentage product Percentage product Percentage<br />
Agriculture<br />
Fisheries<br />
Forestry<br />
Mining-quarrying<br />
Manufacturing<br />
Construction<br />
Electricity <strong>and</strong><br />
water supply<br />
Transportation-<br />
communication<br />
Wholesale <strong>and</strong><br />
retail trade<br />
<strong>Ban</strong>king insurance<br />
Ownership <strong>of</strong><br />
dwelling<br />
Public administra-<br />
tion <strong>and</strong><br />
defense<br />
Services<br />
Total<br />
Southern Regton<br />
Percentage<br />
Gross Su rat<br />
product <strong>Phangnga</strong> Phuket Than1<br />
Source: Statistics from the National Income Account, Office <strong>of</strong> the National Economic <strong>and</strong> Social Development Board, Thail<strong>and</strong>.<br />
Country<br />
Percentage<br />
Gross Surat<br />
product <strong>Phangnga</strong> Phuket Thani
Development should be geared to hybridization, adequate use <strong>of</strong> fertilizers <strong>and</strong> multicropping<br />
system, including use <strong>of</strong> grazing livestocks.<br />
The main problems on rubber in Phuket are: difficulty in obtaining a small financial<br />
contribution from the Rubber Promotion Organization <strong>of</strong> Thail<strong>and</strong>; delays <strong>of</strong> financial assistance,<br />
which is generally released during planting time; <strong>and</strong> rubber diseases.<br />
Rice is the second most important crop in Surat Thani <strong>and</strong> <strong>Phangnga</strong>. In the former, the<br />
largest producing areas are A. Chaiya, A. Tha Chang <strong>and</strong> A. Phun Phin. Production in the two<br />
provinces could not meet domestic dem<strong>and</strong>. Hence, a substantial amount is imported from other<br />
provinces.<br />
In <strong>Phangnga</strong>, farmers still use the traditional farming system <strong>and</strong> low-yielding rice<br />
varieties. Moreover, l<strong>and</strong>holding size per family is small. There is a need to beef up production<br />
through use <strong>of</strong> modern methods, especially high-yielding hybrids.<br />
Although the coconut is an important product for the Upper South, the steady drop in<br />
world market price has caused considerable setback to the industy. The government has been<br />
encouraging planters to raise other fruit trees <strong>and</strong> make use <strong>of</strong> high-yielding coconut hybrids.<br />
In King A. Khura Buri, <strong>Phangnga</strong>, the cashew nut is cultivated on 3,040 ha with an<br />
annual production <strong>of</strong> about 52,600 t. The government has plans to promote <strong>and</strong> make a<br />
demonstration field for farmers. Research on the cashew nut is also being made. The long-term<br />
trend in developing King A. Khura Buri is to cultivate more suitable <strong>and</strong> pr<strong>of</strong>itable plants instead<br />
<strong>of</strong> coconut to match more closely existing prices <strong>and</strong> markets. For the short-term, efforts are<br />
being made to improve the yield per hectare.<br />
In Surat Thani, oil palm is next in importance to coconut. The former's yield is about<br />
221,310 t. It is cultivated in A. Phrasaeng, A. Khiri Ratthanikhorn, A. Wiang Sa, A. Phun Phin<br />
<strong>and</strong> some parts <strong>of</strong> A. Kanchanadit. This industry is facing price reductions <strong>and</strong> thus, needs<br />
government assistance.<br />
Livestock<br />
Livestock also plays an important role in productiori in Phuket. Raised are cattle, buffalo,<br />
pigs, ducks <strong>and</strong> chickens. Cattle could not meet the dem<strong>and</strong> level <strong>of</strong> the market <strong>and</strong> must be<br />
imported from Krabi, Prachuap Kirikhan <strong>and</strong> Ranong. The major problem in developing livestock<br />
production is the lack <strong>of</strong> available grazing l<strong>and</strong>.<br />
Pigs are more popular than cattle <strong>and</strong> buffalo, but the market dem<strong>and</strong> is greater than<br />
supply. The problems with pig production are the high price <strong>of</strong> pig feed <strong>and</strong> conflicts with tourism<br />
promotion. Chickens are more popular than ducks, <strong>and</strong> production is enough to meet consumer<br />
needs in the province.<br />
Industry<br />
Food production industries like canning <strong>and</strong> rice milling; lumber milling; rubber making;<br />
construction materials; tin smelting; <strong>and</strong> transport facilities are the most common in the Upper<br />
South. In 1980, about 1,520 industrial establishments were registered in the region. In 1984,<br />
<strong>Phangnga</strong> had a total <strong>of</strong> 76 factories 23 <strong>of</strong> which were in A. Muang. There were 30 mills <strong>and</strong> 9<br />
welding factories.<br />
In Phuket, there are 268 factories, 256 <strong>of</strong> which are small scale. Tin, rubber <strong>and</strong> seafood<br />
factories are the large ones, <strong>and</strong> most <strong>of</strong> these are in A. Muang.
Roughly 80°h <strong>of</strong> the industrial products are absorbed in the South while 11% are sent to<br />
<strong>Ban</strong>gkok. Clearly, the Upper South is the center <strong>of</strong> industry <strong>of</strong> Southern Thail<strong>and</strong>.<br />
Trading <strong>and</strong> Servlce<br />
The Sixth Economic <strong>and</strong> Social Development Plan (1 987-1 991) which promotes Phuket<br />
as a tourist city will have positive impact on the trading <strong>and</strong> services sector. As a result <strong>of</strong> the<br />
plan, the necessary infrastructure has been built <strong>and</strong> has altered Phuket's economy. In 1984, for<br />
instance, the per capita income <strong>of</strong> Phuket (9,500 baht) was higher than that <strong>of</strong> Southern Region<br />
(5,324 baht) <strong>and</strong> <strong>of</strong> the country (7,181 baht) (Table 5.2).<br />
Table 5.2. Average incorno pcr person in <strong>Phangnga</strong>. Phuket <strong>and</strong> Surat Thani<br />
comparod with the Southern Region <strong>and</strong> the countly, 1484.<br />
Level am66 PmvSnciag;Product Per cspita income<br />
(millions <strong>of</strong> bht) (baht)<br />
, .- .,,, , ,,, , - .- ,,," , ,., -<br />
<strong>Phangnga</strong> 2,026.8 10.288<br />
Phuket 1,415.5 9,500<br />
Surat Thani 3,633.3 5,358<br />
Southorn Region 34,528.2 5,324<br />
Thail<strong>and</strong> 364,206.7 7,181<br />
Source: Statistics from tho National Income Account, Office <strong>of</strong> the National<br />
Economic <strong>and</strong> Social Development Board, Thail<strong>and</strong>.<br />
Mlnlng <strong>and</strong> Ports<br />
The Upper South is the largest tin mining area in Thail<strong>and</strong>, providing the highest foreign<br />
exhange earning. In 1983,59% <strong>of</strong> the total production <strong>of</strong> tin concentrates came from the Upper<br />
South <strong>and</strong> about 15% <strong>of</strong> these were mined from <strong>Phangnga</strong> <strong>and</strong> Phuket. Aside from tin, rare-<br />
earth minerals like tantalite, zircon, xenotime, columbite <strong>and</strong> monazite are also mined (Table<br />
1.2). In terms <strong>of</strong> gross product for the Upper South in 1984 (at 1972 fixed price), mining <strong>and</strong><br />
quarrying contributed 65% valued at 843.4 million baht or about 16% <strong>of</strong> the GNP.<br />
Commercial tin mining started in Phuket. It has both <strong>of</strong>fshore <strong>and</strong> inl<strong>and</strong> mining as well<br />
as the first <strong>and</strong> largest tin smelter in the country. Table 5.3 shows the tin production <strong>of</strong> Phuket<br />
Table 5.3. Value <strong>of</strong> mineral products in Phuket as compared with the Southern Region <strong>and</strong> Thail<strong>and</strong>. 1977.<br />
1980.<br />
Value (millions <strong>of</strong> baht)<br />
1977 1978 1979 1980<br />
Phukat 172.20 148.40 159.20 239.70<br />
Southern Region 1.559.00 1,804.00 1,802.00 1,904.00<br />
Thail<strong>and</strong> 3.526.00 3.104.00 4,104.00 4,780.00<br />
-" ., --- .-<br />
Source: Statistics from the National Accounts Division. Office <strong>of</strong> the National Economic <strong>and</strong> Social Development<br />
Board. Thail<strong>and</strong>.<br />
valued at 239.7 million baht in 1980. That year could be regarded as the best time yet for the<br />
country's mining industry, being influenced by the worldwide economic boom, with tin prices<br />
attaining the highest level in history (TDRI 1987). Problems confronting the mining industry,<br />
especially tin, are the lack <strong>of</strong> water for production, lower market prices, illegal mining <strong>and</strong> conflict<br />
with other economic sectors, specifically tourism because <strong>of</strong> pollution through mine tailings.<br />
Phuket has ports <strong>and</strong> sea transportation network mostly for fishing <strong>and</strong> industrial<br />
purposes. The ports are able to meet current needs <strong>and</strong> can accommodate ships <strong>of</strong> 80-1 00<br />
gross tons (GT). A harbor to ferry tourists/domestic passengers remains to be established,<br />
however.
Chapter 6<br />
Population<br />
WINAI WEERAWATANANON, GEORGE A. A~IG<br />
AND SHUTIMA OUNOCK<br />
Surat Thani Province covers approximately 12,890 km2 <strong>and</strong> has 16 districts (amphoe), 2<br />
subdistricts (sub-amphoe), 121 tambons <strong>and</strong> 835 villages. In 1985, the province had a<br />
population <strong>of</strong> about 677,602: 337,414 men; 340,l 88 women (NSO 1984). The population is the<br />
third largest in the southern area, following Nakhon Si Thammarat <strong>and</strong> Songkhla. Statistics<br />
indicate that the population continues to increase. Infrastructure needs <strong>of</strong> Surat Thani is<br />
expected to grow leading to an increase in the number <strong>of</strong> related social services.<br />
<strong>Phangnga</strong>, on the other h<strong>and</strong>, ranks ninth in terms <strong>of</strong> area in the Southern Region. The<br />
former is divided into 7 districts, a subdistrict <strong>and</strong> 281 villages. The population was 195,360 in<br />
1985: 99,766 men <strong>and</strong> 95,594 women.<br />
Phuket, having an area <strong>of</strong> 538.72 km2, is the biggest isl<strong>and</strong> in Thail<strong>and</strong>. The widest part<br />
<strong>of</strong> the isl<strong>and</strong> is about 21.3 km <strong>and</strong> the longest, 48.7 km. It is divided into 3 districts, 17 sub-<br />
districts <strong>and</strong> 100 villages. In 1985, its population was 147,473: 73,146 men <strong>and</strong> 74,327 women.<br />
In 1980, the combined population <strong>of</strong> <strong>Phangnga</strong> <strong>and</strong> Phuket (1 74,973 <strong>and</strong> 133,669,<br />
respectively) represented 5.30% <strong>and</strong> 0.65% <strong>of</strong> the total population in the Southern Region <strong>and</strong><br />
in the country, respectively. In 1985, the population constituted 5.32% <strong>of</strong> the total population in<br />
the Southern Region, <strong>and</strong> 0.66% in the country.<br />
Population change<br />
Demography<br />
Although Surat Thani's population size has continued to grow over the past 10 years, its<br />
rate <strong>of</strong> change has slowed from a peak in 1983 to its current level <strong>of</strong> 2.25% per year (Table 6.1).<br />
Table 6.1. Population change <strong>of</strong> Surat Thani. 1979-1985.<br />
Year No. <strong>of</strong> ppulacicm Increw Growth rate (%)<br />
Source: Statistics from the National Statistical Office. Office <strong>of</strong> the<br />
Prime Minister, Thail<strong>and</strong>.
In 1980, <strong>Phangnga</strong> had 174,973 people, but in 1985, there were 195,360. The annual<br />
population rate increase was 2.1 0-2.40% or an average value <strong>of</strong> 2.22%. In Phuket, the former<br />
was between 1.54-2.37% or an average <strong>of</strong> 1.97%.<br />
Age <strong>and</strong> sex<br />
The largest age group is the 0-9 years old group for Surat Thani while that for the entire<br />
country is 10-1 9 years. The province's male: female ratio differs only slightly from the norm <strong>of</strong><br />
1 :I, with women outnumbering men.<br />
In <strong>Phangnga</strong>, the 0-9 years (26%) is the largest age group. In Phuket, the largest is the<br />
10-1 9 years (24%) <strong>and</strong> the smallest is the above 70 years (2%) group. For <strong>Phangnga</strong> <strong>and</strong><br />
Phuket combined, the 10-1 9 years (24.5%) is the largest. The age structure follows closely that<br />
for the entire country. <strong>Phangnga</strong> <strong>and</strong> Phuket both have male: female ratios <strong>of</strong> 1 :I.<br />
Migration<br />
In Surat Thani,the most mobile group was the 5-14 years age group while the least<br />
mobile was the over 60 years age group (Table 6.2). The mobility <strong>of</strong> the former group is mainly<br />
attributed to the migration <strong>of</strong> families from various areas to Surat Thani.<br />
Table 6.2. Percentage <strong>of</strong> migrating people to Surat Thani, 1980.<br />
Place <strong>of</strong> origln Total Percentage Age group<br />
5-1 4 15-24 25-39 40-59 60+<br />
Above 5 years 512,178 100.0 165,123 119,205 99,707 90,025 38,115<br />
Migrating people aged<br />
above 5 years: 40,807 7.97 8,557 14,806 12,094 4,143 1,207<br />
Within the province 19.570 3.82 4,247 6,748 5,813 2,008 754<br />
From other provinces 19,280 3.76 3.882 7,242 5,763 1,996 397<br />
Inside municipal limits 5,194 1.01 980 1,665 1,867 606 76<br />
Outside municipal limits 18,316 2.40 2,313 4,928 3,539 1,270 266<br />
Unknown 1,770 0.35 589 649 357 120 55<br />
Central Region 1,934 0.38 31 8 555 859 182 20<br />
East 449 0.09 69 176 166 38<br />
West 1,685 0.33 366 591 505 193 30<br />
Northeast 971 0.19 97 478 328 51 17<br />
North 529 0.1 0 110 231 140 38 10<br />
South 11,257 2.21 2,265 4,300 3,167 1,329 236<br />
Unknown region 2,419 0.47 656 925 606 161 7 1<br />
Abroad 17 0 2 8 7<br />
Unknown country 1,940 0.38 428 81 4 51 0 132 56<br />
Source: NSO (1984).<br />
With regard to the national migration <strong>of</strong> people above 5 years <strong>of</strong> age, migration levels<br />
were the highest for the Central Region as a whole <strong>and</strong> lowest for the South. These data<br />
indicate that if development efforts are to be stressed not only in the Southern Region but also<br />
in the other regions, strategies must be formulated to change the existing national migration<br />
patterns, particularly with regard to the perceived occupational opportunities characteristic <strong>of</strong><br />
each region. From the 1980 Population Census <strong>and</strong> Housing results, the most popular reasons<br />
for migrating to the Southern Region <strong>and</strong> within it were due to the foliowing <strong>of</strong> relatives <strong>and</strong> the<br />
securing <strong>of</strong> a job. Other reasons included changing status, job transfer, further education <strong>and</strong><br />
returning home.
Most migrants in Surat Thani <strong>and</strong> in Thail<strong>and</strong>, in general, were men in search <strong>of</strong> work<br />
either on a permanent or a seasonal basis (Table 6.2). Furthermore, the rate <strong>of</strong> national<br />
migration continued to increase only slightly over the ten-year period with a noticeable decline<br />
within the past three years (1 983-1 985).<br />
About 44,400 in the age group <strong>of</strong> 5-14 years were immigrants to <strong>Phangnga</strong> from other<br />
provinces. In Phuket, 16,486 immigrants were between 10-1 4 years old. There were 10,896 who<br />
moved to Phuket within the past five years: 5,647 in the municipal limits <strong>and</strong> 5,249 outside the<br />
city. Men migrated more <strong>of</strong>ten than women, which was also true for the country.<br />
Birth <strong>and</strong> death rates<br />
In Surat Thani, the birth rate exceeded the death rate from 1980 to 1983. When<br />
population size is considered, this indicates that natural population increase has actually been<br />
reduced over this period. In 1984, the Southern Region had a birth rate equal to 135,348 <strong>and</strong> a<br />
death rate equal to 25,892. If these would be compared with the country's rates, the birth rate<br />
was equal to 926, 279 (1 984) or 14.61%, which was also the birth rate in the Southern Region<br />
<strong>and</strong> in Thail<strong>and</strong>.<br />
The birth rate in 1983 was higher than the death rate in <strong>Phangnga</strong> (24.21 :4.54) <strong>and</strong> in<br />
Phuket (22.19:5.96). In 1984, the Southern Region had 1,926,279 births <strong>and</strong> 25,892 deaths.<br />
Compared with the country's rates, the birth rate was 14.61 % <strong>and</strong> the death rate was 10.8%. In<br />
1985, the birth <strong>and</strong> death rates <strong>of</strong> Thail<strong>and</strong> were 926,279 <strong>and</strong> 237,700, respectively.<br />
Fertility<br />
From the 1980 reports <strong>of</strong> the Population Census <strong>and</strong> National Housing Authority in<br />
Thail<strong>and</strong>, Surat Thani families, on the average, had four children. Women who lived outside the<br />
municipal limits generally had more children than those who lived inside. About 31% <strong>of</strong> young<br />
couples in Surat Thani practiced birth control which contributed to a fertility rate lower than the<br />
national average <strong>of</strong> 4.16%.<br />
In <strong>Phangnga</strong>, it was anticipated that women would have an average <strong>of</strong> three to four<br />
children in 1986. This average was lower than those in the South <strong>and</strong> in the country.<br />
The average age for the first married women in <strong>Phangnga</strong> was 22 years. Women who<br />
lived in municipal areas married later than those who lived outside the municipal limits. About<br />
40% <strong>of</strong> the young couples practiced birth control, compared to 25.45% in the South <strong>and</strong> 41.1 6%<br />
in the country.<br />
Density<br />
The area with the highest population density was within the municipal limits <strong>of</strong> Surat<br />
Thani, the development center <strong>of</strong> the province (Table 6.3).<br />
Density comparison <strong>of</strong> Surat Thani with the Southern Region <strong>and</strong> Thail<strong>and</strong> shows that<br />
the density <strong>of</strong> Surat Thani appears to be increasing. The percentages <strong>of</strong> increasing population in<br />
Surat Thani were: 0.93% in 1980 <strong>and</strong> 1.68% in 1984. In 1985, the rate decreased to 1 .I 7%.<br />
In <strong>Phangnga</strong> in 1980, the municipal limits <strong>of</strong> A. Takua Pa had the highest population<br />
density, 3,194.37 persons/km2, which decreased to 3,053.64Ikm2 in 1984. This was followed by<br />
the municipal limits <strong>of</strong> Amphoe (1,131 .85/kmZ in 1980 <strong>and</strong> 1,302.37 in 1984) <strong>and</strong> A. Thap Put<br />
(85.15 km2 in 1980 <strong>and</strong> 91.30 km2 in 1984) (Table 6.4).
Table 6.3. Population density in Surat Thani, 1980-1984.<br />
Total<br />
Amphoe<br />
lnside municipal limits<br />
Outside municipal limits<br />
<strong>Ban</strong> Na San<br />
lnside municipal limits<br />
Outside municipal limits<br />
<strong>Ban</strong> Na Doem (sub-amphoe)<br />
<strong>Ban</strong> Tasu k<br />
Chaiya<br />
<strong>Don</strong> Sak<br />
Kanchanadit<br />
Khian Sa<br />
Khiri Ratthanikhom<br />
KO Phangan<br />
KO Samui<br />
Phanom<br />
Phrasaeng<br />
Khura Buri (sub-amphoe)<br />
Phun Phin<br />
Tha Chana<br />
Tha Chang<br />
Wiang Sa<br />
Source: Statistics from the National Statistical Office. Office <strong>of</strong> the Prime Minister.<br />
Table 6.4. Population density in <strong>Phangnga</strong>. 198C1984.<br />
Arnphoe Area (krn2) Densitylkm2<br />
1980 1981 1982 1983 1984<br />
Total 4,099.76 42.68 43.67 44.60 45.54 46.63<br />
Amphoe 558.15 49.63 50.52 51 -23 53.10 52.37<br />
Inside municipal limits 6.75 1,131 -85 1,156.59 1,176.15 1,272.89 1,302.37<br />
Outside municipal limits 551.40 36.40 36.98 37.46 38.17 38.88<br />
KO Yao (sub-amphoe) 137.64 67.02 68.35 70.07 71.67 72.96<br />
Kapong 552.22 19.00 19.08 19.16 19.34 19.59<br />
Khura Buri 932.30 15.26 15.99 16.57 16.70 17.66<br />
Takua Pa 475.49 72.08 74.30 76.23 75.99 77.60<br />
Inside municipal limits 3.02 3,194.37 3,168.87 3,139.12 3,037.75 3,053.64<br />
Outside municipal limits 472.47 52.12 54.52 56.66 57.06 58.57<br />
Takua Thung 620.33 49.74 50.61 51.56 52.29 53.16<br />
Thai Muang 621 -36 49.83 51.11 52.36 55.13 56.78<br />
Thap Put 202.27 85.15 86.45 88.03 89.60 91.30<br />
Source: Statistics from the National Statistical Office. Office <strong>of</strong> the Prime Minister
Table 6.5. Population density in Phuket, 1980-1984.<br />
Densitykrn2<br />
Amphoe Area (km2) 1980 1981 1982 1983 1984<br />
Total 538.12 248.12 252.98 257.41 263.63 259.58<br />
Phuket City 224.00 352.41 359.81 365.50 374.51 384.23<br />
Inside limits 12.00 3,762.92 3,725.08 3,789.42 3,826.42 3,888.25<br />
Outside limits 212.00 159.36 165.92 171 -69 179.12 185.89<br />
Khatu 62.72 204.70 212.13 219.71 224.09 225.78<br />
Thalang 252.00 166.23 168.23 170.71 174.27 178.58<br />
-<br />
Source: Statistics from the National Statistical Office, Office <strong>of</strong> the Prime Minister.<br />
In Phuket, the densest area in 1980-1 984 was within the municipal limits <strong>of</strong> the city. In<br />
1980, it was 3,762.92 km2, <strong>and</strong> 3,888.251km2 in 1984 (Table 6.5).<br />
Language<br />
Culture<br />
The Southern Thai language is spoken in both <strong>of</strong> the study areas. The Central Thai or<br />
National language is also spoken in schools, other regions <strong>and</strong> some government <strong>of</strong>fices,<br />
especially at the provincial level. Local variations <strong>of</strong>ten by village or district <strong>and</strong> alternative<br />
languages in religious contexts, such as Pali (Buddhism) or Islamic, are also spoken.<br />
Religion<br />
In the Southern Region, in general, the percentages <strong>of</strong> religions practiced were:<br />
Buddhism (75%); Islam (24%); <strong>and</strong> Christianity, Hinduism or others (1%).<br />
In Surat Thani, the population was 96% Buddhist; 2% Islamic; <strong>and</strong> 2%, <strong>of</strong> other religions<br />
(Surat Thani Statistical Report 1986).<br />
In <strong>Phangnga</strong> <strong>and</strong> Phuket, 80% <strong>of</strong> the population was Buddhist; 19%, Islamic; <strong>and</strong> 1% <strong>of</strong><br />
other religions (Prateung 1976).<br />
Family structure<br />
The Southern Thai family structure is not unlike that <strong>of</strong> the northern <strong>and</strong> central areas <strong>of</strong><br />
Thail<strong>and</strong>, although some differences exist. The family, on an overall basis, can be classified into<br />
stem (i.e., only one married child lives with the parents <strong>and</strong> thus, no two sons-in-law may live in<br />
the same household) or nuclear (i.e., two-generation family, parents <strong>and</strong> children).<br />
Literacy <strong>and</strong> education<br />
In Surat Thani, out <strong>of</strong> the population aged 10 years <strong>and</strong> over, approximately 90% was<br />
literate. Literacy rate for men (95%) was higher than for women (87%). The percentage <strong>of</strong><br />
literate persons in the municipal area <strong>of</strong> Surat Thani was higher than that in the nonmunicipal
area. Patterns associated with urban-rural <strong>and</strong> sex differences in school attendance <strong>of</strong> the<br />
population aged 6-29 years were similar to those <strong>of</strong> literate persons aged 10 years <strong>and</strong> over.<br />
School attendance for men both in the municipal area (50%) <strong>and</strong> the nonmunicipal area (45%)<br />
was higher than for women (municipal, 46%; nonmunicipal, 42%).<br />
The percentage <strong>of</strong> men <strong>and</strong> women who attained a level beyond elementary in the<br />
municipal area (29%) was twice more than in the nonmunicipal area (1 1%) <strong>of</strong> Surat Thani. Men<br />
attained a higher level <strong>of</strong> education (total <strong>of</strong> 15%) in the municipal (33%) <strong>and</strong> in the non-<br />
municipal (13%) areas compared to women (total, 11 %; municipal, 25% <strong>and</strong> nonmunicipal, 9%).<br />
To sum up, the importance <strong>of</strong> literacy, school attendance <strong>and</strong> advanced education in<br />
Surat Thani was more stressed for men than for women. Also, Surat Thani's literacy rates were<br />
higher than the Southern Region's (84%) <strong>and</strong> Thail<strong>and</strong>'s (89%) (NSO 1984; 1980c; 1980d).<br />
<strong>Phangnga</strong>'s literacy rate was 91%. Of this total, the literacy rate for men was 94% <strong>and</strong><br />
for women, 88%. Patterns <strong>of</strong> literacy, school attendance <strong>and</strong> levels <strong>of</strong> advanced education were<br />
all higher in the municipal than in the nonmunicipal areas. Furthermore, only in school<br />
attendance <strong>of</strong> the population aged 6-29 did women represent a higher percentage than men<br />
(44% <strong>and</strong> 42%, respectively).<br />
Men had higher percentages in school attendance in the nonmunicipal area <strong>and</strong> in the<br />
attainment <strong>of</strong> a level <strong>of</strong> education beyond eiementary. The percentage which obtained an<br />
advanced education in the municipal area was almost three times than that in the nonmunicipal<br />
area <strong>of</strong> <strong>Phangnga</strong>, a greater difference than that noted for Surat Thani (NSO 1980a).<br />
Phuket's literacy rate was about 91%, with men (95%) having a higher rate than women<br />
(88%). The patterns with regard to urban-rural <strong>and</strong> sex differences along the lines <strong>of</strong> literacy,<br />
school attendance <strong>and</strong> attainment <strong>of</strong> a higher level <strong>of</strong> education matched those for <strong>Phangnga</strong>.<br />
However, in almost every category, the Phuket percentages were the highest <strong>of</strong> all three<br />
provinces, while Surat Thani's <strong>and</strong> <strong>Phangnga</strong>'s were roughly equivalent on a broad basis. Only<br />
in school attendance in nonmunicipal areas did Surat Thani exhibit higher percentages, between<br />
the ages <strong>of</strong> 6-29 years old (NSO 1980b).<br />
Phuket's literacy rates were higher than those in the Southern Region (84%) <strong>and</strong> in<br />
Thail<strong>and</strong> (89%). The same rates by sex were also higher compared to the Southern Region<br />
(men: 89%; women: 80%) <strong>and</strong> the country (92% <strong>and</strong> 85%, respectively). <strong>Phangnga</strong>, however,<br />
had the lowest percentages <strong>of</strong> school attendance in the Southern Region, while the highest<br />
percentage <strong>of</strong> higher educational level attainment was attributed to Phuket. Patterns associated<br />
with rural-urban <strong>and</strong> sex differences were comparable to those <strong>of</strong> the Southern Region <strong>and</strong> the<br />
country (NSO 1980c; 1980d).<br />
Quality <strong>of</strong> living quarters, tenure <strong>and</strong> ownershlp<br />
The st<strong>and</strong>ard <strong>of</strong> living in Surat Thani Province is moderate when measured by the use <strong>of</strong><br />
permanent building materials, i.e., wood <strong>and</strong> cement: municipal area, 93%; nonmunicipal, 76%;<br />
<strong>and</strong> total, 77%. Owners occupying living quarters <strong>and</strong> associated l<strong>and</strong> plots were roughly<br />
equivalent in terms <strong>of</strong> the total, 85.1 5% <strong>and</strong> 85.52%, respectively. Both were higher in the<br />
nonmunicipal than in the municipal areas.<br />
Households using piped water with regard to the total households in Surat Thani, the<br />
municipal <strong>and</strong> the nonrnunicipal areas (in this province) represented 13%, 63% <strong>and</strong> 8%,<br />
respectively. More municipal households (86%) also enjoyed electricity than nonmunicipal ones<br />
(1 9%). However, households that used either gas or charcoal for cooking were 84% in both<br />
municipal <strong>and</strong> nonmunicipal areas. In other provinces, such as <strong>Phangnga</strong>, gas substitution was<br />
possible to reduce the amount <strong>of</strong> mangrove wood for cooking. The systems <strong>of</strong> providing gas to<br />
rural customers should thus be examined in Surat Thani. Also, about 85% <strong>and</strong> 28%
espectively, <strong>of</strong> the households in the municipal <strong>and</strong> nonmunicipal areas utilized sanitary latrine<br />
facilities.<br />
Nonmunicipal (96%) <strong>and</strong> municipal households (88%) owned radio sets. Televisions<br />
were owned by more municipal (52%) than nonmunicipal (9%) households. Other equipment<br />
used mainly by the former households were electric fans, bicycles <strong>and</strong> motorcycles.<br />
Compared with the other provinces in the Southern Region, the st<strong>and</strong>ard <strong>of</strong> living in<br />
Phuket was relatively satisfactory based on the high percentage (82%) <strong>of</strong> living quarters<br />
constructed <strong>of</strong> permanent materials. This percentage was higher, however, in the municipal<br />
(90%) than in the nonmunicipal area (76%).<br />
The municipal households (96% used electric lighting more than the nonmunicipal ones<br />
(55%). Gas or charcoal was used for cooking in 71% <strong>of</strong> the former <strong>and</strong> 30% in the latter. Flush<br />
toilets <strong>and</strong> molded bucket latrines as sanitary toilet facilities were used by 90% <strong>of</strong> the municipal<br />
<strong>and</strong> only 57% <strong>of</strong> the nonmunicipal households.<br />
Regarding ownership <strong>of</strong> municipal <strong>and</strong> nonmunicipal households, respectively, <strong>of</strong> certain<br />
equipment, here were some figures: radio sets, 90% <strong>and</strong> 93%; motorcycles, 73% <strong>and</strong> 62%;<br />
electric fans <strong>and</strong> bicycles, 53% <strong>and</strong> 43%; <strong>and</strong> television sets, 54% <strong>and</strong> 15% (NSO 1980b).<br />
In <strong>Phangnga</strong> Province, 61% <strong>of</strong> the living quarters were <strong>of</strong> permanent materials, placing<br />
this province in only a relatively moderate position than the other Southern provinces. Again,<br />
these were used more <strong>of</strong>ten in municipal than in nonmunicipal areas. The proportion <strong>of</strong> living<br />
quarters <strong>and</strong> <strong>of</strong> l<strong>and</strong> on which the former were situated <strong>and</strong> occupied by owners were 80% in<br />
municipal <strong>and</strong> 89% in nonmunicipal areas.<br />
Households using piped water were 7.40% 37% <strong>and</strong> 4% <strong>of</strong> the total households in<br />
<strong>Phangnga</strong>, municipal area <strong>and</strong> nonmunicipal area, respectively. These figures represent the<br />
lowest percentages <strong>of</strong> all the three provinces in terms <strong>of</strong> water supply systems, indirectly<br />
pointing to a necessity for an expansion <strong>of</strong> the systems in the rural area. Percentages <strong>of</strong><br />
households utilizing electricity also showed large urban-rural differences with municipal<br />
households (94%) far outreaching nonmunicipal (26%). About 86% <strong>and</strong> 40% <strong>of</strong> municipal <strong>and</strong><br />
nonmunicipal households, respectively, used sanitary types <strong>of</strong> latrines.<br />
Ownership percentages <strong>of</strong> household equipment in municipal <strong>and</strong> nonmunicipal areas<br />
were, respectively: radio sets, 92% <strong>and</strong> 96%; motorcycles, 60% <strong>and</strong> 44%; bicycles, 60% <strong>and</strong><br />
44%; <strong>and</strong> electric fans, 77% <strong>and</strong> 18%. Television sets were not in the analysis (NSO 1980a).<br />
The South<br />
Employment<br />
Labor. The proportion <strong>of</strong> labor in the South (which has 3,292,361 laborers) to the country<br />
is 5.1 2%. The labor force in <strong>Phangnga</strong> is 53.52% <strong>of</strong> the population in this province.<br />
In the South, there is a large number <strong>of</strong> persons with high educational attainment but are<br />
unemployed, <strong>and</strong> this number tends to increase every year. In 1974, there were 19,920 unem-<br />
ployed. In 1981, there were 59,300.<br />
Agriculturists account for 57.6% <strong>of</strong> the South's labor force. Rice <strong>and</strong> rubber trees are the<br />
main crops. Labor associated with rubber production is unstable. Rice production is also<br />
tenuous due to adverse weather conditions. Labor requirements are about 150 dayslyear for<br />
rice <strong>and</strong> for rubber.<br />
Labor in the South changes both within the region <strong>and</strong> the provinces. It is rare in<br />
<strong>Ban</strong>gkok to find a laborer from the South. From the 1984 figures <strong>of</strong> the Department <strong>of</strong> Labor<br />
(DOL 1985), only 197 persons from the South moved to <strong>Ban</strong>gkok, but 3,867 came from the
East; 1,326 from the North; <strong>and</strong> 626 from the Central Region. People in the South must have<br />
two jobs due to seasonality <strong>of</strong> agricultural activity. When they finish growing rice or rubber trees,<br />
they have to find part-time jobs to support their families.<br />
Agriculture. The wages <strong>of</strong> persons skilled in slitting or tapping rubber trees is very high<br />
(1 40 bahtlday). Although they do not own l<strong>and</strong>, they still can support their families. Other jobs<br />
which do not require special skill pay only 40 bahtlday. People who migrate to other places to<br />
harvest rice or cut sugarcane receive about 80-120 bahtlday.<br />
The population in <strong>Phangnga</strong> doing domestic work is 85.23%; in cutting rubber trees,<br />
7.38%; <strong>and</strong> in cutting these trees for others, 7.38% (TISTR n.d.).<br />
Minerals. Since 1979, the number <strong>of</strong> laborers in mining declined because <strong>of</strong> the low cost<br />
<strong>of</strong> minerals in the world market <strong>and</strong> the lower wages compared to other jobs (Table 6.6).<br />
Table 6.6. Number <strong>of</strong> mineral workers in Surat Thani. <strong>Phangnga</strong> <strong>and</strong> Phuket, 1979-1982.<br />
Surat Thani 1,804 1,521 1,263 1,136<br />
<strong>Phangnga</strong> 49,543 46,445 26,424 26,015<br />
Phuket 3.100 2,987 3,008 2,578<br />
Fisheries. In Thail<strong>and</strong>, 23 provinces with about 40,198 families (257,254 persons) were<br />
in fisheries. In 1979, 14,584 million baht were earned, representing 2.6% <strong>of</strong> total production in<br />
the country.<br />
Fisheries families are <strong>of</strong> three groups (DOF 1980): (1) business, which employs more<br />
than three persons; (2) family business, most workers <strong>of</strong> which are from the family <strong>and</strong> only less<br />
than three are outside employees; <strong>and</strong> (3) employed family, which works for others' <strong>and</strong> not their<br />
own business.<br />
The population in Phuket had been increasingly involved in fisheries because the<br />
province has a large wharf. This makes Phuket a center for fishing.<br />
In <strong>Phangnga</strong>, there were roughly 1,300 families engaged in fisheries in the two amphoes<br />
(Office <strong>of</strong> Changwat <strong>Phangnga</strong> 1986).<br />
Others. Other jobs include cutting trees, burning coal, factory tasks, ship repairing <strong>and</strong><br />
others. These jobs <strong>of</strong>ten occurred in provinces with an industrial city, e.g., Chumphon, Phuket,<br />
Surat Thani <strong>and</strong> Songkhla.<br />
Surat Thani<br />
About 63% <strong>of</strong> the population in Surat Thani in 1980 was <strong>of</strong> working age. According to<br />
statistics <strong>of</strong> the Industrial Office in Surat Thani, in 1984, this province had 514 factories which<br />
employed 5,057 persons. Most industries were located in A. Muang which had 174 industries<br />
with 1,732 employees. Next was Phun Phin which had 105 industries <strong>and</strong> 2,000 employees.<br />
Surat Thani is now a leading industrial province in the South <strong>and</strong> can afford to hire<br />
laborers from other areas.<br />
Phuket<br />
In 198Ol34,6l 8 <strong>of</strong> the population were in agriculture. 8.1 8% <strong>of</strong> which were unemployed.<br />
About 41,834 were in the other sectors, 3.44% <strong>of</strong> which were unemployed.
Most occupations were agricultural <strong>and</strong> entailed growing rubber trees <strong>and</strong> coconuts<br />
(40.30%). Other jobs included growing rice <strong>and</strong> working as an employee which were about<br />
18.68% <strong>and</strong> 17.26%, respectively. Even though Phuket had much tourism, the basic<br />
occupations were still working as an agriculturist or working as an employee in trading, fishing or<br />
animal husb<strong>and</strong>ry.<br />
About 3,542 people in Phuket worked in 268 factories with an investment <strong>of</strong> 734.31<br />
million baht. The figures were: machinery <strong>and</strong> transportation employed 982 persons or 27.7%<br />
<strong>and</strong> had 115 factories or 42.9% <strong>of</strong> all-industrial groups; food <strong>and</strong> drink, 719 or 20.3%; rubber,<br />
664 or 18.7%.<br />
Most businessmen would invest in Phuket Amphoe because <strong>of</strong> more facility in finding<br />
labor <strong>and</strong> services here. Income was about 37,303 bahtlfamily/year which was the third highest<br />
rate, exceeding that <strong>of</strong> farming which was only 6,126 bahtlfamilylyear (TISTR 1984).<br />
<strong>Phangnga</strong><br />
In 1985, <strong>Phangnga</strong> had 192,165 working-aged persons. There were 42,624 in agriculture<br />
<strong>and</strong> 26,880 in nonagriculture. About 8,322 worked as employees in 1,035 industries.<br />
Five years ago, about 52% <strong>of</strong> employed people were in agriculture. Percentages <strong>of</strong><br />
people employed in mineral, trading <strong>and</strong> social services were 15.30, 11.47 <strong>and</strong> 9.45,<br />
respectively.<br />
The main occupation near the beaches was also agriculture-related (growing rice,<br />
coconut, rubber, cashew <strong>and</strong> vegetables). Labor was 28.37%.
Chapter 7<br />
Institutional <strong>and</strong> Legal Framework<br />
ARTHORN SUPHAPODOK AND SIRIKUL BUNPAPONG<br />
Introduction<br />
The various resources <strong>and</strong> economic sectors <strong>of</strong> industry <strong>and</strong> tourism in the Upper South<br />
<strong>and</strong> in Thail<strong>and</strong> are under the jurisdiction <strong>of</strong> several government departmentslagencies. There<br />
are three categories <strong>of</strong> key institutions involved in CRM, namely, policy, planning <strong>and</strong><br />
implementation agencies. ONEB, for example, is a policy <strong>and</strong> planning agency that acts as a<br />
coordinating body on matters <strong>of</strong> environmental quality. ONEB is m<strong>and</strong>ated to submit policies<br />
<strong>and</strong> measures on all aspects <strong>of</strong> environmental management to the Council <strong>of</strong> Ministers. These<br />
policies <strong>and</strong> measures, if approved, will be adopted by other agencies.<br />
Among the planning <strong>and</strong> implementation agencies, the Royal Forestry Department<br />
(RFD) has jurisdiction over all the forest resources <strong>and</strong> the mangroves, coral reefs <strong>and</strong> isl<strong>and</strong>s<br />
which are designated as national parks <strong>of</strong> the country. This department grants <strong>of</strong>ficial logging<br />
concessions to private firms <strong>and</strong> manages all national parks.<br />
DOF, on the other h<strong>and</strong>, is responsible for formulating policies <strong>and</strong> plans for the develop-<br />
ment <strong>and</strong> management <strong>of</strong> fisheries; enforcing regulations on fishing; providing licenses to<br />
operate fishing boats; <strong>and</strong> controlling aquaculture activities, including the granting <strong>of</strong> permits to<br />
build aquaculture farms.<br />
The development, planning <strong>and</strong> implementation <strong>of</strong> tourism is under the jurisdiction <strong>of</strong><br />
TAT. These activities include promotions; setting up <strong>of</strong> guidelines for the improvement <strong>of</strong><br />
infrastructure <strong>and</strong> facilities for the tourism industry; <strong>and</strong> monitoring the impacts <strong>of</strong> the industry. A<br />
master plan for integrated tourism development has been prepared by TAT, but inadequate<br />
legislation <strong>and</strong> cooperation among agencies responsible have prevented full implementation <strong>of</strong><br />
the plan.<br />
The Department <strong>of</strong> Mineral Resources (DOMR) is responsible for giving mining<br />
concessions to firms <strong>and</strong> managing <strong>and</strong> controlling mineral resources utilization <strong>of</strong> the country.<br />
A number <strong>of</strong> the above agencies sometimes have overlapping <strong>and</strong> conflicting<br />
responsibilities <strong>and</strong> interests on CRM. An example is the conflict between tourism <strong>and</strong> <strong>of</strong>fshore<br />
mining in the west coast <strong>of</strong> Phuket.<br />
In an effort to formulate acceptable management policies <strong>and</strong> strategies among agencies<br />
responsible for CRM, several national committees were established. The committees set up<br />
under legislation or law include the: Committee on L<strong>and</strong> Development, Central Sub-committee<br />
for Coastal Development <strong>and</strong> National Committee for Mangrove Resources. However, these<br />
committees have limited authority to control the utilization <strong>of</strong> coastal resources under their own<br />
jurisdiction, including plan implementation (Table 7.1).
Table 7.1. List <strong>of</strong> institutions <strong>and</strong> agencies responsible for various coastal resources in Thail<strong>and</strong>.<br />
Ecosystem Mangrove Coral reef Beach Estuary Mudflat Isl<strong>and</strong> Fisheries<br />
Major institutions<br />
<strong>and</strong>agencies A'.B~ cC D~ A B C D A 0 C A B C D A B C D A B C A B C D<br />
Office <strong>of</strong> the<br />
National Environ-<br />
ment Board X X X X X X X X<br />
L<strong>and</strong> Develop-<br />
ment Department X<br />
Depanment <strong>of</strong><br />
Forestry X X X<br />
Department <strong>of</strong><br />
Fisheries<br />
Department <strong>of</strong><br />
Agricultural<br />
Extension<br />
Department <strong>of</strong><br />
Mineral Re-<br />
sources<br />
Department <strong>of</strong><br />
Harbour<br />
Department <strong>of</strong><br />
Town <strong>and</strong><br />
Country Planning<br />
Tourism Author-<br />
ity <strong>of</strong> Thail<strong>and</strong><br />
Office <strong>of</strong> the<br />
National Eco-<br />
nomic <strong>and</strong><br />
Social Devel-<br />
opment Board X<br />
National Re-<br />
search Council<br />
X X X X X X X<br />
a~o~icy.<br />
b~lanning <strong>and</strong> management.<br />
Clmplementation.<br />
d~esearch.<br />
In 1985, a report on coastal development planning <strong>and</strong> management, which includes a<br />
review <strong>of</strong> institutional <strong>and</strong> legal aspects, was prepared by TISTR (Baker <strong>and</strong> Kaeoniam 1985)<br />
with sponsorship by the United Nations Educational, Scientific <strong>and</strong> Cultural Organization<br />
(UNESCO).<br />
Laws <strong>and</strong> Regulatlons<br />
Laws <strong>and</strong> regulations related to coastal resources <strong>and</strong> their development, as shown in<br />
Fig. 7.1, can be classified into four:
* I -<br />
L<strong>and</strong> Development Act, 1983 I<br />
I - I<br />
Control <strong>of</strong> Building Act, 1919<br />
,-Tourism Act, 1979<br />
I<br />
~ d i t <strong>and</strong> y Town Planning Act, 1975- 1<br />
-+nvironrnental Quality Act, 1975 + 1<br />
I*~<strong>and</strong> Reform for Agriculture Act, 1975-<br />
-<br />
1<br />
k Petroleum Act, 1971<br />
1- <strong>and</strong> for Livelihood Act, 1968 el<br />
I<br />
- Mineral Act, 1967<br />
*I<br />
]-National Forest Reserves Act, 1964<br />
-<br />
4<br />
+-. National Park Act, 1961 I<br />
I -W~ld Animals Reservation -1<br />
-<br />
<strong>and</strong> Protection Act, 1960<br />
(----L<strong>and</strong> Code <strong>of</strong> Thail<strong>and</strong>, 1954 I<br />
I<br />
I - - I<br />
I Forest Act, 194 1 I<br />
-<br />
1-~ond Pattern for Agricultural -1<br />
Use Act, 1914<br />
I<br />
Navigation in Thai<br />
I<br />
Territorial Wafers Act, 1913 I I<br />
- -- Fisheries Act, 1947<br />
Sea<br />
I<br />
I<br />
I<br />
I<br />
Shoreline L<strong>and</strong><br />
Terrltorlal water 200miles<br />
1<br />
Hill area<br />
71<br />
Fig. 7.1. Legislative administration <strong>of</strong> rhe coastal area. Source! modified after Baker <strong>and</strong> Kaeoniam 1985.<br />
Nature conservation<br />
This legislation consists <strong>of</strong> the Wild Animals Reservation <strong>and</strong> Protection Act <strong>of</strong> 1960, the<br />
National Park Act <strong>of</strong> 1961 <strong>and</strong> the National Forest Reserves Act <strong>of</strong> 1964. These three cover<br />
l<strong>and</strong> <strong>and</strong> water zones <strong>and</strong> their interface in dedicated areas, e.g., the National Park Act which<br />
includes marine <strong>and</strong> forest parks. Implementation <strong>and</strong> enforcement <strong>of</strong> the Nature Conservation<br />
Acts are under the responsibility <strong>of</strong> RFD.<br />
Natural resources exploitation<br />
This group <strong>of</strong> legislation consists <strong>of</strong> the Forest Act <strong>of</strong> 1941, the Fisheries Act <strong>of</strong> 1947, the<br />
Minerals Act <strong>of</strong> 1967, the Petroleum Act <strong>of</strong> 1971 <strong>and</strong> the Tourism Act <strong>of</strong> 1979. The Forest Act <strong>of</strong><br />
1941 invests full authority on RFD for the protection <strong>and</strong> management <strong>of</strong> all forests in the<br />
country. The Fisheries Act <strong>of</strong> 1947, under the responsibility <strong>of</strong> DOF, is on the control <strong>and</strong><br />
I<br />
I
management <strong>of</strong> fisheries resources. The Minerals Act <strong>of</strong> 1967 invests full authority on DOMR to<br />
manage <strong>and</strong> control national mineral resources utilization, including survey <strong>and</strong> permission for<br />
mining operation <strong>and</strong> sale. The Petroleum Authority <strong>of</strong> Thail<strong>and</strong> (PAT) is responsible for the<br />
Petroleum Act <strong>of</strong> 1971, which covers the exploration <strong>and</strong> production <strong>of</strong> oil <strong>and</strong> gas. The Tourism<br />
Act <strong>of</strong> 1979 invests full authority on TAT to undertake investigation, planning <strong>and</strong> investment <strong>of</strong><br />
facilities for tourism development in the country.<br />
Environmental protection<br />
The Enhancement <strong>and</strong> Conservation <strong>of</strong> National Environmental Quality Act <strong>of</strong> 1975, with<br />
coordinating responsibilities by ONEB, covers the control <strong>of</strong> environmental quality <strong>and</strong><br />
st<strong>and</strong>ards <strong>and</strong> the request <strong>of</strong> environmental impact assessment (EIA) <strong>of</strong> development projects.<br />
L<strong>and</strong> <strong>and</strong> water usage<br />
L<strong>and</strong> legislation in Thail<strong>and</strong> is very complex, covering both l<strong>and</strong> tenure <strong>and</strong> l<strong>and</strong> use<br />
planning. L<strong>and</strong> tenure legislation consists <strong>of</strong> the L<strong>and</strong> Code <strong>of</strong> Thail<strong>and</strong> <strong>of</strong> 1954, some<br />
provisions concerning l<strong>and</strong> property rights under the Civil <strong>and</strong> Commercial Code <strong>of</strong> Thail<strong>and</strong>, the<br />
Allocation <strong>of</strong> L<strong>and</strong> for Livelihood Act <strong>of</strong> 1968 <strong>and</strong> the L<strong>and</strong> Reform for Agriculture Act <strong>of</strong> 1975.<br />
The City <strong>and</strong> Town Planning Act <strong>of</strong> 1975, the Formulation <strong>of</strong> L<strong>and</strong> Pattern for Agricultural Use<br />
Act <strong>of</strong> 191 4 <strong>and</strong> the L<strong>and</strong> Development Act <strong>of</strong> 1983 constitute a legal framework for both urban<br />
<strong>and</strong> rural planning, supplemented by zoning laws embodied in a number <strong>of</strong> legislations, both old<br />
<strong>and</strong> new (such as the Control <strong>of</strong> Building Act <strong>of</strong> 1979).<br />
With regard to water usage, the Navigation in Thai Territorial Waters Act <strong>of</strong> 191 3<br />
(NTTWA) is the key legislation governing both inl<strong>and</strong> <strong>and</strong> sea navigation. As a party to the 1958<br />
Geneva Convention on the Law <strong>of</strong> the Sea <strong>and</strong> a signatory to the 1982 United Nations<br />
Convention on the Law <strong>of</strong> the Sea, Thail<strong>and</strong> has claimed a 12-mile territorial sea plus a 24-mile<br />
contiguous zone measured from the baseline <strong>of</strong> her seacoast since 1966.<br />
In 1969, a unilateral claim to exercise sovereign rights over the natural resources <strong>of</strong> the<br />
seabed <strong>and</strong> subsoil <strong>of</strong> the continental shelves in the <strong>of</strong>fshore areas <strong>of</strong> both the Gulf <strong>of</strong> Thail<strong>and</strong><br />
<strong>and</strong> the Andaman Sea was asserted by the Thai government. Thail<strong>and</strong>'s claim to extend her<br />
EEZ seaward up to 200 miles was made by virtue <strong>of</strong> a royal proclamation dated 23 February<br />
1981. Like the term "seacoast," no legal definition <strong>of</strong> "marine waters" or "sea" can be found in<br />
the NTTWA or elsewhere in other statutory books.<br />
In addition to NTTWA, there are a number <strong>of</strong> other water usage laws, such as the<br />
Preservation <strong>of</strong> Waterways Act <strong>of</strong> 1903, the Public Irrigation Act <strong>of</strong> 1942, the Water Works<br />
Canal Act <strong>of</strong> 1983, etc. These laws are <strong>of</strong> little relevance to the subject <strong>of</strong> coastal zone<br />
management due to their major concern with inl<strong>and</strong> waters rather than coastal marine waters.<br />
Institutions<br />
The great variety <strong>of</strong> resources present in the coastal area results in the participation <strong>of</strong><br />
different implementing agencies which manage them according to the laws. Sectoral<br />
overlapping has caused management problems that need better coordination <strong>and</strong> cooperation<br />
among the agencies concerned. However, it is hoped that the difficulties will be reduced as a<br />
result <strong>of</strong> the coastal resources planning efforts.
Committees <strong>and</strong> subcommittees responsible for policy <strong>and</strong> control <strong>of</strong> operations <strong>of</strong> the<br />
various agencies in the coastal area are:<br />
Commlttee for L<strong>and</strong> Development<br />
This committee was established by the Thail<strong>and</strong> Cabinet under the chairmanship <strong>of</strong> the<br />
Minister <strong>of</strong> Agriculture <strong>and</strong> Cooperatives. The members <strong>of</strong> the committee are the Director<br />
Generals from all departments in the ministry, including the Secretary General <strong>of</strong> the Office <strong>of</strong><br />
the National Economic <strong>and</strong> Social Development Board; the Director General <strong>of</strong> DOLD; <strong>and</strong> the<br />
Director General <strong>of</strong> DOPW. The major roles <strong>and</strong> duties <strong>of</strong> this committee are dealing with l<strong>and</strong><br />
classification <strong>and</strong> establishing measures for l<strong>and</strong> development <strong>and</strong> soil improvement.<br />
Central Subcommittee for Coastal Development<br />
This subcommittee was established by the Committee for L<strong>and</strong> Development under the<br />
chairmanship <strong>of</strong> the Deputy Minister <strong>of</strong> Agriculture <strong>and</strong> Cooperatives. The members are the<br />
representatives from the departments concerned. The duties <strong>of</strong> this subcommittee are approving<br />
the development proposals put up by the Provincial Subcommittee for Coastal L<strong>and</strong><br />
Development <strong>and</strong> the Provincial Subcommittee for L<strong>and</strong> Classification <strong>and</strong> Coastal<br />
Development; cooperating with these subcommittees; <strong>and</strong> performing other tasks assigned by<br />
the Committee for L<strong>and</strong> Development.<br />
Provincial Subcommittee for L<strong>and</strong> Classification<br />
<strong>and</strong> Coastal Development<br />
This subcommittee was established by the Committee for L<strong>and</strong> Development <strong>and</strong> is<br />
found in each <strong>of</strong> the 23 coastal provinces. The subcommittee has authority over l<strong>and</strong><br />
classification, l<strong>and</strong> consolidation <strong>and</strong> reform for agricultural purposes. Its duties are screening<br />
coastal development projects, especially those subject to disputes among governmental<br />
agencies or among the government <strong>and</strong> the private sector; initiating <strong>and</strong> supporting research<br />
work related to coastal development; drafting master plans for coastal l<strong>and</strong> use development <strong>of</strong><br />
the province; <strong>and</strong> coordinating tasks among the different agencies concerned with l<strong>and</strong><br />
classification.<br />
National Committee for Mangrove Resources<br />
This committee, under the Office <strong>of</strong> the National Research Council, is comprised <strong>of</strong><br />
representatives from various agencies concerned. The duties include coordinating with the<br />
National Committee for Marine Science in aspects related to mangrove resources; consulting in<br />
planning <strong>and</strong> implementing academic research projects; <strong>and</strong> considering mangrove resources<br />
problems, their development, utilization <strong>and</strong> conservation.<br />
Commlttee for Coastal Resources<br />
The committee, composed <strong>of</strong> 23 members, was established by ONEB, with the<br />
Secretary General as chairman. The responsibilities are studying <strong>and</strong> recommending CRM
policy <strong>and</strong> plans to ONEB; supervising <strong>and</strong> controlling action plans <strong>and</strong> operations <strong>of</strong> the coastal<br />
environment; initiating promotion <strong>and</strong> conservation projects under the supervision <strong>of</strong> ONEB; <strong>and</strong><br />
solving other problems on planning <strong>and</strong> implementation.<br />
The committee appointed two subcommittees, namely, the Phuket Action Subcommittee<br />
<strong>and</strong> the National Marine Park Subcommittee.<br />
Committee for Coastal Envlronment<br />
The committee was established by ONEB, with the Secretary General as chairman. The<br />
committee's main function is overseeing <strong>and</strong> guiding the planning <strong>and</strong> implementation <strong>of</strong> all<br />
coastal environmental activities, especially on the Upper South project under the ASEAN<br />
Cooperative Program on Marine Sciences.
Chapter 8<br />
Coastal Resources Management Issues<br />
<strong>and</strong> Plan Formulation<br />
ALAN T. WHITE AND ARTHORN SUPHAPODOK<br />
An intensive workshop on the Upper South CRMP was held in Pattaya, December 1986.<br />
The consensus <strong>of</strong> the workshop participants was that:<br />
1. The overall goal <strong>of</strong> a management plan for the Upper South <strong>and</strong> the resulting<br />
actions at a national level is to promote the socioeconomic development <strong>of</strong> the region.<br />
2. The plan objective is to formulate sustained-use management strategies within key<br />
coastal resource sectors <strong>and</strong> to reduce existing <strong>and</strong> potential intersectoral conflicts resulting in<br />
poor management <strong>and</strong> resource/environmental degradation.<br />
3. The general approach is to formulate sustained-use management strategies by<br />
careful observations <strong>of</strong> the current status <strong>of</strong> coastal resources <strong>and</strong> their management <strong>and</strong> by<br />
generating appropriate plans based on these observations in consultation with local resource<br />
users <strong>and</strong> beneficiaries.<br />
Project Boundaries <strong>and</strong> Llmits<br />
Time <strong>and</strong> financial limitations are always present in a large project such as the ASEAN-<br />
US CRMP. It is thus necessary to set definite boundaries in both geographical <strong>and</strong> sectoral<br />
senses. It has been decided that since the Upper South Region is very large, the CRMP should<br />
then focus on the coastal <strong>and</strong> <strong>of</strong>fshore resources. It is not practical to make a detailed l<strong>and</strong><br />
capability assessment <strong>and</strong> to monitor changes <strong>of</strong> the l<strong>and</strong> use pattern <strong>of</strong> the whole Upper South<br />
which covers 43,270 km? Furthermore, broad development planning <strong>of</strong> the Southern Region<br />
has already been conducted by several government <strong>and</strong> nongovernment agencies (REDECON<br />
1975; JlCA 1985).<br />
Figs. 1 .I, 1.3 <strong>and</strong> 1.8 show the proposed CRMP area for <strong>Ban</strong> <strong>Don</strong> <strong>Bay</strong> in Surat Thani<br />
<strong>and</strong> the associated <strong>of</strong>fshore isl<strong>and</strong>s. The distance from the shoreline (including mangrove<br />
swamps) to inl<strong>and</strong> is approximately 8 to 15 km. The inl<strong>and</strong> section is bounded by the<br />
interprovincial highway which is easy to recognize. The general l<strong>and</strong>scape <strong>of</strong> <strong>Ban</strong> <strong>Don</strong> <strong>Bay</strong> area<br />
can be seen in the cross-sections <strong>of</strong> Figs. 1.3 <strong>and</strong> 1.4.<br />
Figs. 1 .I, 1.6 <strong>and</strong> 1.8 show the proposed project area on the Andarnan Sea side <strong>of</strong><br />
Upper South. Here, the coast <strong>of</strong> <strong>Phangnga</strong> <strong>Bay</strong> <strong>and</strong> its mangrove forest <strong>and</strong> the coral areas <strong>of</strong><br />
Phuket <strong>and</strong> Krabi are included. The <strong>of</strong>fshore fisheries <strong>and</strong> small isl<strong>and</strong>s in the bay are also<br />
included. The reasons for selecting this zone are:
1. This zone includes important ecosystems <strong>and</strong> coastal resources such as<br />
mangroves, beaches, mudflats, estuaries, coral reefs, coastal vegetation, isl<strong>and</strong>s <strong>and</strong><br />
openwater fisheries.<br />
2. This zone is intensely used for agriculture <strong>and</strong> for its natural resources both in- <strong>and</strong><br />
<strong>of</strong>fshore.<br />
3. The socioeconomic factors affecting l<strong>and</strong> <strong>and</strong> coastal resource use are complex <strong>and</strong><br />
cause increasing pressure on the resources.<br />
4. The delicate balance <strong>of</strong> the coastal ecosystems is threatened with potentially<br />
negative consequences for sustainable resource use in the area.<br />
The information required to begin the formulation <strong>of</strong> a management plan is included. The<br />
chapters <strong>and</strong> sections <strong>of</strong> this environmental pr<strong>of</strong>ile indicate those areas <strong>of</strong> importance. The<br />
secondary information is now complete but the more important data on the current status <strong>of</strong> the<br />
coastal resources <strong>and</strong> environment are being collected. The primary sectors are those on<br />
aquaculture; fisheries; mangroves; marine environment; l<strong>and</strong>-based pollution; wildlife; l<strong>and</strong><br />
capability; socioeconomics <strong>and</strong> anthropological/cultural studies <strong>of</strong> the coastal residents, tourism<br />
development; <strong>and</strong> the legal institutional framework for plan implementation.<br />
The focus <strong>of</strong> information collected during the various studies is on management issues<br />
<strong>and</strong> planning. It is intended that information relevant for practical planning <strong>and</strong> implemen~ation<br />
be the outcome <strong>of</strong> field studies. Examples <strong>of</strong> appropriate data are current l<strong>and</strong> use maps; the<br />
location <strong>and</strong> quantity <strong>of</strong> l<strong>and</strong>-based pollution; trends <strong>and</strong> problems <strong>of</strong> aquaculture; fisheries<br />
stock assessment analysis in relation to fishing gear <strong>and</strong> intensity; primary resources <strong>and</strong> their<br />
relative importance to tourism; location <strong>and</strong> density <strong>of</strong> vulnerable wildlife; status <strong>of</strong> existing<br />
protected areas; perception <strong>of</strong> local residents on coastal resource use; <strong>and</strong> current problems <strong>of</strong><br />
resource use from both national <strong>and</strong> local perspectives.<br />
Coastal Resources Management Issues<br />
Overlapping responsibilities <strong>and</strong> conflicting jurisdiction <strong>of</strong> coastal resources among key<br />
government agencies is a major CRM issue. With such conflicts, the lack <strong>of</strong> a single authority to<br />
implement management measures is one <strong>of</strong> the reasons for the rapid deterioration <strong>of</strong> coastal<br />
resources. Present laws such as the Nature Conservation Acts <strong>and</strong> the Natural Resources<br />
Exploitation Acts need to be amended to minimize sectoral overlapping as well as to enlarge<br />
their scope to include critical habitats <strong>and</strong> resources such as coral reefs. More authority should<br />
be given to existing committees to control <strong>and</strong> advise key agencies involved in CRM.<br />
Other important issues include resource use which conflicts with development activities.<br />
An example is tin mining which affects the coastal resort area <strong>and</strong> the mangroves through<br />
excessive sedimentation from mine tailings. Domestic <strong>and</strong> industrial pollution also affects<br />
tourism <strong>and</strong> fisheries production, causing loss <strong>of</strong> critical habitat. Inappropriate l<strong>and</strong> use.<br />
socioeconomic problems <strong>and</strong> lack <strong>of</strong> sufficient information base on the various resources in the<br />
region are other issues which need attention for the development <strong>of</strong> a workable management<br />
plan for the Upper South.<br />
Some major problems resulting from the overlapping laws <strong>and</strong> responsibilities are<br />
(TISTR 1985) (Fig. 8.1 <strong>and</strong> 8.2):<br />
RFD has authority in mangrove forest management <strong>and</strong> gives <strong>of</strong>ficial logging<br />
concessions to private firms, with limited regard to the impact on coastal fisheries <strong>and</strong><br />
aquaculture which are under DOF <strong>and</strong> are dependent on mangrove forest.
1 Forestry I<br />
Fig. 8.1. Key sector-specific coastal resources issues/constraints in<br />
the Upper South, Thail<strong>and</strong>.<br />
I Industry<br />
Urban development<br />
Tourism<br />
Wildlife<br />
I Forestry<br />
Fig. 8.2. Key inrersectoral conflicts resulting in<br />
coastal degradation in the Upper South, Thail<strong>and</strong>.<br />
DOMR grants concessions to tin mining in mangrove forest with little regard to adverse<br />
impact on mangrove forest <strong>and</strong> coastal fisheries which are under the jurisdiction <strong>of</strong> RFD <strong>and</strong><br />
DOF, respectively. Attempts have been made to solve this problem by establishing various<br />
committees such as the Central Subcommittee for Coastal Development <strong>and</strong> the Provincial<br />
Subcommittee for L<strong>and</strong> Classification <strong>and</strong> Coastal Development. These two coordinate with the<br />
implementing agencies in the coastal area but have little authority to control their operation.<br />
Consequently, it is unlikely that they can be successful in solving the problems <strong>of</strong> coastal<br />
resource use.<br />
The management issues summarized in Table 8.1 indicate similarities among the<br />
various sectors. A difference <strong>of</strong> perspectives among the sectors accounts for most superficial<br />
variation or whether a "cause" is an "issue" or vice-versa.<br />
Table 8.1. Management issues <strong>and</strong> objectives.<br />
Issues Sub-issues Causes Management objectives<br />
Degradation <strong>of</strong> forest<br />
resources Mangrove l<strong>and</strong> use conflicts<br />
Aquaculture<br />
Tin mining<br />
Resettlement<br />
Urban expansion<br />
Industry (tourism,<br />
logging)<br />
Low mangrove productivity<br />
Lack <strong>of</strong> multiple use system<br />
aquaculture <strong>and</strong> silvi-<br />
culture<br />
Conflicting interests among sectors;<br />
lack definitive plans <strong>and</strong> aerial<br />
zonation<br />
Use for firewood, charcoal, timber,<br />
lumber: illegal cutting above<br />
renewable rate; low natural<br />
regeneration<br />
Poor planning <strong>and</strong> economic pressure<br />
to exaloit<br />
Classification <strong>of</strong> mangrove l<strong>and</strong>use<br />
zones, economic use<br />
zones, critical habitat areas,<br />
etc.<br />
Maintaining sustainable use<br />
through proper zonation <strong>and</strong><br />
exploiration plan: increasing<br />
production<br />
Sustainable use with maintenance<br />
<strong>of</strong> critical habirats<br />
Continued
Table 8.1. Continued<br />
Low Public awareness No education or extension; lack <strong>of</strong><br />
Poor institutional coordina-<br />
tion<br />
Inl<strong>and</strong> forest degradation<br />
<strong>and</strong> reduction<br />
participation<br />
Lack <strong>of</strong> clear jurisdiction: poor<br />
field implementation<br />
Encroachment; illegal logging; over-<br />
exploitation: no replantation;<br />
poor law enforcement<br />
Wildlife Habitat destruction Forest clearing for aquaculture.<br />
mining, infrastructure, agriculture<br />
<strong>and</strong> urban development<br />
Low public awareness <strong>of</strong> the impor-<br />
tance <strong>of</strong> wildlife; poor manage-<br />
ment <strong>of</strong> protected areas<br />
High harvesting: habitat disturbances<br />
<strong>and</strong> destructi0n;diminishing<br />
wildlife<br />
Involvement <strong>of</strong> local users in<br />
a management plan<br />
Better cooperation; clear pro-<br />
grams for management<br />
L<strong>and</strong> use planning: protected<br />
areas<br />
Diminishing wildlife Education; proper management<br />
<strong>of</strong> protected areas<br />
Low reproduction <strong>of</strong> wild-<br />
life<br />
Uncontrolled hunting <strong>and</strong><br />
trapping<br />
Poor economic base <strong>of</strong> local people;<br />
high wrice paid for wildlife meat,<br />
alive or dead; increasing popula-<br />
Sustainable use; protected areas;<br />
reintroduction <strong>of</strong> some spe-<br />
cies; improved habitat; man-<br />
agemenr <strong>of</strong> specific species<br />
Protected areas; law enforce-<br />
ment; education: increasing<br />
st<strong>and</strong>ard <strong>of</strong> living<br />
Low public awareness<br />
tion<br />
Poor education; lack <strong>of</strong> information; Training <strong>and</strong> education<br />
Poor maintenance <strong>of</strong> pro-<br />
tected areas<br />
poor public cooperation<br />
Poor or no management; encroach-<br />
ment <strong>of</strong> people<br />
Institutional conflicts Poor cooperation: lack <strong>of</strong> man-<br />
power; poor coordination at<br />
local level<br />
Tourism Coral reef degradation Destructive fishing; collecting corals/<br />
fish; siltation; boat anchors<br />
Unplanned development<br />
Waste disposal<br />
Poor administration <strong>and</strong> planning<br />
Poor laws <strong>and</strong> enforcement<br />
Forest degradation Village, small-scale cutting; logging<br />
Inequitable distribution <strong>of</strong><br />
tourism benefits<br />
Capture fisheries Overfishing <strong>of</strong> demersal<br />
fisheries<br />
Aquaculture<br />
Caoture <strong>of</strong> undersized fish<br />
Presence <strong>of</strong> various types <strong>of</strong><br />
fishing gears within a<br />
fishing area<br />
Unreliable information on<br />
catch <strong>and</strong> effort from<br />
commercial sector<br />
Inefficient use <strong>of</strong> existing<br />
catch<br />
Limits <strong>of</strong> expansion <strong>and</strong> con-<br />
flict with mangrove habitat<br />
Effects <strong>of</strong> wastewater on aqua^<br />
culture ponds<br />
Lack <strong>of</strong> integrated development <strong>and</strong><br />
local participation<br />
New approaches to protected<br />
area management; more pro-<br />
tected areas<br />
Clarifying jurisdiction <strong>and</strong> role<br />
in management; revising some<br />
laws<br />
Increasing awareness: educating<br />
tourism operators; protected<br />
areas<br />
Planning <strong>and</strong> field management<br />
Improving legal framework:plan-<br />
ning waste disposal systems;<br />
enforcing laws<br />
Protected areas: watershed man-<br />
agement<br />
Training local residents: appro-<br />
priate scale development<br />
Excessive effort; too many vessels Limit ng access; promoting alter-<br />
narive livelihood<br />
Fine mesh nets: excessive trawling<br />
<strong>and</strong> extensive use <strong>of</strong> push nets<br />
Competition <strong>of</strong> many gear types in<br />
limited areas<br />
Poor reporting; communication<br />
gaps<br />
Poor h<strong>and</strong>ling qnd wasteful harvest-<br />
ing<br />
Implementing proper mesh size<br />
0'3 crn<br />
Allocation <strong>of</strong> resources <strong>and</strong><br />
areas: divisions by territories<br />
or traditional rights<br />
Establishing areas for monitor-<br />
ing catch <strong>and</strong> effort<br />
Education; training<br />
Need to maintain mangrove habitat Zonation scheme for aqua-<br />
Industrial pollution, domestic waste,<br />
operation <strong>of</strong> Chiew Larn Dam<br />
culture development in man-<br />
groveiestuarine areas<br />
Minimizing pollution; establish-<br />
mg sewerage systems<br />
Continued
Table 8.1. Continued<br />
Mortality <strong>of</strong> cage culture fish<br />
from shrimp pond waste-<br />
water<br />
Lack <strong>of</strong> organization among<br />
pond <strong>and</strong> cage farmers<br />
Shortage <strong>of</strong> cockle seeds in<br />
<strong>Ban</strong> <strong>Don</strong> <strong>Bay</strong><br />
L<strong>and</strong>-based pollution Surat Thani<br />
Water pollution on oyster <strong>and</strong><br />
shrimp farms at <strong>Ban</strong> <strong>Don</strong><br />
Socioeconomics<br />
<strong>Bay</strong>: contamination by<br />
coliform bacteria<br />
Water quality in K. Phum<br />
Duang (downstream from<br />
Chiew Larn Dam) affecting<br />
aquatic life<br />
High waste loading <strong>of</strong> effluents<br />
from seafood processing<br />
industries along<br />
K. Tapi<br />
Domestic wastewater sewerage<br />
system directly discharged<br />
ro K. Tapi<br />
Pesticides used to eliminate undesir-<br />
able species in ponds: draining<br />
without dilution<br />
Poor cooperation; poor organizing<br />
by government agencies<br />
Destruction <strong>of</strong> bottom habitat for<br />
cockles by push netting<br />
Direct discharge <strong>of</strong> domestic waste-<br />
water: excreta, sewerage into<br />
water<br />
Chiew Larn Dam discharge <strong>of</strong> low-<br />
quality water into K. Phum<br />
Duang<br />
Some industries on these areas dis-<br />
charge directly or indirectly<br />
disqualified wastewaters (based<br />
on IWD effluent st<strong>and</strong>ard) into<br />
K. Tapi: direct discharging <strong>of</strong><br />
raw wastewater in receiving water<br />
<strong>and</strong> direct discharging <strong>of</strong> low-<br />
quality treated wastewater<br />
No wastewater treatment plant on<br />
municipal area<br />
Insufficient drainage system in<br />
municipal area<br />
High waste loading <strong>of</strong> ef- Direct discharge <strong>of</strong> treated waste-<br />
fluents from distillery water <strong>and</strong> disposal <strong>of</strong> residuals<br />
on K. Tapi from distillery into K. Tapi<br />
<strong>Phangnga</strong><br />
Shallowness <strong>of</strong> K. <strong>Phangnga</strong><br />
<strong>and</strong> K. <strong>Ban</strong>g Toey<br />
Municipal wastewater, same as<br />
Surat Thani<br />
Krabi<br />
High waste loading <strong>of</strong> effluents<br />
from industries (especially<br />
oil palm industry)<br />
Municipal wastewater: same<br />
as Surat Thani<br />
<strong>Ban</strong> <strong>Don</strong> <strong>Bay</strong><br />
L<strong>and</strong> ownership conflicts with<br />
oyster farms<br />
Securiry<br />
<strong>Phangnga</strong><br />
Fish for cage culture, scarce;<br />
decreasing fish catch<br />
Lack <strong>of</strong> fishermen's knowledge<br />
to deal with resource use<br />
problems<br />
Precipitation <strong>of</strong> suspended solids<br />
discharged from mines<br />
Same as in Surat Thani<br />
Discharging <strong>of</strong> effluents into receiv-<br />
ing water<br />
Same as in Surat Thani<br />
Limited area <strong>and</strong> destruction <strong>of</strong> habi-<br />
tat by push nets<br />
Poaching among oyster breeders<br />
Overfishing <strong>and</strong> habitat disturbance;<br />
overpopulation<br />
Lack <strong>of</strong> education <strong>and</strong> alternative<br />
livelihood<br />
Minimizing use <strong>of</strong> detrimental<br />
chemicals<br />
Forming cooperatives; educa-<br />
tion<br />
Protecting cockle spawning <strong>and</strong><br />
nursery grounds<br />
Control <strong>and</strong> prevention <strong>of</strong> do-<br />
Nle~Tic wastewater entering<br />
oyster <strong>and</strong> shrimp farms<br />
Control <strong>of</strong> water flow rate<br />
from dam discharging into<br />
K. Phum Duang<br />
Control <strong>of</strong> wastewaters based<br />
on IWD effluent st<strong>and</strong>ard<br />
Control <strong>of</strong> domestic waste-<br />
water based on ONEB<br />
st<strong>and</strong>ard<br />
Control <strong>of</strong> quality <strong>of</strong> waste-<br />
waters from specific activi-<br />
ties in places such as mar-<br />
ket, hotel, abattoir, etc.<br />
Finding a way to reduce waste<br />
load <strong>and</strong> to treat residuals;<br />
control <strong>of</strong> treated waste-<br />
water based on IWD ef-<br />
fluent st<strong>and</strong>ard<br />
Reducing suspended solids lond-<br />
ed from mining activities<br />
Same as in Surat Thani<br />
Same as in Surat Thani<br />
Same as in Surat Thani<br />
Area use plan to limit <strong>and</strong><br />
zone activities<br />
Community cooperation<br />
Fisheries management; habitat<br />
maintenance<br />
Education; community organization;<br />
alternative livelihoods<br />
Continued
Table 8,l. Continued<br />
<strong>Phangnga</strong> <strong>Bay</strong><br />
Constraints Large salinity variations up to<br />
15 P P~<br />
High concentration <strong>of</strong> sus-<br />
pended solids but low<br />
organic contents in inner<br />
bay region<br />
Low oxygen <strong>and</strong> total alkali-<br />
nity in the mariculrure<br />
areas at <strong>Ban</strong> Khok Khrai<br />
High coliform values<br />
Total fish larvae in the bay<br />
are predominantly com-<br />
posed <strong>of</strong> species <strong>of</strong><br />
economic value<br />
Low abundance in total fish<br />
larvae in the inner bay<br />
High abundance in total fish<br />
larvae in outer bay,<br />
particularly on the east-<br />
ern-side<br />
Fish larvae tend to move out<br />
from the bay<br />
Heavy precipitation <strong>and</strong> dry periods<br />
during southwest monsoon (May-<br />
Oct)<br />
Mining-in the mangrove areas <strong>and</strong><br />
dirharge <strong>of</strong> high silt loads<br />
Relatively insufficient water move-<br />
tnent to remove <strong>and</strong> dilute the<br />
high accumulation <strong>of</strong> organic<br />
wastes<br />
Food from improper feediny prac-<br />
tices<br />
Fish larvae seem to move from the<br />
inner bay out to the sea<br />
Movements <strong>of</strong> larvae from the inner<br />
bay to the sea showed good cor-<br />
relation to the general patterns<br />
<strong>of</strong> net transport <strong>of</strong> tidal currents<br />
from the bay<br />
Selection <strong>of</strong> species tolerable<br />
to salinity variations for<br />
rnariculture; site selection<br />
more than 2 km from shore<br />
If the cause is the present mining<br />
operations, tho suspended<br />
solids <strong>of</strong> railing should be<br />
concentrated <strong>and</strong> settled in a<br />
s<strong>and</strong> bar<br />
Increasing wafer movement by<br />
leaving sufficient space be-<br />
tween cages; cleaning the<br />
nets <strong>of</strong> bi<strong>of</strong>oulers so that<br />
water would pass through<br />
easily<br />
Critically managing <strong>and</strong> improv-<br />
ing the feeding procedures:<br />
mechanical resuspension <strong>of</strong><br />
settled materials (e.g., turbu-<br />
lence caused by boat propel-<br />
lers) during strong flow <strong>of</strong><br />
ebb tides is useful in acce-<br />
lerating restoration processes<br />
Encouraging moniroring <strong>and</strong><br />
immediate findings for space-<br />
time shift <strong>of</strong> abundance <strong>of</strong><br />
fish larvae<br />
Implementing temporary close<br />
seasons to particular places<br />
for rawl ling, push netting or<br />
other fishing mefhods<br />
Encouraging <strong>and</strong> promoting ef-<br />
fective enfol-cement<br />
Building artificial habitats (e.g.,<br />
artificial reefs) ro hold fish<br />
stocks <strong>and</strong> prevent bottom<br />
trawling<br />
Clearly, there are several major issues which need to be dealt with in the course <strong>of</strong> CRM<br />
planning in the Upper South. In <strong>Ban</strong> <strong>Don</strong> <strong>Bay</strong>, the prime concerns are loss <strong>of</strong> mangrove habitat;<br />
lack <strong>of</strong> planned aquaculture development; sustaining mollusk culture production; overfishing in<br />
the bay; increasing pollution <strong>of</strong> the rivers, bay <strong>and</strong> inshore waters around the isl<strong>and</strong>s;<br />
inappropriate tourism development; <strong>and</strong> maintenance <strong>of</strong> coral reef areas <strong>and</strong> management <strong>of</strong><br />
the protected areas <strong>of</strong> Ang Thong National Marine Park. In <strong>Phangnga</strong> <strong>Bay</strong>, the prime concerns<br />
are: loss <strong>of</strong> mangrove habitat; overfishing in the bay; sustaining cage culture production; water<br />
pollution, tin mining <strong>and</strong> resulting turbidity <strong>and</strong> siltation; inappropriate tourism development;<br />
maintenance <strong>of</strong> <strong>Phangnga</strong> National Park; <strong>and</strong> designation <strong>and</strong> protection <strong>of</strong> critical habitat areas<br />
such as coral reefs. For planning <strong>and</strong> implementation to be smooth in both areas, institutional<br />
jurisdiction must be clarified. Some new laws have to be created <strong>and</strong> existing laws, enforced or<br />
amended. Probably <strong>of</strong> greatest importance for implementation at the local level is the<br />
participation <strong>of</strong> concerned local government <strong>and</strong> private institutions <strong>and</strong> individuals who can play<br />
a role in CRM <strong>and</strong>/or conservation.
Conceptual Framework<br />
for Coastal Area Management Planning<br />
The process <strong>of</strong> CRM planning involves different inputs <strong>and</strong> the participation <strong>of</strong> various<br />
agencies <strong>and</strong> individuals at the national, provincial <strong>and</strong> local levels. Relevant information on the<br />
status <strong>of</strong> coastal resources <strong>and</strong> environments is a pre-requisite to proper planning. This<br />
information is now being generated <strong>and</strong> will evolve Into management plans. The overall<br />
framework for the evolution <strong>of</strong> plans is shown in Fig. 8.3. Here, the outputs (Fig, 8.4) are<br />
expressed as: (1) final goals, objectives <strong>and</strong> planning policies; (2) protected area management<br />
plans <strong>and</strong> implementation <strong>and</strong> (3) issue-oriented action plans for primary sectoral conflicts.<br />
process Content <strong>and</strong> output<br />
CRM pr<strong>of</strong>ile Project goals <strong>and</strong> objectives<br />
Secondary information Background <strong>and</strong> scope<br />
Reports Projeci boundaries (geographical <strong>and</strong> institutionaillegal)<br />
Workshops Overview <strong>of</strong> the coastal resources, environment,<br />
socioeconomics, culture, population, institutions <strong>and</strong> laws<br />
CRM issues<br />
Primary data collection<br />
Refinement <strong>of</strong> status <strong>of</strong> the coastal resources, environment,<br />
by task teams<br />
socioeconomics, institutional participation, effectiveness <strong>of</strong><br />
Position papers<br />
Summaries <strong>of</strong> data on CRM -<br />
laws <strong>and</strong> boundaries <strong>of</strong> the project<br />
Refinement <strong>of</strong> management <strong>and</strong> resource use/confiict issues<br />
Current status <strong>of</strong> environment <strong>and</strong> cond~tion <strong>of</strong> protected areas<br />
issues to be made by task teams <strong>and</strong> their management<br />
Setting priorities <strong>and</strong> Final goals <strong>and</strong> objectives<br />
determining management Planning policies<br />
actions by planning team Protected area management planslimplcmcntation<br />
<strong>and</strong> local participants Issue-oriented action plans for primary sectoral conflicts<br />
Fig. 8.3. Conceptual framework for CRM planning In the Upper Soulh,Thail<strong>and</strong><br />
Existing management<br />
Plans~lawslprotecled areas<br />
1 Planning policios/strategies<br />
L<br />
Institutional framework<br />
Critical habitat<br />
Conservation areas<br />
Water qual~ty<br />
Fisheries management<br />
Tourism guidelines<br />
Threatened wildlife<br />
Coastal structures/dovelopment<br />
General goals <strong>and</strong> policy lor<br />
each management area<br />
Planslimolemvntation<br />
Issue-based action plans<br />
Legallinstitutional<br />
Specific action/zone<br />
Fisheries<br />
Plans for <strong>Phangnga</strong> NP.<br />
Tourism<br />
Mu KO Ang Thong<br />
Aquaculture<br />
staff training<br />
Mangrove<br />
New areas<br />
Pollution control<br />
1<br />
1. Protected area management 1<br />
Fig. 8.4. Content <strong>of</strong> rnanagcment planning in the Upper South, Thail<strong>and</strong><br />
I<br />
[ lmplementationlconflict resolution ]
Parsons, T.R., M. Takahashi <strong>and</strong> B. Hargrave. 1977. Biological oceanographic processes. 2nd ed. Pergamon Press, Oxford.<br />
PC1 Design 103 Ltd. 1979. Master plan <strong>and</strong> feasibility study: tourism development <strong>of</strong> Phuket, final report. Vol. 1 <strong>and</strong> 2. Tourism<br />
Authority <strong>of</strong> Thail<strong>and</strong>, Thail<strong>and</strong>.<br />
Petersen. G.H. <strong>and</strong> M.A. Curtis. 1980. Differences in energy flow through major components <strong>of</strong> subarctic, temperate <strong>and</strong> tropical<br />
marine shelf ecosystems. Dana 1: 53-64.<br />
Prateung, K. 1976. Chao numchao tale in Thail<strong>and</strong>. Charernpnon, <strong>Ban</strong>gkok.<br />
REDECON (Resources <strong>and</strong> Development Consultant Limited). 1975. Southern Thail<strong>and</strong>: regional planning study. Resourccs <strong>and</strong><br />
strategies. Vol. 1. Resources <strong>and</strong> Development Consultant Limited, Thail<strong>and</strong><br />
Saitanu, K., S. Luangtongkum, K. Poonsuk <strong>and</strong> T. Chalermchaikit. 1984a. Microbiological quality <strong>of</strong> the East Coast <strong>of</strong> the Upper Gulf<br />
<strong>of</strong> Thail<strong>and</strong>, p. 258-276. In Proceedings <strong>of</strong> the Third Seminar on the Water Quality <strong>and</strong> the Quality <strong>of</strong> Living Resources in<br />
Thai Waters, 26-28 March 1984. Offim <strong>of</strong> the National Research Council <strong>of</strong> Thail<strong>and</strong>, Thail<strong>and</strong>.<br />
Saitanu, K., T. Chalermchaikij, S. Luangtongkum <strong>and</strong> K. Poonsuk. 1984b. The microbial loads <strong>of</strong> mussel (Perna viridis) <strong>and</strong> oystcrs<br />
(Crassostrea carnrnercialis), p. 277-284. In Proceedings <strong>of</strong> the Third Seminar on the Water Quality <strong>and</strong> tha Quality <strong>of</strong><br />
Living Resources in Thai Waters, 26-28 March 1984. Office <strong>of</strong> the National Research Council <strong>of</strong> Thail<strong>and</strong>, Thail<strong>and</strong>.<br />
Siripong, A., editor. 1987. Estuarine ecosystems <strong>of</strong> the Phang-nga <strong>Bay</strong>. Marine geology. National Research Council <strong>of</strong> Thail<strong>and</strong>,<br />
Thail<strong>and</strong>.<br />
Sunstrom, B., V. Janekarn, J. Hylleberg <strong>and</strong> P. Boonruang. 1986. Annual pelagic primary production with notes on physicalchemical<br />
variables at Phuket, Andaman Sea, Thail<strong>and</strong>.<br />
TAT (Tourism Authority <strong>of</strong> Thail<strong>and</strong>). 1986a. Survey <strong>of</strong> hotel occupancy rates at Dey tourism cities (in Thai). Tourism Authority <strong>of</strong><br />
Thail<strong>and</strong>, Thail<strong>and</strong>.<br />
TAT (Tourism Authority <strong>of</strong> Thail<strong>and</strong>). 1986b. Names <strong>and</strong> numbers <strong>of</strong> hotels in Thail<strong>and</strong> (in Thai). Tourism Authority <strong>of</strong> Thail<strong>and</strong>,<br />
Thail<strong>and</strong>.<br />
TDRl (Thail<strong>and</strong> Development Research Institute). 1986. The status <strong>of</strong> coastal <strong>and</strong> marine resources <strong>of</strong> Thail<strong>and</strong>. Thail<strong>and</strong><br />
Development Research Institute, Thail<strong>and</strong>.<br />
TDRl (Thail<strong>and</strong> Development Research Institute). 1987. Thail<strong>and</strong> natural resources pr<strong>of</strong>ile. Thail<strong>and</strong> Development Research<br />
Institute, Thail<strong>and</strong>.<br />
TlSTR (Thail<strong>and</strong> Institute <strong>of</strong> Scientific <strong>and</strong> Cultural Organization). n.d. Economic <strong>and</strong> social development plan for Surat Thani<br />
Province. Thail<strong>and</strong> lnstitute <strong>of</strong> Scientific <strong>and</strong> Technological Research, Thail<strong>and</strong>.<br />
TlSTR (Thail<strong>and</strong> lnstitute <strong>of</strong> Scientific <strong>and</strong> Technological Research). 1984. L<strong>and</strong> use master plan <strong>of</strong> coastal area in Changwat<br />
Phuket. Thail<strong>and</strong> lnstitute <strong>of</strong> Scientific <strong>and</strong> Technological Research, Thail<strong>and</strong>.<br />
TlSTR (Thail<strong>and</strong> Institute <strong>of</strong> Scientific <strong>and</strong> Technological Research). 1985. Master plan for tourism development <strong>of</strong> KO SamuiISurat<br />
Thani. Thail<strong>and</strong> lnstitute <strong>of</strong> Scientific <strong>and</strong> Technological Research, Thail<strong>and</strong>.
ICLARM Technical Reports<br />
The economics <strong>of</strong> catfish farming in central Thail<strong>and</strong>. T. Panayotou, S. Wattanutchariya, S. lsvilanonda <strong>and</strong> R. Tokrisna. 1982.<br />
Reprinted 1985. No. 4, 60 p. $6.50 surface; $10 airmail.<br />
The ICLARM.CLSU integrated animal-fish farming project: final rep<strong>of</strong>l. K.D.Hopkins <strong>and</strong> E.M. Cruz. 1982. No. 5,96 p. $7.75<br />
surface; $14.85 airmail.<br />
Production <strong>and</strong> marketing 01 milkfish in Taiwan: an economic analysis. C.-S. Lee. 1983. No. 6,41 p. $6.30 surface: $9.50 airmail.<br />
Small-scale fisheries <strong>of</strong> San Miguel <strong>Bay</strong>, Philippines: biology <strong>and</strong> stock assessment. D. Pauly <strong>and</strong> A.N. Mines, editors. 1982. No<br />
7, 124 p. $9 surface; $1 6 airmail.<br />
Small-scale fisheries <strong>of</strong> San Miguel <strong>Bay</strong>, Philippines: economics <strong>of</strong> production <strong>and</strong> marketing. I.R. Smith <strong>and</strong> A.N. Mines, editors.<br />
1982. No. 8, 143 p. $12 surface; $25 airmail.<br />
Small-scale fisheries <strong>of</strong> San Miguel <strong>Bay</strong>, Philippines: social aspects <strong>of</strong> production <strong>and</strong> marketing. C. Bailey, editor. 1982. No. 9,<br />
57 p. $8 surface; $14 airmail.<br />
Small-scale fisheries <strong>of</strong> San Miguel <strong>Bay</strong>, Philippines: occupational <strong>and</strong> geographic mobility. C. Bailey. 1982. No. 10, 57 p. $7<br />
surface; $1 1 .SO airmail.<br />
Small-scale fisheries <strong>of</strong> San Miguel <strong>Bay</strong>, Philippines: options for management <strong>and</strong> research. I.R. Smith, D. Pauly <strong>and</strong> A.N. Mines.<br />
No. 11, 80 p. $6.30 surface; $9.50 airmail.<br />
A Japanese flshlng joint venture: worker experience <strong>and</strong> national development in the Solomon Isl<strong>and</strong>s. S.K. Meltz<strong>of</strong>f <strong>and</strong> E.S.<br />
LiPuma. 1983. No. 12, 63 p. $6.55 surface; $10.90 airmail.<br />
An atlas <strong>of</strong> the grovAh, mortality <strong>and</strong> recruitment <strong>of</strong> Philippine fishes. J. lngles <strong>and</strong> D. Pauly. 1985. No. 13, 127 p. $6.55 surface:<br />
$10.90 airmail.<br />
Experimental rearing <strong>of</strong> Nile tilapia fry (Oreochromis nllot1cus)for saltwater culture. W.O. Watanabe, C.-M. Kuo <strong>and</strong> M.-C. Huang.<br />
1984. No. 14, 28 p. $3 surface; $6 airmail.<br />
Milkfish production dualism in the Philippines: a multidisciplinary perspective on continuous low ylelds <strong>and</strong> constraints to<br />
aquaculture development. Chong, MS. Lizarondo, Z.S. dela Cruz, C.V. Guerrero <strong>and</strong> I.R. Smilh. 1984. No. 15.70 p. $7 surface;<br />
$1 0.50 airmail.<br />
Salinity tolerance <strong>of</strong> the tilapias Oreochromis niloticus (L.) <strong>and</strong> an 0. mossambicusx 0. niloticus hybrid. W.O. Watanabe, C.-M.<br />
Kuo <strong>and</strong> M.-C. Huang. 1985. No. 16, 22 p. $3 surface: $7 airmail.<br />
Growth, mortality <strong>and</strong> reciuitment <strong>of</strong> commercially important fishes <strong>and</strong> penaeid shrimps in Indonesian waters. A. Dwiponggo,<br />
T. Hariati, S. <strong>Ban</strong>on, M.L. Palomares <strong>and</strong> 0. Pauly. 1986. No. 17,91 p. $4.50 surface; $8.50 airmail.<br />
The coastal environmental pr<strong>of</strong>ile <strong>of</strong> Brunei Darussalam: resource assessment <strong>and</strong> management issues. T.-E. Chua, L.M. CRou<br />
<strong>and</strong> M.S.M. Sadorra, editors. 1987. No. 18, 194 p. $2 surface; $10 airmail.<br />
The coastal environmental pr<strong>of</strong>ile <strong>of</strong> <strong>Ban</strong> <strong>Don</strong> <strong>Bay</strong> <strong>and</strong> <strong>Phangnga</strong> <strong>Bay</strong>,Thail<strong>and</strong>. J.N. Paw, S. Bunpapong. A.T. White <strong>and</strong> M.S.M.<br />
Sadorra, editors. 1988. No. 20, 79 p. $1 surface; $5 airmail.<br />
Enquirers should address orders <strong>and</strong> payment (payable to ICLARM) in US$ by international money order, bankdraft or<br />
UNESCO coupons to: The Editor, ICLARM. MC P.O. Box 1501, Makati, Metro Manila, Philippines. US$ checks are accepted only if from<br />
a US-based bank due to high clearance fees <strong>of</strong> other banks. Airmail IS strongly recommended due lo dolays <strong>of</strong> up to six months <strong>and</strong><br />
occasional losses experienced with surface mail.