Chief Executive Officer Report - Australian Sports Commission
Chief Executive Officer Report - Australian Sports Commission
Chief Executive Officer Report - Australian Sports Commission

Create successful ePaper yourself
Turn your PDF publications into a flip-book with our unique Google optimized e-Paper software.
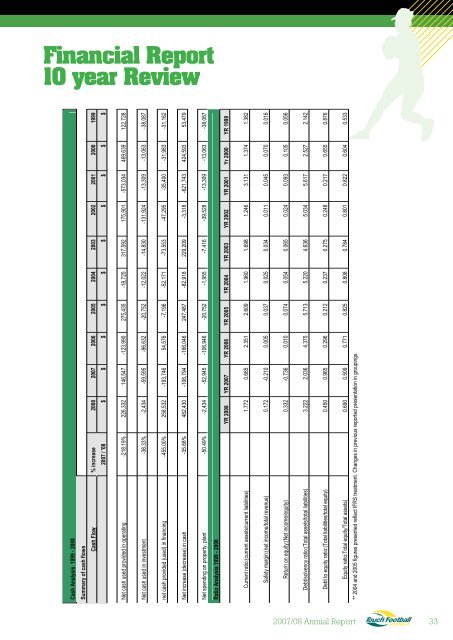
Financial <strong>Report</strong><br />
10 year Review<br />
Cash Analysis 1999 - 2008<br />
Summary of cash flows<br />
Cash Flow % increase 2008 2007 2006 2005 2004 2003 2002 2001 2000 1999<br />
2007 / '08 $ $ $ $ $ $ $ $ $ $<br />
Net cash used provided in operating -218.19% 226,332 146,547 -123,990 275,435 -18,725 317,592 175,901 -573,034 469,639 122,728<br />
Net cash used in investment -38.33% -2,434 -59,595 -96,632 -20,752 -12,022 -14,830 -131,924 -13,309 -13,063 -38,087<br />
net cash provided (used) in financing -455.00% 258,532 -193,746 54,576 -7,196 -52,171 -73,553 -47,295 -35,400 -31,983 -31,162<br />
Net increase (decrease) in cash -35.68% 482,430 -106,794 -166,046 247,487 -82,918 229,209 -3,318 -621,743 424,593 53,479<br />
Net spending on property, plant -50.49% -2,434 -52,945 -106,946 -20,752 -1,955 -7,416 -39,528 -13,309 -13,063 -38,087<br />
Ratio Analysis 1999 - 2008<br />
YR 2008 YR 2007 YR 2006 YR 2005 YR 2004 YR 2003 YR 2002 YR 2001 Yr 2000 YR 1999<br />
Current ratio:(current assets/current liabilities) 1.772 0.665 2.351 2.609 1.960 1.698 1.246 3.131 1.374 1.382<br />
Safety margin:(net income/total revenue) 0.172 -0.210 0.005 0.037 0.025 0.034 0.011 0.045 0.070 0.016<br />
Return on equity:(Net income/equity) 0.332 -0.736 0.010 0.074 0.054 0.065 0.024 0.093 0.105 0.056<br />
Debt/solvency ratio:(Total assets/total liabilities) 3.222 2.036 4.375 5.713 5.220 4.636 5.034 5.617 2.527 2.142<br />
Debt to equity ratio:(Total liabilities/total equity) 0.450 0.965 0.296 0.212 0.237 0.275 0.248 0.217 0.655 0.876<br />
Equity ratio:Total equity/Total assets) 0.690 0.509 0.771 0.825 0.808 0.784 0.801 0.822 0.604 0.533<br />
** 2004 and 2005 figures presented reflect IFRS treatment. Changes in previous reported presentation in groupings.<br />
2007/08 Annual <strong>Report</strong><br />
33