

Historical and Projected Coastal Louisiana Land Changes
Historical and Projected Coastal Louisiana Land Changes
Historical and Projected Coastal Louisiana Land Changes

Create successful ePaper yourself
Turn your PDF publications into a flip-book with our unique Google optimized e-Paper software.
Small portion of CWPPRA project areas where 1978 data were not available: 1990 to<br />
2000. (Fortunately, none of the CWPPRA projects in this area produced the immediate<br />
<strong>and</strong> one-time increases in l<strong>and</strong> referenced above.)<br />
The compound rate function (formula 1) was used to calculate the annual l<strong>and</strong>-water change<br />
rate. Change rates (l<strong>and</strong>-water conversion) were not calculated for actively managed areas.<br />
These areas were masked out for each of the data sources because active water management<br />
can produce misclassification of l<strong>and</strong> versus water. For example, when an area is<br />
intentionally flooded for management purposes, the area would likely be classified as water,<br />
potentially showing up as l<strong>and</strong> loss when a true loss did not actually occur. (Note: These<br />
areas were excluded from the source data so they would not be used in generating the change<br />
rates.) Actively managed areas were depicted as they appeared in the 2000 source with no<br />
change in the 50-year projection.<br />
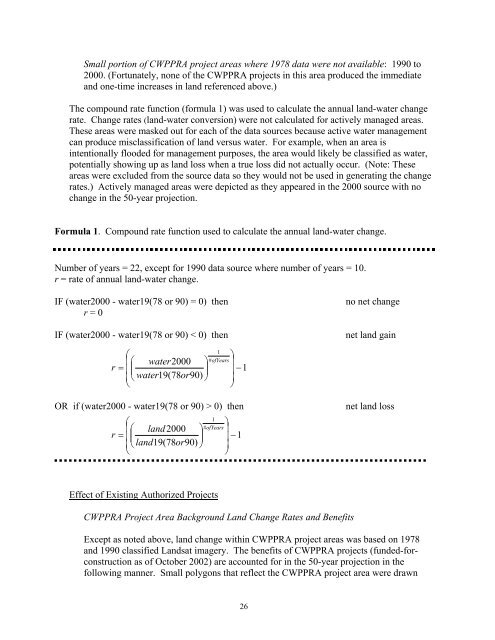
Formula 1. Compound rate function used to calculate the annual l<strong>and</strong>-water change.<br />
Number of years = 22, except for 1990 data source where number of years = 10.<br />
r = rate of annual l<strong>and</strong>-water change.<br />
IF (water2000 - water19(78 or 90) = 0) then no net change<br />
r = 0<br />
IF (water2000 - water19(78 or 90) < 0) then net l<strong>and</strong> gain<br />
⎛<br />
⎜⎛<br />
water2000<br />
⎞<br />
r = ⎜⎜<br />
⎟<br />
⎜⎝<br />
water19(<br />
78or90)<br />
⎠<br />
⎝<br />
1<br />
# ofYears<br />
⎞<br />
⎟<br />
⎟ −1<br />
⎟<br />
⎠<br />
OR if (water2000 - water19(78 or 90) > 0) then net l<strong>and</strong> loss<br />
⎛<br />
⎜⎛<br />
l<strong>and</strong> 2000 ⎞<br />
r = ⎜⎜<br />
⎟<br />
⎜⎝<br />
l<strong>and</strong>19(<br />
78or90)<br />
⎠<br />
⎝<br />
1<br />
# ofYears<br />
Effect of Existing Authorized Projects<br />
⎞<br />
⎟<br />
⎟ −1<br />
⎟<br />
⎠<br />
CWPPRA Project Area Background L<strong>and</strong> Change Rates <strong>and</strong> Benefits<br />
Except as noted above, l<strong>and</strong> change within CWPPRA project areas was based on 1978<br />
<strong>and</strong> 1990 classified L<strong>and</strong>sat imagery. The benefits of CWPPRA projects (funded-forconstruction<br />
as of October 2002) are accounted for in the 50-year projection in the<br />
following manner. Small polygons that reflect the CWPPRA project area were drawn<br />
26


