Monitoring chemical processes for early fault detection using ... - Camo
Monitoring chemical processes for early fault detection using ... - Camo
Monitoring chemical processes for early fault detection using ... - Camo

You also want an ePaper? Increase the reach of your titles
YUMPU automatically turns print PDFs into web optimized ePapers that Google loves.
CAMO 10 <strong>Monitoring</strong> <strong>chemical</strong> <strong>processes</strong><br />
> Bring data to life > camo.com<br />
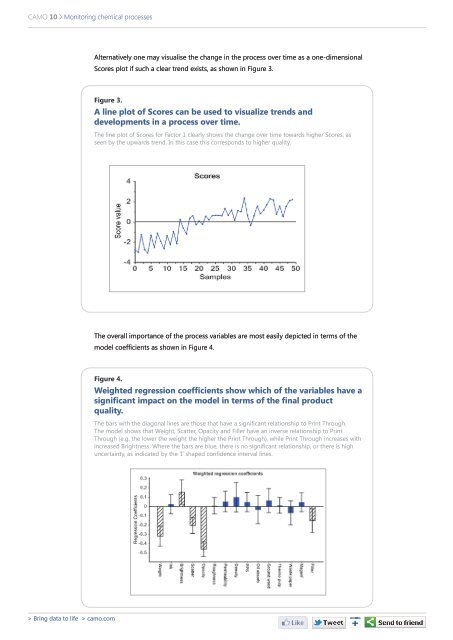
Alternatively one may visualise the change in the process over time as a one-dimensional<br />
Scores plot if such a clear trend exists, as shown in Figure 3.<br />
Figure 3.<br />
A line plot of Scores can be used to visualize trends and<br />
developments in a process over time.<br />
The line plot of Scores <strong>for</strong> Factor 1 cl<strong>early</strong> shows the change over time towards higher Scores, as<br />
seen by the upwards trend. In this case this corresponds to higher quality.<br />
The overall importance of the process variables are most easily depicted in terms of the<br />
model coefficients as shown in Figure 4.<br />
Figure 4.<br />
Weighted regression coefficients show which of the variables have a<br />
significant impact on the model in terms of the final product<br />
quality.<br />
The bars with the diagonal lines are those that have a significant relationship to Print Through.<br />
The model shows that Weight, Scatter, Opacity and Filler have an inverse relationship to Print<br />
Through (e.g. the lower the weight the higher the Print Through), while Print Through increases with<br />
increased Brightness. Where the bars are blue, there is no significant relationship, or there is high<br />
uncertainty, as indicated by the ’I’ shaped confidence interval lines.<br />
Figure 4. The model summarised in terms of the regression coe�cients with signi�cant variables marked.