Monitoring chemical processes for early fault detection using ... - Camo
Monitoring chemical processes for early fault detection using ... - Camo
Monitoring chemical processes for early fault detection using ... - Camo

You also want an ePaper? Increase the reach of your titles
YUMPU automatically turns print PDFs into web optimized ePapers that Google loves.
CAMO 04 <strong>Monitoring</strong> <strong>chemical</strong> <strong>processes</strong><br />
MSPM<br />
Multivariate Statistical<br />
Process <strong>Monitoring</strong><br />
> Bring data to life > camo.com<br />
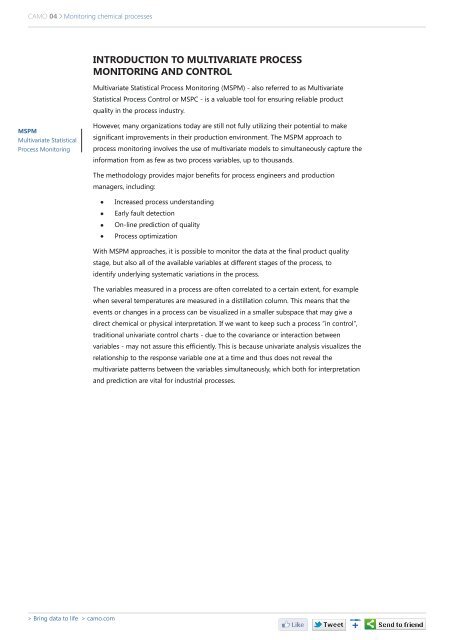
INTRODUCTION TO MULTIVARIATE PROCESS<br />
MONITORING AND CONTROL<br />
Multivariate Statistical Process <strong>Monitoring</strong> (MSPM) - also referred to as Multivariate<br />
Statistical Process Control or MSPC - is a valuable tool <strong>for</strong> ensuring reliable product<br />
quality in the process industry.<br />
However, many organizations today are still not fully utilizing their potential to make<br />
significant improvements in their production environment. The MSPM approach to<br />
process monitoring involves the use of multivariate models to simultaneously capture the<br />
in<strong>for</strong>mation from as few as two process variables, up to thousands.<br />
The methodology provides major benefits <strong>for</strong> process engineers and production<br />
managers, including:<br />
Increased process understanding<br />
Early <strong>fault</strong> <strong>detection</strong><br />
On-line prediction of quality<br />
Process optimization<br />
With MSPM approaches, it is possible to monitor the data at the final product quality<br />
stage, but also all of the available variables at different stages of the process, to<br />
identify underlying systematic variations in the process.<br />
The variables measured in a process are often correlated to a certain extent, <strong>for</strong> example<br />
when several temperatures are measured in a distillation column. This means that the<br />
events or changes in a process can be visualized in a smaller subspace that may give a<br />
direct <strong>chemical</strong> or physical interpretation. If we want to keep such a process ”in control”,<br />
traditional univariate control charts - due to the covariance or interaction between<br />
variables - may not assure this efficiently. This is because univariate analysis visualizes the<br />
relationship to the response variable one at a time and thus does not reveal the<br />
multivariate patterns between the variables simultaneously, which both <strong>for</strong> interpretation<br />
and prediction are vital <strong>for</strong> industrial <strong>processes</strong>.