Monitoring chemical processes for early fault detection using ... - Camo
Monitoring chemical processes for early fault detection using ... - Camo
Monitoring chemical processes for early fault detection using ... - Camo

You also want an ePaper? Increase the reach of your titles
YUMPU automatically turns print PDFs into web optimized ePapers that Google loves.
CAMO 08 <strong>Monitoring</strong> <strong>chemical</strong> <strong>processes</strong><br />
> Bring data to life > camo.com<br />
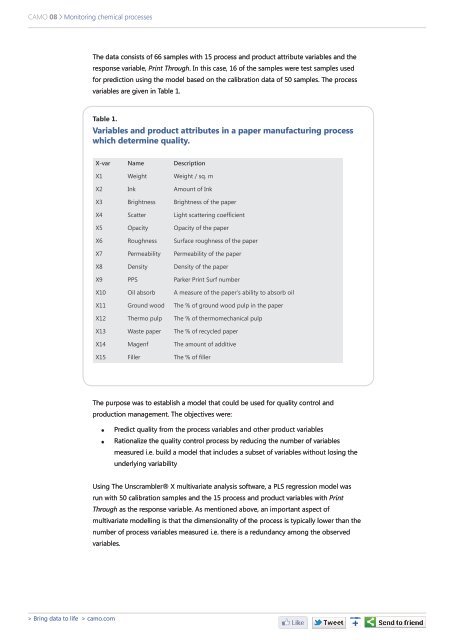
The data consists of 66 samples with 15 process and product attribute variables and the<br />
response variable, Print Through. In this case, 16 of the samples were test samples used<br />
<strong>for</strong> prediction <strong>using</strong> the model based on the calibration data of 50 samples. The process<br />
variables are given in Table 1.<br />
Table 1.<br />
Variables and product attributes in a paper manufacturing process<br />
which determine quality.<br />
X-var Name Description<br />
X1 Weight Weight / sq. m<br />
X2 Ink Amount of Ink<br />
X3 Brightness Brightness of the paper<br />
X4 Scatter Light scattering coefficient<br />
X5 Opacity Opacity of the paper<br />
X6 Roughness Surface roughness of the paper<br />
X7 Permeability Permeability of the paper<br />
X8 Density Density of the paper<br />
X9 PPS Parker Print Surf number<br />
X10 Oil absorb A measure of the paper’s ability to absorb oil<br />
X11 Ground wood The % of ground wood pulp in the paper<br />
X12 Thermo pulp The % of thermomechanical pulp<br />
X13 Waste paper The % of recycled paper<br />
X14 Magenf The amount of additive<br />
X15 Filler The % of filler<br />
The purpose was to establish a model that could be used <strong>for</strong> quality control and<br />
production management. The objectives were:<br />
Predict quality from the process variables and other product variables<br />
Rationalize the quality control process by reducing the number of variables<br />
measured i.e. build a model that includes a subset of variables without losing the<br />
underlying variability<br />
Using The Unscrambler® X multivariate analysis software, a PLS regression model was<br />
run with 50 calibration samples and the 15 process and product variables with Print<br />
Through as the response variable. As mentioned above, an important aspect of<br />
multivariate modelling is that the dimensionality of the process is typically lower than the<br />
number of process variables measured i.e. there is a redundancy among the observed<br />
variables.