

Notes to the Financial Statements Contd.... - Colombo Stock Exchange
Notes to the Financial Statements Contd.... - Colombo Stock Exchange
Notes to the Financial Statements Contd.... - Colombo Stock Exchange

Create successful ePaper yourself
Turn your PDF publications into a flip-book with our unique Google optimized e-Paper software.
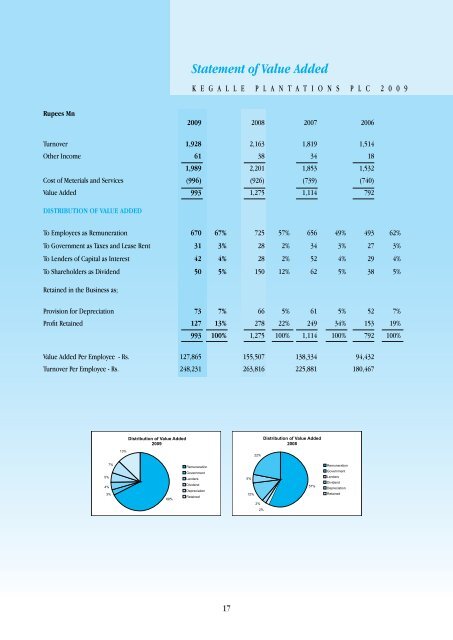
Rupees Mn<br />
Statement of Value Added<br />
K E G A L L E P L A N T A T I O N S P L C 2 0 0 9<br />
2009 2008 2007 2006<br />
Turnover 1,928 2,163 1,819 1,514<br />
O<strong>the</strong>r Income 61 38 34 18<br />
1,989 2,201 1,853 1,532<br />
Cost of Meterials and Services (996) (926) (739) (740)<br />
Value Added 993 1,275 1,114 792<br />
DISTRIBUTION OF VALUE ADDED<br />
To Employees as Remuneration 670 67% 725 57% 656 49% 493 62%<br />
To Government as Taxes and Lease Rent 31 3% 28 2% 34 3% 27 3%<br />
To Lenders of Capital as Interest 42 4% 28 2% 52 4% 29 4%<br />
To Shareholders as Dividend 50 5% 150 12% 62 5% 38 5%<br />
Retained in <strong>the</strong> Business as;<br />
Provision for Depreciation 73 7% 66 5% 61 5% 52 7%<br />
Profit Retained 127 13% 278 22% 249 34% 153 19%<br />
993 100% 1,275 100% 1,114 100% 792 100%<br />
Value Added Per Employee - Rs. 127,865 155,507 138,334 94,432<br />
Turnover Per Employee - Rs. 248,231 263,816 225,881 180,467<br />
5%<br />
4%<br />
7%<br />
3%<br />
13%<br />
Distribution of Value Added<br />
2009<br />
68%<br />
Remuneration<br />
Government<br />
Lenders<br />
Dividend<br />
Depreciation<br />
Retained<br />
17<br />
5%<br />
12%<br />
22%<br />
2%<br />
2%<br />
Distribution of Value Added<br />
2008<br />
57%<br />
Remuneration<br />
Government<br />
Lenders<br />
Dividend<br />
Depreciation<br />
Retained


