

Notes to the Financial Statements Contd.... - Colombo Stock Exchange
Notes to the Financial Statements Contd.... - Colombo Stock Exchange
Notes to the Financial Statements Contd.... - Colombo Stock Exchange

You also want an ePaper? Increase the reach of your titles
YUMPU automatically turns print PDFs into web optimized ePapers that Google loves.
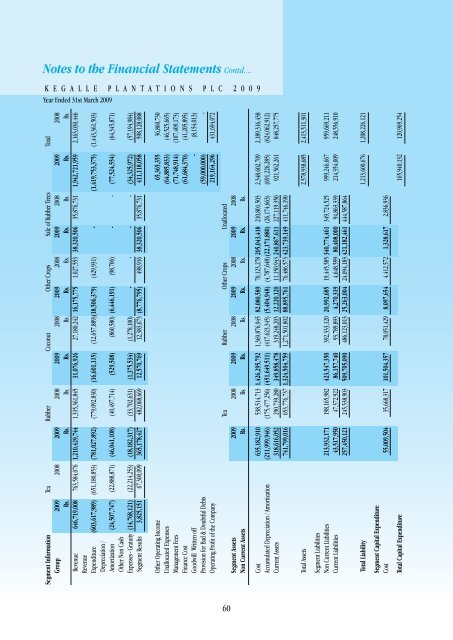
<strong>Notes</strong> <strong>to</strong> <strong>the</strong> <strong>Financial</strong> <strong>Statements</strong> <strong>Contd</strong>....<br />
K E G A L L E P L A N T A T I O N S P L C 2 0 0 9<br />
Year Ended 31st March 2009<br />
Segment Information Tea Rubber Coconut O<strong>the</strong>r Crops Sale of Rubber Trees Total<br />
Group 2009 2008 2009 2008 2009 2008 2009 2008 2009 2008 2009 2008<br />
Rs. Rs. Rs. Rs. Rs. Rs. Rs. Rs. Rs. Rs. Rs.<br />
Revenue 646,719,008 763,584,076 1,210,429,744 1,335,361,845 31,076,926 27,180,242 16,175,775 1,027,553 38,320,506 35,876,731 1,942,721,959 2,163,030,446<br />
Revenue<br />
Expenditure (603,617,989) (651,180,853) (781,027,892) (779,092,830) (16,601,115) (12,657,889) (18,506,379) (429,931) - (1,419,753,375) (1,443,361,503)<br />
Depreciation /<br />
Amortization (24,507,747) (22,888,871) (46,041,108) (40,497,714) (529,508) (860,580) (6,446,191) (98,706) - - (77,524,554) (64,345,871)<br />
O<strong>the</strong>r Non Cash<br />
Expenses - Gratuity (14,768,121) (22,214,253) (18,182,317) (33,702,631) (1,375,534) (1,278,100) - - - - (34,325,972) (57,194,984)<br />
Segment Results 3,825,151 67,300,099 365,178,427 482,068,669 12,570,769 12,383,673 (8,776,795) 498,916 38,320,506 35,876,731 411,118,058 598,128,088<br />
O<strong>the</strong>r Operating Income 65,365,355 36,860,730<br />
Unallocated Expenses (64,885,833) (46,525,665)<br />
Management Fees (71,748,914) (107,409,173)<br />
Finance Cost (61,684,370) (41,205,895)<br />
Goodwill Written off - (8,154,013)<br />
Provision for Bad & Doubtful Debts (59,000,000) -<br />
Operating Profit of <strong>the</strong> Company 219,164,296 431,694,072<br />
Tea Rubber O<strong>the</strong>r Crops Unallocated<br />
Segment Assets 2009 2008 2009 2008 2009 2008 2009 2008<br />
Non Current Assets Rs. Rs. Rs. Rs. Rs. Rs. Rs. Rs.<br />
60<br />
Cost 635,182,910 538,514,713 1,426,295,792 1,369,876,945 82,080,589 70,123,278 205,043,418 210,801,503 2,348,602,709 2,189,316,438<br />
Accumulated Depreciation / Amortization (211,999,946) (175,477,256) (451,649,511) (417,623,345) (5,404,948) (4,787,648) (22,171,880) (26,174,663) (691,226,285) (624,062,912)<br />
Current Assets 318,616,052 290,739,280 349,858,478 319,248,203 12,220,120 11,150,943 240,867,611 227,119,350 921,562,261 848,257,775<br />
741,799,016 653,776,737 1,324,504,759 1,271,501,802 88,895,761 76,486,573 423,739,149 411,746,190<br />
Total Assets 2,578,938,685 2,413,511,301<br />
Segment Liabilities<br />
Non Current Liabilities 213,932,171 198,165,982 423,547,350 392,333,120 20,992,685 19,445,585 340,774,461 349,724,525 999,246,667 959,669,211<br />
Current Liabilities 43,517,950 47,372,922 86,157,740 93,789,893 4,270,319 4,648,599 80,408,000 94,863,339 214,354,009 248,556,910<br />
257,450,121 245,538,903 509,705,090 486,123,013 25,263,004 24,094,183 421,182,461 444,587,864<br />
Total Liability 1,213,600,676 1,208,226,121<br />
Segment Capital Expenditure<br />
Cost 55,009,504 35,668,317 101,504,357 78,051,429 8,097,654 4,412,572 1,328,617 2,836,936<br />
Total Capital Expenditure 165,940,132 120,969,254


