Cost of solar energy generated using PV panels
Cost of solar energy generated using PV panels
Cost of solar energy generated using PV panels

Create successful ePaper yourself
Turn your PDF publications into a flip-book with our unique Google optimized e-Paper software.
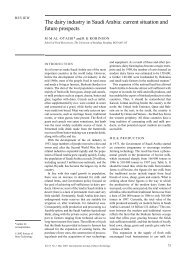
Renewable and Sustainable Energy Reviews<br />
11 (2007) 1843–1857<br />
<strong>Cost</strong> <strong>of</strong> <strong>solar</strong> <strong>energy</strong> <strong>generated</strong> <strong>using</strong> <strong>PV</strong> <strong>panels</strong><br />
Shafiqur Rehman a, , Maher A. Bader a , Said A. Al-Moallem b<br />
a Center for Engineering Research, Research Institute, King Fahd University <strong>of</strong> Petroleum and Minerals, KFUPM<br />
BOX # 767, Dhahran 31261, Saudi Arabia<br />
b Design & Materials Division, Distribution Engineering Department, Saudi Electricity Company, P.O. Box 5190,<br />
Dammam 31422, Saudi Arabia<br />
Abstract<br />
ARTICLE IN PRESS<br />
Received 23 October 2005; accepted 28 March 2006<br />
www.elsevier.com/locate/rser<br />
This paper utilizes monthly average daily global <strong>solar</strong> radiation and sunshine duration data to<br />
study the distribution <strong>of</strong> radiation and sunshine duration over Saudi Arabia. The analysis also<br />
includes the renewable <strong>energy</strong> production and economical evaluation <strong>of</strong> a 5 MW installed capacity<br />
photovoltaic based grid connected power plant for electricity generation. The study utilizes<br />
RetScreen s<strong>of</strong>tware for <strong>energy</strong> production and economical assessment. It is found that the global<br />
<strong>solar</strong> radiation varies between a minimum <strong>of</strong> 1.63 MWh/m 2 yr –1 at Tabuk and a maximum <strong>of</strong><br />
2.56 MWh/m 2 yr –1 at Bisha while the mean remained as 2.06 MWh/m 2 yr –1 . The duration <strong>of</strong> sunshine<br />
varied between 7.4 and 9.4 h with an overall mean <strong>of</strong> 8.89 h. The specific yield was found to vary from<br />
211.5 to 319.0 kWh/m 2 with a mean <strong>of</strong> 260.83 kWh/m 2 . The renewable <strong>energy</strong> produced each year<br />
from 5 MWp installed capacity plant was varied between 8196 and 12,360 MWh while the mean<br />
remained as 10,077 MWh/yr –1 . The economical indicators like internal rate <strong>of</strong> return, the simple<br />
payback period, the years to positive cash flows, the net present value, the annual life cycle savings,<br />
the pr<strong>of</strong>itability index and the cost <strong>of</strong> renewable <strong>energy</strong> production showed that Bishah was the best<br />
site for <strong>PV</strong> based power plant development and Tabuk the worst. From environmental point <strong>of</strong> view,<br />
it was found that on an average an approximate quantity <strong>of</strong> 8182 ton <strong>of</strong> green house gases can be<br />
avoided entering into the local atmosphere each year.<br />
r 2006 Elsevier Ltd. All rights reserved.<br />
Keywords: Solar radiation; Photovoltaic; Electricity; Solar <strong>energy</strong>; Renewable <strong>energy</strong>; Capacity; Sunshine<br />
duration<br />
Corresponding author. Tel.: +966 3 860 3802; fax: +966 3 860 3996.<br />
E-mail address: srehman@kfupm.edu.sa (S. Rehman).<br />
URL: http://staff.kfupm.edu.sa/ri/srehman.<br />
1364-0321/$ - see front matter r 2006 Elsevier Ltd. All rights reserved.<br />
doi:10.1016/j.rser.2006.03.005
1844<br />
Contents<br />
1. Introduction . . . . . . . . . . . . . . . . . . . . . . . . . . . . . . . . . . . . . . . . . . . . . . . . . . . . . . 1844<br />
2. <strong>PV</strong> system description . . . . . . . . . . . . . . . . . . . . . . . . . . . . . . . . . . . . . . . . . . . . . . . 1846<br />
3. Results and discussion . . . . . . . . . . . . . . . . . . . . . . . . . . . . . . . . . . . . . . . . . . . . . . . 1846<br />
3.1. Global <strong>solar</strong> radiation and sunshine duration behavior . . . . . . . . . . . . . . . . . . . 1847<br />
3.2. Renewable <strong>energy</strong> production . . . . . . . . . . . . . . . . . . . . . . . . . . . . . . . . . . . . . 1850<br />
3.3. Economical feasibility analysis. . . . . . . . . . . . . . . . . . . . . . . . . . . . . . . . . . . . . 1852<br />
3.4. Green house gases . . . . . . . . . . . . . . . . . . . . . . . . . . . . . . . . . . . . . . . . . . . . . 1854<br />
4. Conclusions. . . . . . . . . . . . . . . . . . . . . . . . . . . . . . . . . . . . . . . . . . . . . . . . . . . . . . . 1855<br />
Acknowledgment . . . . . . . . . . . . . . . . . . . . . . . . . . . . . . . . . . . . . . . . . . . . . . . . . . . . . . 1856<br />
References . . . . . . . . . . . . . . . . . . . . . . . . . . . . . . . . . . . . . . . . . . . . . . . . . . . . . . . . . . . 1856<br />
1. Introduction<br />
ARTICLE IN PRESS<br />
S. Rehman et al. / Renewable and Sustainable Energy Reviews 11 (2007) 1843–1857<br />
It is alarming to learn that some 1.7–2.0 billion people in the world, mostly in rural areas<br />
<strong>of</strong> developing countries, have no access to electricity and further 2 billion are severely<br />
undersupplied, according to UNEP report [1]. This imbalance in <strong>energy</strong> distribution is one<br />
<strong>of</strong> the most important causes <strong>of</strong> social evil in the society. The other factors <strong>of</strong> concern to<br />
environmentalist, scientists, meteorologists, engineers and to certain extent to governments<br />
as well include the increasing global population, exponentially growing need <strong>of</strong> <strong>energy</strong>,<br />
global climatic changes and fast depleting reserves <strong>of</strong> traditional sources <strong>of</strong> <strong>energy</strong>.<br />
According the UN-sponsored intergovernmental panel on climate change projects, the<br />
global temperature will rise by up to 5.8 1C over the next century. In the present scenario,<br />
many countries have realized the need for the reduction <strong>of</strong> green house gases emission to<br />
combat the adverse global climatic change. Hence to meet the power requirements <strong>of</strong> our<br />
future generations, new clean, renewable and sustainable sources <strong>of</strong> <strong>energy</strong> should be<br />
utilized, whenever and wherever possible.<br />
Photovoltaic (<strong>PV</strong>) technology is proven and easy to use <strong>solar</strong> <strong>of</strong> <strong>energy</strong> to generate<br />
electricity. It is being used globally to supply power to remote communities, utility<br />
peak load shaving, cathodic protection in pipelines, remotely located oil fields and<br />
gas oil separation plants (GOSPs), telecommunication towers, highway telephones<br />
and billboard, <strong>of</strong>f-grid cottage/s, resorts in desert areas, water pumping for community<br />
and irrigation, municipal park lighting, exterior home lighting and many other<br />
usage.<br />
The Kingdom <strong>of</strong> Saudi Arabia lies between latitudes 311N and 17.51N and longitudes<br />
501E and 36.61E. The land elevation varies between 0 and 2600 m above the mean sea level.<br />
Complex terrain is found in the southwest region <strong>of</strong> the Kingdom. The East and the West<br />
coasts <strong>of</strong> the Kingdom are located on the Arabian Gulf and Red Sea, respectively.<br />
Mainly two seasons, winter and summer, are observed during the year. The vast open land<br />
experiences high intensities <strong>of</strong> <strong>solar</strong> radiation and long hours <strong>of</strong> sunshine duration. There<br />
exist a network <strong>of</strong> 40 stations where global <strong>solar</strong> radiation and sunshine duration is being<br />
recorded since 1970 and large number, more than 40, <strong>of</strong> full meteorological data collection<br />
stations where all meteorological parameters are being recorded.<br />
For proper utilization <strong>of</strong> <strong>PV</strong> technology for <strong>energy</strong> generation, thorough and accurate<br />
knowledge <strong>of</strong> global <strong>solar</strong> radiation variation is required. In Saudi Arabia, several studies<br />
have been undertaken to understand the availability and variability <strong>of</strong> these radiation.
ARTICLE IN PRESS<br />
S. Rehman et al. / Renewable and Sustainable Energy Reviews 11 (2007) 1843–1857 1845<br />
Rehman and Halawani [2] reviewed around 100 published papers and reports and<br />
presented a summary on the work done on <strong>solar</strong> <strong>energy</strong> in Saudi Arabia. The study<br />
revealed that a good effort has been made in all directions right from measurement to<br />
theoretical modeling and prototype model development <strong>of</strong> <strong>solar</strong> devices. The study<br />
suggested that more efficient, organized and concentrated effort should be made in the<br />
direction <strong>of</strong> <strong>solar</strong> <strong>energy</strong> devices development and utilization in Saudi Arabia. Some <strong>of</strong><br />
the recent theoretical studies related to <strong>solar</strong> radiation prediction and understanding the<br />
behavior <strong>of</strong> the same include Refs. [3–8].<br />
Rehman and Ghori [9] used geostatistics along with available <strong>solar</strong> radiation to estimate<br />
the radiation at locations where it is not available with fairly good accuracy. Ali et al. [10]<br />
used <strong>PV</strong> modules to supply electricity to demonstrate the working <strong>of</strong> an automated<br />
irrigation system. In order to predict the global <strong>solar</strong> radiation in time domain, Mohandes<br />
et al. used artificial neural networks and showed that radiation data can be predicted in<br />
future time domain with the knowledge <strong>of</strong> available data with acceptable accuracy [11].<br />
Moreover, <strong>solar</strong> radiation data is also measured by the Research Institute at King Fahd<br />
University <strong>of</strong> Petroleum & Minerals, as reported by Bahel et al. [12], Kruss et al. [13],<br />
Bahel et al. [14], Srinivasan et al. [15], Bakhsh et al. [16], etc. Sabbagh et al. [17] presented<br />
an empirical formula obtained <strong>using</strong> the daily total <strong>solar</strong> radiation, sunshine duration,<br />
relative humidity, maximum temperature, latitude, altitude and the location <strong>of</strong> the place<br />
relative to the water surface. Saudi Arabia has invested a good amount <strong>of</strong> funds on the<br />
development <strong>of</strong> <strong>solar</strong> <strong>energy</strong> both on experimental and theoretical investigations. Solar<br />
<strong>energy</strong>-based appliances are being used at the Royal Commission <strong>of</strong> Yanbu and Jubail,<br />
Saudi Arabia. The world’s first and the largest grid-connected <strong>PV</strong> facility was developed<br />
and tested at Solar Village situated on the outskirt <strong>of</strong> Riyadh, the capital city <strong>of</strong> Saudi<br />
Arabia [18].<br />
Elsewhere, e.g., Libya is one <strong>of</strong> the largest oil exporting country and possesses<br />
large reserves <strong>of</strong> fossil fuel, however, it is <strong>using</strong> renewable sources <strong>of</strong> <strong>energy</strong> like<br />
wind and <strong>solar</strong> and saving its oil reserves for future use or to generate more revenues<br />
[19]. In Libya, <strong>PV</strong> technology is being used since 1976 for cathodic protection in<br />
oil pipe lines between Dahra oil field and Sedra Port, communication towers, water<br />
pumping for irrigation at El-Agailat, street and historical site lighting, etc. [19]. The<br />
total <strong>PV</strong>-installed capacity in Libya, as <strong>of</strong> May 2003, is 633.88 kWp. Furthermore,<br />
according to El Hori [19], Libya is planning to build a grid connected <strong>PV</strong><br />
power plant with 1 MW installed capacity in the near future. <strong>PV</strong> is also being used in<br />
Jordan to pump water and in lighting the streets, schools and other governmental<br />
institutions located in remote areas. According to Hrayshat and Al-Soud [20], the total <strong>PV</strong>installed<br />
capacity in Jordan is 82 kWp generating a total <strong>of</strong> 182.5 MWh <strong>of</strong> electricity each<br />
year.<br />
In order to study the <strong>energy</strong> production, a <strong>PV</strong> system <strong>of</strong> 5 MWp installed capacity<br />
was considered. Monthly mean values <strong>of</strong> temperature and global <strong>solar</strong> radiation on<br />
horizontal surface along with latitude <strong>of</strong> the site were used as input in RetScreen<br />
s<strong>of</strong>tware [21] to get the specific yield, renewable <strong>energy</strong> produced and green house gases<br />
avoided entering into the atmosphere as a result <strong>of</strong> clean <strong>energy</strong> utilization. The s<strong>of</strong>tware<br />
also performs the economical analysis <strong>of</strong> the grid connected <strong>PV</strong> power plant in terms <strong>of</strong><br />
internal rate <strong>of</strong> return (IRR), simple pay back period (SPP), years to positive cash<br />
flow (YPCF), net present value (N<strong>PV</strong>), annual life cycle savings (ALCS) and pr<strong>of</strong>itability<br />
index (PI).
1846<br />
Table 1<br />
Photovoltaic module specifications<br />
2. <strong>PV</strong> system description<br />
The <strong>solar</strong> module or the <strong>PV</strong> part is the heart <strong>of</strong> the whole <strong>PV</strong> system. The <strong>solar</strong> module is<br />
composed <strong>of</strong> several individual <strong>PV</strong> cells connected in series or parallel. Primarily, the<br />
number <strong>of</strong> individual cells within a module and the arrangement <strong>of</strong> these cells in the<br />
module influence the <strong>energy</strong> produced by a <strong>PV</strong> module. The cells can be arranged in a<br />
module to produce a specific voltage and current to meet the particular electrical<br />
requirements. Similarly, the <strong>PV</strong> modules can be arranged to form a <strong>solar</strong> array to produce<br />
a specific voltage and the current. In the present study we have used the <strong>PV</strong> Module <strong>of</strong><br />
90 W peak capacity comprised <strong>of</strong> mono-Si <strong>solar</strong> cells from BP Solar/Solarex. The<br />
specifications <strong>of</strong> the module are summarized in Table 1.<br />
The study assumes a grid connected power plant <strong>of</strong> 5 MW installed capacity comprised<br />
<strong>of</strong> 55,556 modules described in Table 1, for all the sites considered in this paper. These<br />
arrays were arranged in five units consisting <strong>of</strong> 11,111 modules each. The total <strong>PV</strong> module<br />
area covered by each unit was found to be approximately 7000 m 2 . So for the whole plant<br />
the total <strong>PV</strong> modules area reached to 35,000 m 2 . Inverters with a total rated capacity <strong>of</strong><br />
4750 kW with 95% efficiency were considered to convert DC into AC to directly feed the<br />
grid. The <strong>PV</strong> modules were assumed to be fixed, i.e. no <strong>solar</strong> tracking, and inclined at an<br />
angle equal to the site latitude and South facing. The azimuth angle was taken as zero for<br />
all the sites.<br />
3. Results and discussion<br />
ARTICLE IN PRESS<br />
S. Rehman et al. / Renewable and Sustainable Energy Reviews 11 (2007) 1843–1857<br />
Item description Item specification<br />
Voltage [@ peak power] (V) 18.5<br />
Current [@ peak power] (A) 4.86<br />
Voltage [open circuit] (V) 22.3<br />
Current [short circuit] (A) 5.2<br />
Frame area (m 2 ) 0.63<br />
Mounting dimensions thickness (mm) 43.5<br />
Width (mm) 530<br />
Length (mm) 1188<br />
Weight (kg) 7.5<br />
Certification CSA, CEC<br />
To study the behavior <strong>of</strong> global <strong>solar</strong> radiation and sunshine duration over Saudi Arabia,<br />
the long-term overall mean values were obtained <strong>using</strong> the long-term site averages.<br />
Similarly, overall seasonal mean values <strong>of</strong> the global <strong>solar</strong> radiation and sunshine<br />
duration were obtained <strong>using</strong> monthly mean values from all the sites. The renewable<br />
<strong>energy</strong> fed to the grid at each site was obtained <strong>using</strong> RetScreen s<strong>of</strong>tware. The detailed<br />
discussion on global <strong>solar</strong> radiation and renewable <strong>energy</strong> delivered is given in the<br />
forthcoming sub-sections.
ARTICLE IN PRESS<br />
S. Rehman et al. / Renewable and Sustainable Energy Reviews 11 (2007) 1843–1857 1847<br />
3.1. Global <strong>solar</strong> radiation and sunshine duration behavior<br />
It was found that Saudi Arabia experiences, on an average, more than 2.0 MWh/m 2 <strong>of</strong><br />
global <strong>solar</strong> radiation each year on horizontal surface. The long-term mean values <strong>of</strong><br />
sunshine duration and global <strong>solar</strong> radiation on horizontal surfaces are summarized in<br />
Table 2. Depending on geographical location, the global <strong>solar</strong> radiation varies between a<br />
Table 2<br />
Long-term daily mean values <strong>of</strong> sunshine duration and global <strong>solar</strong> radiation on horizontal surface<br />
Stn # City Lat (deg.) Lon (deg.) Alt (m) S (h) H (MWh/m 2 yr)<br />
1 Qurayyat 31.33 37.35 2 9.0 2.03<br />
2 Tabarjal 30.52 38.38 3 9.0 1.72<br />
3 Sakaka 29.97 40.20 574 9.0 1.94<br />
4 Tabuk 28.38 36.58 773 9.1 1.64<br />
5 Tayma 27.63 38.48 820 9.2 2.04<br />
6 Hail 27.47 41.63 1010 9.4 1.91<br />
7 Sarrar 26.98 48.38 75 8.7 1.66<br />
8 Al-Ula 26.62 37.85 681 9.1 2.12<br />
9 Qatif 26.55 50.00 8 8.4 1.73<br />
10 Maaqala 26.37 47.37 450 8.9 1.78<br />
11 Zilfi 26.30 44.80 605 8.9 2.04<br />
12 Unayzah 26.07 43.98 724 9.3 2.00<br />
13 Uqtalas-Suqur 25.83 42.18 740 9.1 2.23<br />
14 Hutatsudair 25.53 45.62 665 9.0 2.15<br />
15 Al-H<strong>of</strong>uf 25.50 49.57 160 8.7 2.07<br />
16 Shaqra 25.25 45.25 730 9.2 2.21<br />
17 Hanakiya 24.85 40.50 840 9.1 2.21<br />
18 Riyadh 24.57 46.72 564 9.2 1.87<br />
19 Madina 24.52 39.58 590 9.1 2.32<br />
20 Dawdami 24.48 44.37 0 8.8 2.17<br />
21 Derab 24.42 46.57 0 8.7 2.26<br />
22 Al-Kharj 24.17 47.40 430 9.1 2.03<br />
23 Harad 24.07 49.02 300 9.0 1.71<br />
24 Yabrin 23.32 48.95 200 9.1 2.06<br />
25 Al-Aflat 22.28 46.73 539 9.0 2.19<br />
26 Khulays 22.13 39.43 60 8.9 2.18<br />
27 Sayl Kabir 21.62 40.42 1230 8.9 2.46<br />
28 Turbah 21.40 40.45 1130 9.0 2.09<br />
29 Taif 21.23 40.35 1530 8.9 1.98<br />
30 Sulayyil 20.47 45.57 600 9.0 2.40<br />
31 Bisha 20.02 42.60 1020 9.2 2.56<br />
32 Heifa 19.87 42.53 1090 9.1 2.22<br />
33 Juarshy 19.85 41.57 2040 8.5 1.98<br />
34 Modaylif 19.53 41.05 53 8.5 2.32<br />
35 Al-Numas 19.10 42.15 2600 7.4 2.21<br />
36 Kwash 19.00 41.88 350 8.5 1.70<br />
37 Kiyad 18.73 41.40 30 8.4 1.87<br />
38 Sirr-Lasan 18.25 42.60 2100 8.7 1.84<br />
39 Abha 18.22 42.48 2200 8.7 2.13<br />
40 Najran 17.55 44.23 1250 9.1 2.53<br />
41 Sabya 17.17 42.62 40 8.5 1.83
1848<br />
ARTICLE IN PRESS<br />
S. Rehman et al. / Renewable and Sustainable Energy Reviews 11 (2007) 1843–1857<br />
minimum <strong>of</strong> 1.63 MWh/m 2 yr –1 at Tabuk and a maximum <strong>of</strong> 2.56 MWh/m 2 yr –1 at Bisha,<br />
as seen from Table 2. It is evident from this table, that higher values <strong>of</strong> global <strong>solar</strong><br />
radiation are observed in Nejran, Bisha, Al-Sulayyil, etc. area in the southern most part <strong>of</strong><br />
the Kingdom and relatively lower values in the northern region like Hail, Sakaka,<br />
Tabarjal, etc. The lower values are much higher than those in other western and European<br />
countries and hence <strong>of</strong>fer an opportunity to harness the power <strong>of</strong> the sun to generate<br />
electricity. The eastern and the western parts <strong>of</strong> Saudi Arabia also experience higher<br />
intensities <strong>of</strong> global <strong>solar</strong> radiations and hence should be explored.<br />
The long-term seasonal variation <strong>of</strong> global <strong>solar</strong> radiation at 41 locations is shown in<br />
Fig. 1. From this figure, it is evident that higher values <strong>of</strong> radiation were observed during<br />
Summer months and lower in the Winter months. The seasonal variation <strong>of</strong> global <strong>solar</strong><br />
radiation obtained <strong>using</strong> monthly mean values from 41 locations is depicted in Fig. 2.<br />
Lower values <strong>of</strong> radiations are noticed in Winter months and higher in Summer months. A<br />
maximum value <strong>of</strong> 7.09 kWh/m 2 day –1 is found in the month <strong>of</strong> June while the minimum <strong>of</strong><br />
3.82 kWh/m 2 day –1 in December. As observed from Figs. 1 and 2, the seasonal pattern <strong>of</strong><br />
<strong>solar</strong> radiation matches with electrical load pattern prevalent in Saudi Arabia. Hence, it<br />
will prove to be advantageous to use <strong>PV</strong> technology to generate electricity for grid<br />
connected applications to meet the peak load requirements.<br />
The long-term monthly mean values <strong>of</strong> sunshine duration for individual <strong>solar</strong> radiation<br />
stations are shown in Fig. 3. It is evident from the figure that the sunshine duration is<br />
Fig. 1. Seasonal variation <strong>of</strong> global <strong>solar</strong> radiation for each station.
Global Solar Radiation (kWh/m 2 /Day)<br />
7.5<br />
7.0<br />
6.5<br />
6.0<br />
5.5<br />
5.0<br />
4.5<br />
4.0<br />
3.5<br />
3.0<br />
2.5<br />
2.0<br />
1.5<br />
1.0<br />
0.5<br />
0.0<br />
ARTICLE IN PRESS<br />
S. Rehman et al. / Renewable and Sustainable Energy Reviews 11 (2007) 1843–1857 1849<br />
4.05<br />
4.96<br />
5.70<br />
6.26<br />
6.68<br />
7.09<br />
Jan Feb Mar Apr May Jun Jul Aug Sep Oct Nov Dec<br />
Months<br />
6.82<br />
6.50<br />
6.01<br />
5.32<br />
Fig. 2. Seasonal variation <strong>of</strong> global <strong>solar</strong> radiation over Saudi Arabia.<br />
Fig. 3. Seasonal variation <strong>of</strong> available sunshine duration for each station.<br />
4.44<br />
3.82
1850<br />
Sun Shine Duration (Hours)<br />
12<br />
10<br />
8<br />
6<br />
4<br />
2<br />
0<br />
7.26<br />
8.06<br />
8.42<br />
longer in Summer months and shorter in Winter months at all the locations. Fig. 4 shows<br />
the seasonal variation <strong>of</strong> sunshine duration values over Saudi Arabia obtained by<br />
averaging monthly mean values <strong>of</strong> sunshine duration from 41 locations. Longer durations<br />
<strong>of</strong> bright sunshine are observed in summertime compared to that in wintertime, as<br />
observed from Fig. 4. The overall mean value <strong>of</strong> sunshine duration, obtained by <strong>using</strong> all<br />
the values from 41 locations, was found to be 8.89 h each day and approximately 3245 h<br />
each year when multiplied by number <strong>of</strong> days in the year. As seen from Table 2, the<br />
minimum and the maximum duration <strong>of</strong> sunshine varied between 7.4 and 9.4 h<br />
corresponding to An-Numas (latitude ¼ 19.10, longitude 42.15 and altitude ¼ 2600 m<br />
above mean sea level) and Hail (latitude ¼ 27.47, longitude 41.63 and altitude ¼ 1010 m<br />
above mean sea level) regions, respectively. Higher values <strong>of</strong> sunshine duration are noticed<br />
in the northern region while relatively smaller in the southern region.<br />
3.2. Renewable <strong>energy</strong> production<br />
ARTICLE IN PRESS<br />
S. Rehman et al. / Renewable and Sustainable Energy Reviews 11 (2007) 1843–1857<br />
8.84<br />
9.68<br />
10.15 10.09<br />
Jan Feb Mar Apr May Jun Jul Aug Sep Oct Nov Dec<br />
Months<br />
The monthly mean values <strong>of</strong> global <strong>solar</strong> radiation on horizontal surface, the monthly<br />
mean temperature, and the site latitude were used as input into the RetScreen s<strong>of</strong>tware to<br />
obtain the specific <strong>energy</strong> yield, the renewable <strong>energy</strong> produced and the green house gases<br />
that could be avoided by the usage <strong>of</strong> the <strong>solar</strong> <strong>energy</strong> from a proposed <strong>PV</strong> based power<br />
plant <strong>of</strong> 5 MW installed capacity. Various other parameters like <strong>PV</strong> module specifications,<br />
inverter specification, etc., given in Table 1, were also used as input to the s<strong>of</strong>tware. The<br />
model calculates the specific yield, in kWh/m 2 , by dividing the renewable <strong>energy</strong> delivered<br />
by the <strong>PV</strong> system over 1 yr by the <strong>PV</strong> array area. The values <strong>of</strong> specific <strong>energy</strong> yield<br />
obtained for different locations are shown in Fig. 5. The maximum specific yield <strong>of</strong><br />
319.0 kWh/m 2 was obtained at Bisha while the minimum <strong>of</strong> 211.5 kWh/m 2 at Tabuk. The<br />
overall mean specific yield was observed to be 261 kWh/m 2 .<br />
9.79<br />
9.24 9.18<br />
Fig. 4. Seasonal variation <strong>of</strong> sunshine duration over Saudi Arabia.<br />
8.39<br />
7.44
The model calculates the annual renewable <strong>energy</strong> delivered (MWh), which is the<br />
amount <strong>of</strong> equivalent DC electrical <strong>energy</strong> actually delivered by the <strong>PV</strong> system to the load,<br />
or the utility in the case <strong>of</strong> an on-grid system. The total renewable <strong>energy</strong> produced in a<br />
year from 5 MW <strong>PV</strong> power plants at all the 41 locations is shown in Fig. 6. The maximum<br />
annual <strong>energy</strong> production <strong>of</strong> 12.4 GWh was obtained from Bishah power plant while the<br />
minimum <strong>of</strong> 8.2 GWh from Tabuk and Sarrar power plants. The respective power plant<br />
efficiencies were 28.3% and 18.7%. On an average, 10.0 GWh <strong>of</strong> electricity with an<br />
Fig. 6. Renewable <strong>energy</strong> production for different locations.<br />
Locations<br />
Qurayyat<br />
Tabarjal<br />
Sakakah<br />
Tabuk<br />
Tayma<br />
Hail<br />
Sarrar<br />
Al-Ula<br />
Qatif<br />
Maqala<br />
Zilfi<br />
Unayzah<br />
Suqur<br />
Hutat Sudair<br />
Al-H<strong>of</strong>uf<br />
Shaqra<br />
Hanakiyah<br />
Riyadh<br />
Madinah<br />
Dawadimi<br />
Derab<br />
Al-Kharj<br />
Harad<br />
Yabrin<br />
Al-Aflat<br />
Kulays<br />
SaylKabir<br />
Turabah<br />
Taif<br />
Sulayyil<br />
Bishah<br />
Heifa<br />
Baljarshi<br />
Mudaylif<br />
Namas<br />
Khosh<br />
Kiyad<br />
Sirr Lasan<br />
Abha<br />
Najran<br />
Sabya<br />
0<br />
RE Production (GWh/Year)<br />
3<br />
6<br />
9<br />
12<br />
10.3<br />
8.5<br />
9.8<br />
8.2<br />
10.2<br />
9.5<br />
8.2<br />
10.6<br />
8.4<br />
8.6<br />
10.1<br />
9.9<br />
11.0<br />
10.7<br />
10.3<br />
11.0<br />
10.9<br />
9.3<br />
11.4<br />
10.6<br />
11.2<br />
9.9<br />
8.4<br />
10.1<br />
10.7<br />
10.7<br />
12.0<br />
10.0<br />
9.7<br />
10.6<br />
12.4<br />
10.8<br />
9.6<br />
11.3<br />
10.5<br />
8.3<br />
9.1<br />
9.0<br />
10.4<br />
12.2<br />
8.8<br />
15<br />
Fig. 5. Variation <strong>of</strong> specific yield for with locations.<br />
Locations<br />
Qurayyat<br />
Tabarjal<br />
Sakakah<br />
Tabuk<br />
Tayma<br />
Hail<br />
Sarrar<br />
Al-Ula<br />
Qatif<br />
Maqala<br />
Zilfi<br />
Unayzah<br />
Suqur<br />
Hutat Sudair<br />
Al-H<strong>of</strong>uf<br />
Shaqra<br />
Hanakiyah<br />
Riyadh<br />
Madinah<br />
Dawadimi<br />
Derab<br />
Al-Kharj<br />
Harad<br />
Yabrin<br />
Al-Aflat<br />
Kulays<br />
SaylKabir<br />
Turabah<br />
Taif<br />
Sulayyil<br />
Bishah<br />
Heifa<br />
Baljarshi<br />
Mudaylif<br />
Namas<br />
Khosh<br />
Kiyad<br />
Sirr Lasan<br />
Abha<br />
Najran<br />
Sabya<br />
0<br />
50<br />
Specific Yield (kWh/m 2 )<br />
100<br />
150<br />
200<br />
250<br />
300<br />
350<br />
267.0<br />
218.3<br />
253.2<br />
211.5<br />
263.2<br />
246.4<br />
212.7<br />
272.6<br />
215.6<br />
222.6<br />
261.6<br />
254.4<br />
283.9<br />
275.3<br />
264.7<br />
282.9<br />
280.8<br />
240.9<br />
294.7<br />
273.9<br />
288.0<br />
256.4<br />
217.5<br />
260.6<br />
277.2<br />
274.9<br />
310.8<br />
259.3<br />
251.4<br />
303.6<br />
319.0<br />
277.6<br />
246.6<br />
290.5<br />
271.6<br />
214.3<br />
235.6<br />
232.8<br />
267.4<br />
315.2<br />
227.7<br />
400<br />
S. Rehman et al. / Renewable and Sustainable Energy Reviews 11 (2007) 1843–1857 1851<br />
ARTICLE IN PRESS
1852<br />
approximate efficiency <strong>of</strong> 23% can be produced each year in any part <strong>of</strong> Saudi Arabia<br />
from a <strong>PV</strong> power plant <strong>of</strong> 5 MW installed capacity.<br />
3.3. Economical feasibility analysis<br />
ARTICLE IN PRESS<br />
S. Rehman et al. / Renewable and Sustainable Energy Reviews 11 (2007) 1843–1857<br />
The RetScreen s<strong>of</strong>tware, capable <strong>of</strong> performing the economical feasibility analysis <strong>of</strong><br />
hybrid, stand alone and grid connected renewable <strong>energy</strong> systems, was used to find out the<br />
IRR, SPP, YPCF, ALCS, N<strong>PV</strong>, PI and the cost <strong>of</strong> <strong>energy</strong> (COE) per kWh <strong>of</strong> electricity<br />
produced. The input economical parameters such as <strong>energy</strong> cost escalation rate, inflation<br />
rate, etc are summarized in Table 3. The costs <strong>of</strong> major elements <strong>of</strong> the <strong>PV</strong> power plant,<br />
taken from the literature, are given in Table 4. The major chunk <strong>of</strong> the fund about 70%<br />
accounts for renewable <strong>energy</strong> equipment such as <strong>PV</strong> <strong>panels</strong>, its transportation and<br />
installation, etc. The other major head where the money consumed is the balance <strong>of</strong> plant<br />
cost that accounts for about 28% <strong>of</strong> the total costs. All <strong>of</strong> these costs and interest rates<br />
given in Tables 3 and 4 were used as input to the RetScreen s<strong>of</strong>tware for economical<br />
feasibility analysis <strong>of</strong> all the sites.<br />
The development <strong>of</strong> a <strong>PV</strong> project would be acceptable if IRR is equal to or greater than<br />
the required rate <strong>of</strong> return. It is calculated by finding the discount rate that causes the net<br />
present value <strong>of</strong> the project to be equal to zero. The IRR calculated for all the locations is<br />
shown in Fig. 7b. As seen from this figure, the IRR increases directly with the increase in<br />
global <strong>solar</strong> radiation value, Fig. 7a. The maximum IRR <strong>of</strong> 16.7% is found at Bisha while<br />
the minimum <strong>of</strong> 10.7% at Tabuk. In Saudi Arabia, <strong>using</strong> assumed input data given Tables<br />
3and4an IRR <strong>of</strong> 13.5% can be achieved at any location.<br />
Table 3<br />
Summary <strong>of</strong> various interest rates used in the economical feasibility study<br />
Item description Value<br />
Energy cost escalation rate 4%<br />
Inflation rate 2.5%<br />
Discount rate 5%<br />
Avoided cost <strong>of</strong> <strong>energy</strong> 0.5 $/kWh<br />
Project life 25 yr<br />
Table 4<br />
Initial cost <strong>of</strong> <strong>PV</strong> power plant<br />
Item description <strong>Cost</strong> (US $) % Of total cost<br />
Feasibility study 80,000 0.2%<br />
Development cost 70,000 0.2%<br />
Engineering cost 62,500 0.2%<br />
RE equipment 27,750,000 69.6%<br />
Balance <strong>of</strong> plant cost 11,094,003 27.8%<br />
Miscellaneous 806,130 2%<br />
Total initial cost 39,864,634 100%<br />
Inverter replacement cost 1,000,000 Every 5 yr<br />
Operation and maintenance 334,500 Annual
GSR (MWh/m 2 /year)<br />
IRR (%)<br />
SPP & YPCF (Years)<br />
N<strong>PV</strong> (Million, $)<br />
PI<br />
2.6<br />
2.4<br />
2.2<br />
2.0<br />
1.8<br />
1.6<br />
18<br />
16<br />
14<br />
12<br />
10<br />
12<br />
11<br />
10<br />
9<br />
8<br />
7<br />
6<br />
80<br />
70<br />
60<br />
50<br />
40<br />
30<br />
2.0<br />
1.8<br />
1.6<br />
1.4<br />
1.2<br />
1.0<br />
0.8<br />
0.6<br />
ARTICLE IN PRESS<br />
S. Rehman et al. / Renewable and Sustainable Energy Reviews 11 (2007) 1843–1857 1853<br />
(a)<br />
(b)<br />
(c)<br />
(d)<br />
(e)<br />
Net Present Value<br />
Annual Life Cycle Savings<br />
Simple Payback Period<br />
Years to Positive Cash Flow<br />
Tabuk<br />
Sarrar<br />
Khosh<br />
Harad<br />
Tabarjal<br />
Qatif<br />
Maqala<br />
Sabya<br />
Sirr Lasan<br />
Kiyad<br />
Riyadh<br />
Hail<br />
Sakakah<br />
Taif<br />
Baljarshi<br />
Unayzah<br />
Al-Kharj<br />
Qurayyat<br />
Tayma<br />
Zilfi<br />
Yabrin<br />
Al-H<strong>of</strong>uf<br />
Turabah<br />
Al-Ula<br />
Abha<br />
Hutat Sudair<br />
Dawadimi<br />
Kulays<br />
Al-Aflat<br />
Hanakiyah<br />
Shaqra<br />
Namas<br />
Heifa<br />
Suqur<br />
Derab<br />
Madinah<br />
Mudaylif<br />
Sulayyil<br />
SaylKabir<br />
Najran<br />
Bishah<br />
Solar Radiation Collection Stations<br />
Fig. 7. Variation <strong>of</strong> economical indicators with locations.<br />
The model calculates the SPP, which represents the length <strong>of</strong> time that it takes for an<br />
investment project to recoup its own initial cost, out <strong>of</strong> the cash receipts it generates. The<br />
model uses the total initial costs, the total annual costs (excluding debt payments) and the<br />
total annual savings, in order to calculate the SPP. The model uses the year number and<br />
the cumulative after-tax cash flows in order to calculate the YPCF. The number <strong>of</strong> YPCF<br />
represents the length <strong>of</strong> time that it takes for the owner <strong>of</strong> such a project to recoup its own<br />
6<br />
5<br />
4<br />
3<br />
2<br />
ALCS (Million, $)
1854<br />
COE (Cents/kWh)<br />
33<br />
30<br />
27<br />
24<br />
21<br />
18<br />
15<br />
12<br />
9<br />
6<br />
3<br />
0<br />
30<br />
30<br />
30<br />
29<br />
29<br />
30<br />
29<br />
initial investment out <strong>of</strong> the project cash flows <strong>generated</strong>. Both <strong>of</strong> these parameters i.e. SPP<br />
and YPCF are shown in Fig. 7c for all the locations. Minimum values <strong>of</strong> both SPP and<br />
YPCF <strong>of</strong> 7.6 and 6.7 yr, respectively, were found for Bisha. The corresponding maximum<br />
values <strong>of</strong> 11.9 and 10 yr were found at Tabuk. On an average, the SPP and YPCF can be<br />
achieved in 9.6 and 8.2 yr at any location, respectively.<br />
In N<strong>PV</strong> analysis, the present value <strong>of</strong> all cash inflows is compared with the present value<br />
<strong>of</strong> all cash outflows associated with an investment project. The difference between the<br />
present values <strong>of</strong> these cash flows, called the N<strong>PV</strong>, determines whether the project is<br />
generally an acceptable investment or not. Positive N<strong>PV</strong> values are an indicator <strong>of</strong> a<br />
potentially feasible project. The PI is calculated as the ratio <strong>of</strong> the N<strong>PV</strong> over the project<br />
equity. Positive ratios are indicative <strong>of</strong> pr<strong>of</strong>itable projects. The ALCS is the levelized<br />
nominal yearly savings having exactly the same life and net present value as the project.<br />
The ALCS are calculated <strong>using</strong> the net present value, the discount rate and the project life.<br />
The N<strong>PV</strong> and ALCS are shown in Fig. 7d while PI in Fig. 7e.<br />
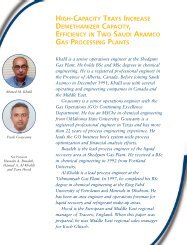
The model calculates the renewable <strong>energy</strong> production cost or COE. It is defined as the<br />
avoided cost <strong>of</strong> <strong>energy</strong> required for the project to break-even. The COE is calculated<br />
assuming that all financial parameters other than the avoided cost <strong>of</strong> <strong>energy</strong> are kept<br />
constant. The COE was calculated for all the location <strong>using</strong> RetScreen model and is shown<br />
in Fig. 8. The COE varies between a minimum <strong>of</strong> 20 and a maximum <strong>of</strong> 30 cent/kWh, as<br />
seen from Fig. 8. On an average, in Saudi Arabia, each kWh <strong>of</strong> renewable <strong>energy</strong> can be<br />
produced at a cost <strong>of</strong> 25 cent.<br />
3.4. Green house gases<br />
ARTICLE IN PRESS<br />
S. Rehman et al. / Renewable and Sustainable Energy Reviews 11 (2007) 1843–1857<br />
28<br />
28<br />
27<br />
27<br />
26<br />
25<br />
25<br />
26<br />
25<br />
25<br />
29<br />
24<br />
25<br />
25<br />
24<br />
25<br />
24<br />
24<br />
23<br />
23<br />
23<br />
23<br />
23<br />
23<br />
24<br />
23<br />
23<br />
Locations<br />
22<br />
22<br />
22<br />
21<br />
21<br />
20<br />
20<br />
Tabuk<br />
Sarrar<br />
Khosh<br />
Harad<br />
Tabarjal<br />
Qatif<br />
Maqala<br />
Sabya<br />
Sirr Lasan<br />
Kiyad<br />
Riyadh<br />
Hail<br />
Sakakah<br />
Taif<br />
Baljarshi<br />
Unayzah<br />
Al-Kharj<br />
Qurayyat<br />
Tayma<br />
Zilfi<br />
Yabrin<br />
Al-H<strong>of</strong>uf<br />
Turabah<br />
Al-Ula<br />
Abha<br />
Hutat Sudair<br />
Dawadimi<br />
Kulays<br />
Al-Aflat<br />
Hanakiyah<br />
Shaqra<br />
Namas<br />
Heifa<br />
Suqur<br />
Derab<br />
Madinah<br />
Mudaylif<br />
Sulayyil<br />
SaylKabir<br />
Najran<br />
Bishah<br />
Fig. 8. <strong>Cost</strong> <strong>of</strong> <strong>energy</strong> (COE).<br />
The amount <strong>of</strong> green house gases which could be avoided as a result <strong>of</strong> usage <strong>of</strong> 5 MW<br />
power plants at these locations is plotted in Fig. 9. From this analysis it was observed<br />
that a total <strong>of</strong> 335,455 ton <strong>of</strong> green house gases could be avoided entering into local
GHG Reduction (Tons/Year)<br />
12000<br />
10000<br />
8000<br />
6000<br />
4000<br />
2000<br />
0<br />
8374<br />
atmosphere each year if 41 power plants each <strong>of</strong> 5 MW capacity are installed in Saudi<br />
Arabia. On an average 914 ton <strong>of</strong> green house gases each year can be avoided from<br />
entering into atmosphere from any location in the Kingdom from a 5 MW capacity <strong>PV</strong><br />
power plant.<br />
4. Conclusions<br />
ARTICLE IN PRESS<br />
S. Rehman et al. / Renewable and Sustainable Energy Reviews 11 (2007) 1843–1857 1855<br />
6847<br />
7944<br />
6636<br />
8258<br />
7728<br />
6673<br />
8552<br />
6762<br />
6983<br />
8207<br />
7979<br />
8906<br />
8635<br />
8302<br />
8874<br />
8810<br />
7558<br />
9234<br />
8592<br />
9033<br />
8044<br />
6823<br />
8174<br />
8695<br />
8623<br />
9748<br />
8134<br />
7887<br />
9524<br />
10007<br />
8709<br />
7737<br />
9113<br />
8518<br />
6721<br />
7390<br />
7304<br />
8388<br />
9887<br />
7142<br />
Qurayyat<br />
Tabarjal<br />
Sakakah<br />
Tabuk<br />
Tayma<br />
Hail<br />
Sarrar<br />
Al-Ula<br />
Qatif<br />
Maqala<br />
Zilfi<br />
Unayzah<br />
Suqur<br />
Hutat Sudair<br />
Al-H<strong>of</strong>uf<br />
Shaqra<br />
Hanakiyah<br />
Riyadh<br />
Madinah<br />
Dawadimi<br />
Derab<br />
Al-Kharj<br />
Harad<br />
Yabrin<br />
Al-Aflat<br />
Kulays<br />
Locations<br />
The study throws light on the following points:<br />
The global <strong>solar</strong> radiation varies between a minimum <strong>of</strong> 1.63 MWh/m 2 yr –1 at Tabuk<br />
and a maximum <strong>of</strong> 2.56 MWh/m 2 yr –1 at Bisha while mean value remained as<br />
2.06 MWh/m 2 yr –1 .<br />
The duration <strong>of</strong> sunshine varied between 7.4 and 9.4 h with an overall mean <strong>of</strong> 8.89 h or<br />
about a total <strong>of</strong> 3245 h in a year.<br />
The specific yield was found to vary from 211.5 to 319.0 kWh/m 2 with a mean <strong>of</strong><br />
260.83 kWh/m 2 .<br />
The renewable <strong>energy</strong> produced each year from 5 MWp installed capacity plant<br />
was found to vary between 8196 and 12,360 MWh while the mean remained as<br />
10,077 MWh/yr.<br />
The mean value <strong>of</strong> internal rate <strong>of</strong> return IRR was found to be 13.53% while the<br />
minimum and maximum varied between a minimum <strong>of</strong> 10.73% and a maximum <strong>of</strong><br />
16.65%.<br />
The SPP varied between 7.6 and 11.8 yr while YPCF between 6.7 and 10. The mean<br />
values <strong>of</strong> SPP and YPCF were found to be 9.6 and 8.2 yr, respectively.<br />
The N<strong>PV</strong> was found to vary between $32 and $74 millions while the mean value<br />
remained as $51.3 million.<br />
The PI varied between 0.81 and 1.85 while the mean was found to be 1.287.<br />
Based on economical indicators, Bishah was found to be the best site for the<br />
development <strong>of</strong> <strong>PV</strong> based power plant and Tabuk the worst.<br />
SaylKabir<br />
Turabah<br />
Taif<br />
Sulayyil<br />
Bishah<br />
Heifa<br />
Baljarshi<br />
Mudaylif<br />
Namas<br />
Khosh<br />
Kiyad<br />
Sirr Lasan<br />
Abha<br />
Najran<br />
Sabya<br />
Fig. 9. Green house gases reduction due usage <strong>of</strong> <strong>PV</strong> systems for different locations.
1856<br />
From environmental point <strong>of</strong> view, it was found that on an average an approximate<br />
quantity <strong>of</strong> 8182 ton <strong>of</strong> green house gases can be avoided entering into the local<br />
atmosphere each year from a 5 MW capacity <strong>PV</strong> plant in any part <strong>of</strong> the Kingdom.<br />
The electricity demand patterns in Saudi Arabia matches with the pattern <strong>of</strong> global<br />
<strong>solar</strong> radiation intensity and sunshine duration. Hence this favors the usage <strong>of</strong> <strong>PV</strong> based<br />
electricity generation to meet the peak load requirements in summer time and day light<br />
hours throughout the year.<br />
It is recommended that more detailed techno-economical feasibility study must be<br />
conducted for Bishah site and a pilot plant should be developed there and monitored to<br />
overcome the various aspects <strong>of</strong> technology transfer and adoption in Saudi Arabia. This<br />
will also help in studying the engineering performance <strong>of</strong> such a power plant in local<br />
environment.<br />
Acknowledgment<br />
The authors wish to acknowledge the support <strong>of</strong> the Research Institute <strong>of</strong> King Fahd<br />
University <strong>of</strong> Petroleum and Minerals, Dhahran, Saudi Arabia.<br />
References<br />
ARTICLE IN PRESS<br />
S. Rehman et al. / Renewable and Sustainable Energy Reviews 11 (2007) 1843–1857<br />
[1] UNEP. Energy and environment: a framework for action in the Arab region. Environment & <strong>energy</strong><br />
conference & exhibition, 2003.<br />
[2] Rehman S, Halawani TO. Development and utilization <strong>of</strong> <strong>solar</strong> <strong>energy</strong> in Saudi Arabia—review. Arab J Sci<br />
Eng 1998;23(1B):33–46.<br />
[3] Rehman S, Halawani TO. Global <strong>solar</strong> radiation estimation. Renew Energy 1997;12(4):369–85.<br />
[4] Mohandes M, Rehman S, Halawani TO. Estimation <strong>of</strong> global <strong>solar</strong> radiation <strong>using</strong> artificial neural networks.<br />
Renew Energy 1998;14(1–4):179–84.<br />
[5] Rehman S. Solar radiation over Saudi Arabia and comparisons with empirical models. Energy Int<br />
J 1998;23(12):1077–82.<br />
[6] Aksakal A, Rehman S. Global <strong>solar</strong> radiation in northeastern Saudi Arabia. Renew Energy 1999;17:461–72.<br />
[7] Rehman S. Empirical model development and comparison with existing correlations. Appl Energy<br />
1999;64(1–4):369–78.<br />
[8] Mohandes M, Balghonaim A, Kassas M, Rehman S, Halawani TO. Use <strong>of</strong> radial basis function for<br />
estimating monthly mean daily <strong>solar</strong> radiation. Sol Energy 2000;68(2):161–8.<br />
[9] Rehman S, Saleem GG. Spatial estimation <strong>of</strong> global <strong>solar</strong> radiation <strong>using</strong> geostatistics. Renew Energy<br />
2000;21(3–4):583–605.<br />
[10] Al-Ali AR, Rehman S, Al-Agili S, Al-Omari MH, Al-Fayezi M. Usage <strong>of</strong> photovoltaics in automated<br />
irrigation system. Renew Energy 2001;23(1):17–26.<br />
[11] Mohandes M. Application <strong>of</strong> neural networks for the prediction <strong>of</strong> hourly mean surface temperatures in<br />
Saudi Arabia. Renew Energy 2002;55:545–54.<br />
[12] Bahel V, Srinivasan R, Bakhsh H. Solar radiation for Dhahran, Saudi Arabia. Energy 1986;11(10):985–9.<br />
[13] Kruss PD, Bahel V, Elhadidy MA, Abdel-Nabi DY. Estimation <strong>of</strong> clear sky <strong>solar</strong> radiation at Dhahran,<br />
Saudi Arabia. ASHRAE A B C Tech 1989;95(3195):3–13.<br />
[14] Bahel V, Bakhsh H, Srinivasan R. Microcomputer based data acquisition and control system for radiation<br />
and meteorological measurements. Energy 1986;11(7):717–20.<br />
[15] Srinivasan R, Bahel V, Bakhsh H. Comparison <strong>of</strong> models for estimating <strong>solar</strong> radiation in arid and semi-arid<br />
regions. Energy 1987;12(2):113–6.<br />
[16] Bakhsh H, Srinivasan R, Bahel V. Correlation between hourly diffuse and global radiation for Dhahran,<br />
Saudi Arabia. Sol Wind Technol 1985;2(1):59–61.<br />
[17] Sabbagh JA, Sayigh AAM, El-Salam EMA. Estimation <strong>of</strong> total <strong>solar</strong> radiation from meteorological data. Sol<br />
Energy 1977;19:307–11.
ARTICLE IN PRESS<br />
S. Rehman et al. / Renewable and Sustainable Energy Reviews 11 (2007) 1843–1857 1857<br />
[18] Alawaji SH. Evaluation <strong>of</strong> <strong>solar</strong> <strong>energy</strong> research and its applications in Saudi Arabia—20 years <strong>of</strong><br />
experience. Renew Sustain Energy Rev 2001;5:59–77.<br />
[19] El Hori. Applications <strong>of</strong> renewable <strong>energy</strong> in Libya. http://www.<strong>solar</strong>energie-afrika.de/englisch/content/<br />
referate/hori_lybien.html<br />
[20] Hrayshat ES, Al-Soud MS. Solar <strong>energy</strong> in Jordan: current state and prospects. Renew Energy<br />
2004;8:193–200.<br />
[21] RETScreen International. Renewable <strong>energy</strong> project analysis s<strong>of</strong>tware. http://www.retscreen.net/