Interim Report Q3 2012 - Deutsche Post DHL
Interim Report Q3 2012 - Deutsche Post DHL
Interim Report Q3 2012 - Deutsche Post DHL

You also want an ePaper? Increase the reach of your titles
YUMPU automatically turns print PDFs into web optimized ePapers that Google loves.
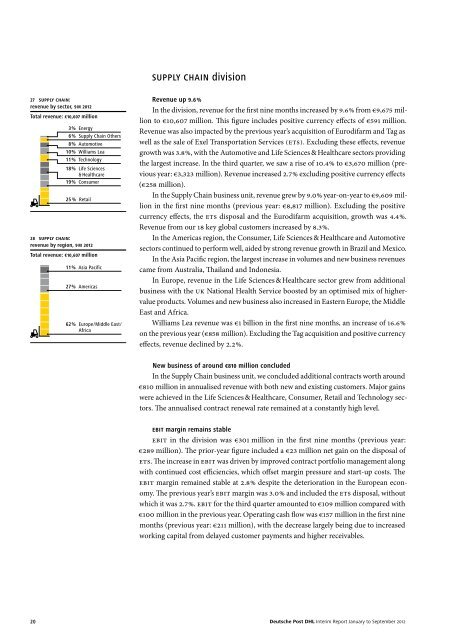
27 SUPPLY CHAIN:<br />
revenue by sector, 9 M <strong>2012</strong><br />
Total revenue: € 10,607 million<br />
3 % Energy<br />
6 % Supply Chain Others<br />
8 % Automotive<br />
10 % Williams Lea<br />
11 % Technology<br />
18 % Life Sciences<br />
& Healthcare<br />
19 % Consumer<br />
25 % Retail<br />
28 SUPPLY CHAIN:<br />
revenue by region, 9 M <strong>2012</strong><br />
Total revenue: € 10,607 million<br />
11 % Asia Pacific<br />
27 % Americas<br />
62 % Europe / Middle East /<br />
Africa<br />
SUPPLY CHAIN division<br />
Revenue up 9.6 %<br />
In the division, revenue for the first nine months increased by 9.6 % from €9,675 million<br />
to €10,607 million. This figure includes positive currency effects of €591 million.<br />
Revenue was also impacted by the previous year’s acquisition of Eurodifarm and Tag as<br />
well as the sale of Exel Transportation Services (ETS). Excluding these effects, revenue<br />
growth was 3.8 %, with the Automotive and Life Sciences & Healthcare sectors providing<br />
the largest increase. In the third quarter, we saw a rise of 10.4 % to €3,670 million (previous<br />
year: €3,323 million). Revenue increased 2.7 % excluding positive currency effects<br />
(€258 million).<br />
In the Supply Chain business unit, revenue grew by 9.0 % year-on-year to €9,609 million<br />
in the first nine months (previous year: €8,817 million). Excluding the positive<br />
currency effects, the ETS disposal and the Eurodifarm acquisition, growth was 4.4 %.<br />
Revenue from our 18 key global customers increased by 8.3 %.<br />
In the Americas region, the Consumer, Life Sciences & Healthcare and Automotive<br />
sectors continued to perform well, aided by strong revenue growth in Brazil and Mexico.<br />
In the Asia Pacific region, the largest increase in volumes and new business revenues<br />
came from Australia, Thailand and Indonesia.<br />
In Europe, revenue in the Life Sciences & Healthcare sector grew from additional<br />
business with the UK National Health Service boosted by an optimised mix of higher-<br />
value products. Volumes and new business also increased in Eastern Europe, the Middle<br />
East and Africa.<br />
Williams Lea revenue was €1 billion in the first nine months, an increase of 16.6 %<br />
on the previous year (€858 million). Excluding the Tag acquisition and positive currency<br />
effects, revenue declined by 2.2 %.<br />
New business of around €810 million concluded<br />
In the Supply Chain business unit, we concluded additional contracts worth around<br />
€810 million in annualised revenue with both new and existing customers. Major gains<br />
were achieved in the Life Sciences & Healthcare, Consumer, Retail and Technology sectors.<br />
The annualised contract renewal rate remained at a constantly high level.<br />
EBIT margin remains stable<br />
EBIT in the division was €301 million in the first nine months (previous year:<br />
€289 million). The prior-year figure included a €23 million net gain on the disposal of<br />
ETS. The increase in EBIT was driven by improved contract portfolio management along<br />
with continued cost efficiencies, which offset margin pressure and start-up costs. The<br />
EBIT margin remained stable at 2.8 % despite the deterioration in the European economy.<br />
The previous year’s EBIT margin was 3.0 % and included the ETS disposal, without<br />
which it was 2.7 %. EBIT for the third quarter amounted to €109 million compared with<br />
€100 million in the previous year. Operating cash flow was €157 million in the first nine<br />
months (previous year: €211 million), with the decrease largely being due to increased<br />
working capital from delayed customer payments and higher receivables.<br />
20 <strong>Deutsche</strong> <strong>Post</strong> <strong>DHL</strong> <strong>Interim</strong> <strong>Report</strong> January to September <strong>2012</strong>