Bayesian Methods for Astrophysics and Particle Physics
Bayesian Methods for Astrophysics and Particle Physics
Bayesian Methods for Astrophysics and Particle Physics
Create successful ePaper yourself
Turn your PDF publications into a flip-book with our unique Google optimized e-Paper software.
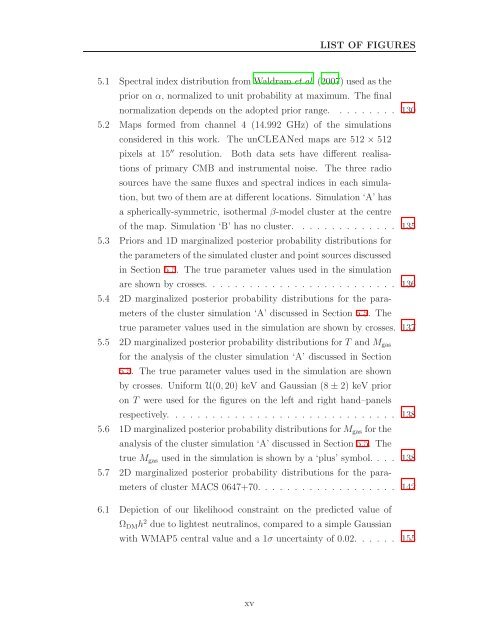
LIST OF FIGURES<br />
5.1 Spectral index distribution from Waldram et al. (2007) used as the<br />
prior on α, normalized to unit probability at maximum. The final<br />
normalization depends on the adopted prior range. . . . . . . . . 130<br />
5.2 Maps <strong>for</strong>med from channel 4 (14.992 GHz) of the simulations<br />
considered in this work. The unCLEANed maps are 512 × 512<br />
pixels at 15 ′′ resolution. Both data sets have different realisa-<br />
tions of primary CMB <strong>and</strong> instrumental noise. The three radio<br />
sources have the same fluxes <strong>and</strong> spectral indices in each simula-<br />
tion, but two of them are at different locations. Simulation ‘A’ has<br />
a spherically-symmetric, isothermal β-model cluster at the centre<br />
of the map. Simulation ‘B’ has no cluster. . . . . . . . . . . . . . 135<br />
5.3 Priors <strong>and</strong> 1D marginalized posterior probability distributions <strong>for</strong><br />
the parameters of the simulated cluster <strong>and</strong> point sources discussed<br />
in Section 5.5. The true parameter values used in the simulation<br />
are shown by crosses. . . . . . . . . . . . . . . . . . . . . . . . . . 136<br />
5.4 2D marginalized posterior probability distributions <strong>for</strong> the para-<br />
meters of the cluster simulation ‘A’ discussed in Section 5.5. The<br />
true parameter values used in the simulation are shown by crosses. 137<br />
5.5 2D marginalized posterior probability distributions <strong>for</strong> T <strong>and</strong> Mgas<br />
<strong>for</strong> the analysis of the cluster simulation ‘A’ discussed in Section<br />
5.5. The true parameter values used in the simulation are shown<br />
by crosses. Uni<strong>for</strong>m U(0, 20) keV <strong>and</strong> Gaussian (8 ± 2) keV prior<br />
on T were used <strong>for</strong> the figures on the left <strong>and</strong> right h<strong>and</strong>–panels<br />
respectively. . . . . . . . . . . . . . . . . . . . . . . . . . . . . . . 138<br />
5.6 1D marginalized posterior probability distributions <strong>for</strong> Mgas <strong>for</strong> the<br />
analysis of the cluster simulation ‘A’ discussed in Section 5.5. The<br />
true Mgas used in the simulation is shown by a ‘plus’ symbol. . . . 138<br />
5.7 2D marginalized posterior probability distributions <strong>for</strong> the para-<br />
meters of cluster MACS 0647+70. . . . . . . . . . . . . . . . . . . 142<br />
6.1 Depiction of our likelihood constraint on the predicted value of<br />
ΩDMh 2 due to lightest neutralinos, compared to a simple Gaussian<br />
with WMAP5 central value <strong>and</strong> a 1σ uncertainty of 0.02. . . . . . 155<br />
xv


