Bayesian Methods for Astrophysics and Particle Physics
Bayesian Methods for Astrophysics and Particle Physics
Bayesian Methods for Astrophysics and Particle Physics

Create successful ePaper yourself
Turn your PDF publications into a flip-book with our unique Google optimized e-Paper software.
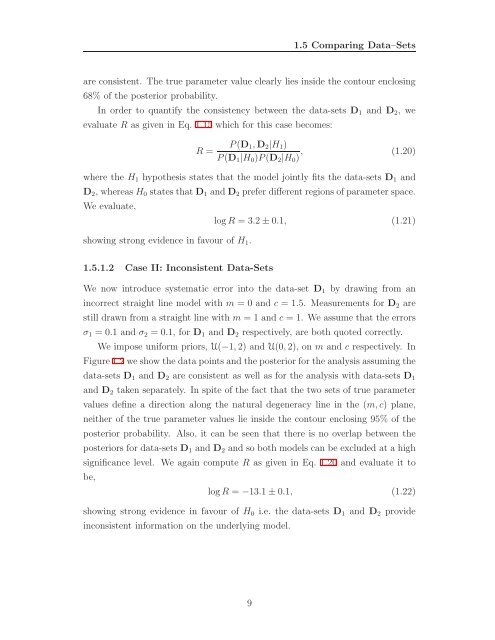
1.5 Comparing Data–Sets<br />
are consistent. The true parameter value clearly lies inside the contour enclosing<br />
68% of the posterior probability.<br />
In order to quantify the consistency between the data-sets D1 <strong>and</strong> D2, we<br />
evaluate R as given in Eq. 1.15 which <strong>for</strong> this case becomes:<br />
R =<br />
P(D1,D2|H1)<br />
, (1.20)<br />
P(D1|H0)P(D2|H0)<br />
where the H1 hypothesis states that the model jointly fits the data-sets D1 <strong>and</strong><br />
D2, whereas H0 states that D1 <strong>and</strong> D2 prefer different regions of parameter space.<br />
We evaluate,<br />
showing strong evidence in favour of H1.<br />
1.5.1.2 Case II: Inconsistent Data-Sets<br />
log R = 3.2 ± 0.1, (1.21)<br />
We now introduce systematic error into the data-set D1 by drawing from an<br />
incorrect straight line model with m = 0 <strong>and</strong> c = 1.5. Measurements <strong>for</strong> D2 are<br />
still drawn from a straight line with m = 1 <strong>and</strong> c = 1. We assume that the errors<br />
σ1 = 0.1 <strong>and</strong> σ2 = 0.1, <strong>for</strong> D1 <strong>and</strong> D2 respectively, are both quoted correctly.<br />
We impose uni<strong>for</strong>m priors, U(−1, 2) <strong>and</strong> U(0, 2), on m <strong>and</strong> c respectively. In<br />
Figure 1.2 we show the data points <strong>and</strong> the posterior <strong>for</strong> the analysis assuming the<br />
data-sets D1 <strong>and</strong> D2 are consistent as well as <strong>for</strong> the analysis with data-sets D1<br />
<strong>and</strong> D2 taken separately. In spite of the fact that the two sets of true parameter<br />
values define a direction along the natural degeneracy line in the (m, c) plane,<br />
neither of the true parameter values lie inside the contour enclosing 95% of the<br />
posterior probability. Also, it can be seen that there is no overlap between the<br />
posteriors <strong>for</strong> data-sets D1 <strong>and</strong> D2 <strong>and</strong> so both models can be excluded at a high<br />
significance level. We again compute R as given in Eq. 1.20 <strong>and</strong> evaluate it to<br />
be,<br />
log R = −13.1 ± 0.1, (1.22)<br />
showing strong evidence in favour of H0 i.e. the data-sets D1 <strong>and</strong> D2 provide<br />
inconsistent in<strong>for</strong>mation on the underlying model.<br />
9