Vinyl Chloride - Texas Commission on Environmental Quality
Vinyl Chloride - Texas Commission on Environmental Quality
Vinyl Chloride - Texas Commission on Environmental Quality

You also want an ePaper? Increase the reach of your titles
YUMPU automatically turns print PDFs into web optimized ePapers that Google loves.
Development Support Document<br />
Final, February 13, 2009<br />
<str<strong>on</strong>g>Vinyl</str<strong>on</strong>g> <str<strong>on</strong>g>Chloride</str<strong>on</strong>g><br />
CAS Registry Number: 75-01-4<br />
Prepared by<br />
Shann<strong>on</strong> Ethridge, M.S.<br />
Toxicology Divisi<strong>on</strong><br />
Chief Engineer’s Office<br />
___________________________________________________________<br />
TEXAS COMMISSION ON ENVIRONMENTAL QUALITY
<str<strong>on</strong>g>Vinyl</str<strong>on</strong>g> chloride<br />
Page 2<br />
TABLE OF CONTENTS<br />
CHAPTER 1 SUMMARY TABLES..........................................................................................................................4<br />
CHAPTER 2 MAJOR USES OR SOURCES ...........................................................................................................5<br />
CHAPTER 3 ACUTE EVALUATION......................................................................................................................6<br />
3.1 HEALTH-BASED ACUTE REV AND ESL ...............................................................................................................6<br />
3.1.1 Physical/Chemical Properties and Key Studies ..........................................................................................6<br />
3.1.1.1 Physical/Chemical Properties................................................................................................................................6<br />
3.1.1.2 Essential Data and Key Studies............................................................................................................................. 6<br />
3.1.1.2.1 Human Studies.............................................................................................................................................. 6<br />
3.1.1.2.2 Animal Studies.............................................................................................................................................. 7<br />
3.1.2 Mode-of-Acti<strong>on</strong> (MOA) Analysis and Dose Metric .....................................................................................7<br />
3.1.3 Point of Departure (POD) for the Key Study ..............................................................................................8<br />
3.1.4 Dosimetric Adjustments ..............................................................................................................................8<br />
3.1.4.1 Default Exposure Durati<strong>on</strong> Adjustments............................................................................................................... 8<br />
3.1.5 Critical Effect and Adjustment of PODHEC..................................................................................................8<br />
3.1.6 Health-Based Acute ReV and acute ESL.........................................................................................................8<br />
3.1.7 Special C<strong>on</strong>siderati<strong>on</strong>s................................................................................................................................8<br />
3.2 WELFARE-BASED ACUTE ESLS...........................................................................................................................9<br />
3.2.1 Odor Percepti<strong>on</strong>..........................................................................................................................................9<br />
3.2.2 Vegetati<strong>on</strong> Effects .......................................................................................................................................9<br />
3.3 SHORT-TERM ESL AND VALUES FOR AIR MONITORING EVALUATION................................................................9<br />
3.4 COMPARISON OF RESULTS .................................................................................................................................10<br />
CHAPTER 4 CHRONIC EVALUATION...............................................................................................................10<br />
4.1 NONCARCINOGENIC POTENTIAL ........................................................................................................................10<br />
4.1.1 Physical/Chemical Properties and Key Studies ........................................................................................10<br />
4.1.1.1 Human Studies .................................................................................................................................................... 10<br />
4.1.1.2 Animal Studies.................................................................................................................................................... 10<br />
4.1.1.2.1 Key Study ................................................................................................................................................... 10<br />
4.1.1.2.2 Supporting Studies...................................................................................................................................... 11<br />
4.1.2 MOA Analysis and Dose Metric................................................................................................................14<br />
4.1.3 POD for Key and Supporting Studies........................................................................................................15<br />
4.1.4 Dosimetric Adjustments ............................................................................................................................15<br />
4.1.4.1 Exposure Durati<strong>on</strong> Adjustments ......................................................................................................................... 15<br />
4.1.4.2 Default Dosimetry Adjustments from Animal-to-Human Exposure ................................................................... 16<br />
4.1.5 Adjustment of PODHEC and Critical Effect................................................................................................16<br />
4.1.5.1 Critical Effect...................................................................................................................................................... 16<br />
4.1.5.2 Uncertainty Factors ............................................................................................................................................. 16<br />
4.1.6 Health-Based Chr<strong>on</strong>ic ReV and chr<strong>on</strong>ic ESLn<strong>on</strong>linear(nc) ..................................................................................16<br />
4.1.7 Comparis<strong>on</strong> of Results ..............................................................................................................................16<br />
4.2 CARCINOGENIC POTENTIAL ...............................................................................................................................17<br />
4.2.1 Carcinogenic Weight-of-Evidence ............................................................................................................17<br />
4.2.2 MOA Analysis ...........................................................................................................................................18<br />
4.2.3 Key Studies................................................................................................................................................18<br />
4.2.3.1 Human Epidemiologic Studies............................................................................................................................ 18<br />
4.2.3.2 Animal Studies.................................................................................................................................................... 18<br />
4.2.4 Dose-Resp<strong>on</strong>se Assessment.......................................................................................................................19<br />
4.2.4.1 Dose Metrics and Potency Estimates Based <strong>on</strong> Human Epidemiological Studies............................................... 19<br />
4.2.4.1.1 USEPA (2000) ............................................................................................................................................ 19<br />
4.2.4.1.2 Clewell et al. (2001).................................................................................................................................... 20<br />
4.2.4.2 Dose Metrics and Potency Estimates Based <strong>on</strong> Animal Data.............................................................................. 20<br />
4.2.4.2.1 USEPA (2000) ............................................................................................................................................ 20
<str<strong>on</strong>g>Vinyl</str<strong>on</strong>g> chloride<br />
Page 3<br />
4.2.4.2.2 Clewell et al. (2001).................................................................................................................................... 22<br />
4.2.4.2.3 Comparis<strong>on</strong> of USEPA (2000) and Clewell et al. (2001) ........................................................................... 23<br />
4.2.5 Evaluating Susceptibility from Early-Life Exposures ...............................................................................23<br />
4.2.6 Calculati<strong>on</strong> of Air C<strong>on</strong>centrati<strong>on</strong> at 1 x 10 -5 Excess Cancer Risk.............................................................24<br />
4.2.7 Comparis<strong>on</strong> of Results ..............................................................................................................................25<br />
4.3 WELFARE-BASED CHRONIC ESL.......................................................................................................................26<br />
4.4 LONG-TERM ESL AND VALUES FOR AIR MONITORING EVALUATION ...............................................................26<br />
CHAPTER 5 REFERENCES...................................................................................................................................26<br />
5.1 REFERENCES CITED IN THE DEVELOPMENT SUPPORT DOCUMENT.....................................................................26<br />
5.2 OTHER REFERENCES REVIEWED BUT NOT CITED:.............................................................................................31<br />
APPENDIX A. BENCHMARK DOSE MODELING RESULTS FOR THORNTON ET AL. (2002)...............35<br />
LIST OF TABLES<br />
Table 1. Health- and Welfare-Based Values..................................................................................................................4<br />
Table 2. Chemical and Physical Data – <str<strong>on</strong>g>Vinyl</str<strong>on</strong>g> <str<strong>on</strong>g>Chloride</str<strong>on</strong>g> – CASRN 75-01-4 .................................................................5<br />
Table 3. Derivati<strong>on</strong> of the Acute ReV and acute ESL .......................................................................................................9<br />
Table 4. Summary of Chr<strong>on</strong>ic Animal Inhalati<strong>on</strong> Studies (13 Weeks Durati<strong>on</strong> and L<strong>on</strong>ger) .....................................13<br />
Table 5. Benchmark Dose Modeling Results ..............................................................................................................15<br />
Table 6. Derivati<strong>on</strong> of the Chr<strong>on</strong>ic ReV and chr<strong>on</strong>ic ESLn<strong>on</strong>linear(nc) .................................................................................17<br />
Table 7. Risk Estimates for Angiosarcoma based <strong>on</strong> Epidemiological Studies (USEPA 2000) .................................20<br />
Table 8. Risk Estimates for Angiosarcoma based <strong>on</strong> Epidemiological Studies (Clewell et al. 2001).........................20<br />
Table 9. Dose and Tumor Incidence Data from Inhalati<strong>on</strong> of VC by Female Sprague-Dawley Rats (Malt<strong>on</strong>i et al.<br />
1981 and 1984/Experiments BT1, BT2, and BT15) as Reported in USEPA (2000)...................................................22<br />
Table 10. Human Risk Estimates for Inhalati<strong>on</strong> Exposure based <strong>on</strong> Angiosarcoma Incidence in Animal Studies<br />
(Clewell et al. 2001). ...................................................................................................................................................22<br />
Table 11. Comparis<strong>on</strong> of VC Inhalati<strong>on</strong> URFs and Chr<strong>on</strong>ic Toxicity Benchmarks....................................................25<br />
LIST OF FIGURES<br />
Figure 1. Metabolism of <str<strong>on</strong>g>Vinyl</str<strong>on</strong>g> <str<strong>on</strong>g>Chloride</str<strong>on</strong>g> .....................................................................................................................14
<str<strong>on</strong>g>Vinyl</str<strong>on</strong>g> chloride<br />
Page 4<br />
Chapter 1 Summary Tables<br />
Table 1 provides a summary of health- and welfare-based values from an acute and chr<strong>on</strong>ic evaluati<strong>on</strong> of<br />
vinyl chloride (VC). Table 2 provides summary informati<strong>on</strong> <strong>on</strong> VC’s chemical and physical properties.<br />
Table 1. Health- and Welfare-Based Values<br />
Short-Term Values C<strong>on</strong>centrati<strong>on</strong>s<br />
20,000 µg/m<br />
Notes<br />
acute<br />
ESL [1 h]<br />
(HQ = 0.3)<br />
3<br />
(7800 ppb)<br />
Short-term ESL for Air<br />
Permit Reviews<br />
acute ReV<br />
68,000 µg/m<br />
(HQ = 1.0)<br />
3<br />
(26,000 ppb) a<br />
Critical effect: mild headache and<br />
dryness of eyes and nose in humans<br />
acute<br />
ESLodor<br />
[1 h]<br />
---<br />
Data are inadequate. See secti<strong>on</strong> 3.2.1<br />
for informati<strong>on</strong><br />
acute ESLveg --- No data found<br />
L<strong>on</strong>g-Term Values C<strong>on</strong>centrati<strong>on</strong>s Notes<br />
chr<strong>on</strong>ic<br />
ESLn<strong>on</strong>linear(nc)<br />
(HQ = 0.3)<br />
18 µg/m 3 chr<strong>on</strong>ic ReV<br />
(6.9 ppb)<br />
(HQ = 1.0)<br />
60 µg/m 3 (23 ppb) a<br />
Critical effect: increase in incidence<br />
of centrilobular hypertrophy in liver of<br />
female rats<br />
chr<strong>on</strong>ic ESLlinear(c)<br />
1.2 µg/m 3 a, b, c<br />
(0.45 ppb)<br />
L<strong>on</strong>g-term ESL for Air<br />
Permit Reviews<br />
Cancer Endpoint: increase in<br />
incidence of liver angiosarcoma<br />
chr<strong>on</strong>ic<br />
ESLveg --- No data found<br />
a<br />
Values that may be used for evaluati<strong>on</strong> of air m<strong>on</strong>itoring data<br />
b -6 3 -5<br />
Unit risk factor (URF) = 8.4 x 10 per µg/m (2.2 x 10 per ppb)<br />
c 3<br />
Value is protective of early-life exposure. If children are not expected to be exposed, the higher value of 2.3 µg/m<br />
(0.90 ppb) may be used<br />
Abbreviati<strong>on</strong>s: ppb, parts per billi<strong>on</strong>; μg/m 3 , micrograms per cubic meter; h, hour; ESL, Effects<br />
Screening Level; ReV, Reference Value; acute ESLodor, acute odor-based ESL; acute ESLveg, acute<br />
vegetati<strong>on</strong>-based ESL; chr<strong>on</strong>ic ESLn<strong>on</strong>linear(nc), chr<strong>on</strong>ic health-based ESL for n<strong>on</strong>linear dose-resp<strong>on</strong>se<br />
n<strong>on</strong>cancer effects; chr<strong>on</strong>ic ESLlinear(c), chr<strong>on</strong>ic health-based ESL for linear dose-resp<strong>on</strong>se cancer effects;<br />
chr<strong>on</strong>ic ESLn<strong>on</strong>linear(c), chr<strong>on</strong>ic health-based ESL for n<strong>on</strong>linear dose-resp<strong>on</strong>se cancer effects; chr<strong>on</strong>ic ESLveg,<br />
chr<strong>on</strong>ic vegetati<strong>on</strong>-based ESL; and HQ, hazard quotient
<str<strong>on</strong>g>Vinyl</str<strong>on</strong>g> chloride<br />
Page 5<br />
Table 2. Chemical and Physical Data – <str<strong>on</strong>g>Vinyl</str<strong>on</strong>g> <str<strong>on</strong>g>Chloride</str<strong>on</strong>g> – CASRN 75-01-4<br />
Parameter Value Reference<br />
Molecular Formula C2H3Cl Chemfinder 2004<br />
Chemical Structure<br />
Chemfinder 2004<br />
Molecular Weight 62.5 g/mole <str<strong>on</strong>g>Texas</str<strong>on</strong>g> Risk Reducti<strong>on</strong> Program<br />
(TRRP) 2006<br />
Physical State Gas TRRP 2006<br />
Color Colorless USEPA 2000<br />
Odor Mild, sweet USEPA 2000<br />
CAS Registry Number 75-01-4 TRRP 2006<br />
Syn<strong>on</strong>yms Chloroethene<br />
Chloroethylene<br />
Ethylene m<strong>on</strong>ochloride<br />
M<strong>on</strong>ochloroethene<br />
USEPA 2000<br />
Solubility in water 1100 to 2760 mg/L at 25 o C TRRP 2006, Chemfinder 2004<br />
Log Kow or Pow<br />
Vapor Pressure<br />
Log Kow = 1.62<br />
2800 mm Hg at 20<br />
TRRP 2006<br />
o C TRRP 2006<br />
Vapor Density (air = 1) 2.2 Chemfinder 2004<br />
Density (water = 1) 0.91 Chemfinder 2004<br />
Melting Point -153.7 o C Chemfinder 2004<br />
Boiling Point -13.9 o C Chemfinder 2004<br />
C<strong>on</strong>versi<strong>on</strong> Factors 1 ppm = 2.60 mg/m 3<br />
1.0 mg/m 3 = 0.39 ppm<br />
USEPA 2000<br />
Chapter 2 Major Uses or Sources<br />
VC is a man-made chemical and is <strong>on</strong>e of the highest producti<strong>on</strong> volume chemicals in the world. It is<br />
used mainly in the producti<strong>on</strong> of polyvinyl chloride polymers (PVC). PVC is used to make automotive<br />
parts, packaging products, pipes, c<strong>on</strong>structi<strong>on</strong> materials, furniture, and a variety of other products. The<br />
United States Envir<strong>on</strong>mental Protecti<strong>on</strong> Agency (USEPA) Nati<strong>on</strong>al Toxics Inventory estimated that 1650<br />
t<strong>on</strong>s (3.3 milli<strong>on</strong> pounds) of VC were released to the atmosphere in the c<strong>on</strong>tiguous United States (US)<br />
plus Puerto Rico and the Virgin Islands in 1996 (USEPA 2005). The Nati<strong>on</strong>al Toxics Inventory estimated<br />
that emissi<strong>on</strong>s of VC from <str<strong>on</strong>g>Texas</str<strong>on</strong>g> totaled 846,000 pounds in 1996. Ambient m<strong>on</strong>itoring data indicate that<br />
VC is generally not detected above the method detecti<strong>on</strong> limit of 0.17 ppb in <str<strong>on</strong>g>Texas</str<strong>on</strong>g>. Higher levels may be<br />
found in the air near VC producti<strong>on</strong> facilities, hazardous waste sites, or municipal landfills (ATSDR<br />
2006).
<str<strong>on</strong>g>Vinyl</str<strong>on</strong>g> chloride<br />
Page 6<br />
Chapter 3 Acute Evaluati<strong>on</strong><br />
3.1 Health-Based Acute ReV and ESL<br />
3.1.1 Physical/Chemical Properties and Key Studies<br />
3.1.1.1 Physical/Chemical Properties<br />
VC is a colorless gas at room temperature. It has a mild, sweet odor and is slightly soluble in water. The<br />
main chemical and physical properties of VC are summarized in Table 2.<br />
3.1.1.2 Essential Data and Key Studies<br />
Numerous toxicity studies have been c<strong>on</strong>ducted in humans and animals after acute exposure to VC. These<br />
studies are discussed in detail in ATSDR (2006) and AEGL (2004). Baretta et al. (1969) was selected as<br />
the key study over other available human or animal studies because of the dem<strong>on</strong>strati<strong>on</strong> of effects below<br />
levels reported in other studies.<br />
3.1.1.2.1 Human Studies<br />
The primary acute effect of VC inhalati<strong>on</strong> exposure in humans is central nervous system (CNS)<br />
depressi<strong>on</strong> (Holmberg 1984). The most comm<strong>on</strong>ly reported symptoms of VC-induced CNS depressi<strong>on</strong><br />
include dizziness, headache, drowsiness, and/or loss of c<strong>on</strong>sciousness (ATSDR 2006). In <strong>on</strong>e study, four<br />
to eight human volunteers were exposed by inhalati<strong>on</strong> in a whole-body chamber to 59, 261, 491, or 493<br />
ppm VC for up to 7.5 hours (h) (3.5 h of exposure, 0.5 h break, then another 3.5 h exposure) (Baretta et<br />
al. 1969). Subjective and neurological resp<strong>on</strong>ses were measured before each subject entered the chamber,<br />
15 minutes after they entered the chamber, and at 1 h intervals thereafter. Two out of seven subjects<br />
exposed to 491 ppm for 3.5 h and two out of four exposed to 493 ppm for 7.5 h reported mild headache<br />
and dryness of their eyes and nose. A No-Observed-Adverse-Effect Level (NOAEL) of 261 ppm<br />
(analytical) was identified for this study.<br />
In a study c<strong>on</strong>ducted by Lester et al. (1963), three men and three women were exposed for five minutes,<br />
twice a day, separated by a 6 h interval, for three days to 0, 4000, 8000, 12,000, 16,000, and 20,000 ppm<br />
VC. Volunteers were exposed via an oral-nasal mask. No effects were reported at 4000 ppm. Two<br />
volunteers reported dizziness and reeling at 12,000 ppm. One subject reported feeling “slightly heady” at<br />
8000 ppm, did not report any effects at 4000 ppm, and reported feeling “slightly dizzy” at 0 ppm so the<br />
effects experienced by this subject at 8000 ppm are questi<strong>on</strong>able as to whether they were treatmentrelated.<br />
As reported in AEGL (2004), Patty et al. (1930) reported that two male volunteers exposed to 25,000 ppm<br />
VC for three minutes reported dizziness and disorientati<strong>on</strong> to the space and size of surrounding objects.<br />
They also reported a burning sensati<strong>on</strong> <strong>on</strong> the soles of their feet.<br />
No clear associati<strong>on</strong> exists between VC exposure and developmental effects in humans. Studies have<br />
indicated an increase in some forms of developmental toxicity in members of communities near VC<br />
polymerizati<strong>on</strong> facilities although the studies did not dem<strong>on</strong>strate a statisically significant correlati<strong>on</strong><br />
between developmental toxicity and parental occupati<strong>on</strong> or proximity to the facility (Edm<strong>on</strong>ds et a. 1978,<br />
Infante 1976, Rosenman et al. 1989, Theriault et al. 1983). Several studies have examined the effects of<br />
inhalati<strong>on</strong> exposure to VC <strong>on</strong> the incidence of fetal loss and birth defects and no solid associati<strong>on</strong>s have<br />
been found (Hatch et al. 1981, Infante et al. 1976). For a complete review see ATSDR (2006).
<str<strong>on</strong>g>Vinyl</str<strong>on</strong>g> chloride<br />
Page 7<br />
3.1.1.2.2 Animal Studies<br />
The most c<strong>on</strong>servative Lowest-Observed-Adverse-Effect Level (LOAEL) identified from an acute<br />
inhalati<strong>on</strong> animal experiment (less than 24 h exposure) was 1500 ppm for liver effects in mice after a 2 h<br />
exposure (Taitra and Ungvary (1981) as reported in AEGL (2004)). Hehir et al. (1981) reported no<br />
clinical signs of toxicity in mice after a 1 h exposure to 5000 ppm. Acute effects in other animal species<br />
are reported to occur at much higher c<strong>on</strong>centrati<strong>on</strong>s.<br />
In additi<strong>on</strong>, animal experiments have not dem<strong>on</strong>strated an associati<strong>on</strong> with VC exposure and<br />
developmental effects at doses below those that cause maternal toxicity. John et al. (1977) exposed mice<br />
to 0, 50, and 500 ppm VC by inhalati<strong>on</strong> for 10 days, 7 h/day, during gestati<strong>on</strong>al day (GD) 6-15. Rats and<br />
rabbits were exposed to 0, 500, and 2500 ppm VC by inhalati<strong>on</strong> for 10 days, 7 h/day, during GD 6-15 in<br />
rats and for 13 days, 7 h/day, during GD 6-18 in rabbits. A NOAEL was identified for mice at 50 ppm<br />
and a LOAEL at 500 ppm (delayed ossificati<strong>on</strong> and unfused sternebrae); however, maternal toxicity was<br />
observed at 500 ppm (including decreased maternal weight gain during pregnancy, decreased food<br />
c<strong>on</strong>sumpti<strong>on</strong>, decreased absolute liver weight, and 17% mortality). A LOAEL of 500 ppm was identified<br />
for rabbits for delayed ossificati<strong>on</strong> although this effect was not observed at 2500 ppm. Maternal toxicity<br />
was observed in rabbits exposed to 500 ppm (reduced food c<strong>on</strong>sumpti<strong>on</strong> during gestati<strong>on</strong>), although this<br />
effect was not observed at 2500 ppm. A LOAEL of 2500 ppm was identified for rats (ureter dilati<strong>on</strong>);<br />
however, this dose was associated with increased absolute liver weight and decreased food c<strong>on</strong>sumpti<strong>on</strong><br />
during gestati<strong>on</strong> in dams. The effects observed in fetuses could be sec<strong>on</strong>dary to maternal toxicity, and the<br />
results from this study do not dem<strong>on</strong>strate developmental toxicity.<br />
Ungvary et al. (1978) exposed pregnant rats to 0 or 1500 ppm VC for 24 h/day during the first, sec<strong>on</strong>d, or<br />
third week of pregnancy to determine possible teratogenic or embryotoxic effects. No significant<br />
increases in abnormalities were observed in fetuses from VC exposed mothers. There was an increase<br />
(although not statistically significant) in the number of resorbed fetuses in the groups subjected to VC<br />
exposure during the first week of pregnancy. Maternal toxicity was reported in this group as increased<br />
relative liver weight.<br />
Thornt<strong>on</strong> et al. (2002) c<strong>on</strong>ducted a developmental and reproductive toxicity study in Sprague-Dawley rats<br />
and did not observe any developmental effects of VC exposure up to 1100 ppm (the highest dose tested).<br />
Because acute human inhalati<strong>on</strong> studies are available and animal experiments have not dem<strong>on</strong>strated an<br />
associati<strong>on</strong> with VC exposure and developmental effects at doses below those that cause maternal<br />
toxicity, the Toxicology Divisi<strong>on</strong> (TD) chose Baretta et al. (1969) as the key study.<br />
3.1.2 Mode-of-Acti<strong>on</strong> (MOA) Analysis and Dose Metric<br />
VC is thought to depress the CNS by a solvent effect <strong>on</strong> lipids and protein comp<strong>on</strong>ents of neural<br />
membranes that disrupts signal transmissi<strong>on</strong> (ATSDR 2007). It is assumed that the parent chemical,<br />
rather than a metabolite, is resp<strong>on</strong>sible for these effects. The MOA for VC effects <strong>on</strong> the eyes and nose is<br />
most likely due to irritant effects of the parent chemical. In the key study, data <strong>on</strong> exposure c<strong>on</strong>centrati<strong>on</strong><br />
of the parent chemical are available. For eye and nose irritati<strong>on</strong> in humans, the dose metric is exposure<br />
c<strong>on</strong>centrati<strong>on</strong> of the parent chemical. For inducti<strong>on</strong> of headache, since data <strong>on</strong> other more specific dose<br />
metrics (e.g., blood c<strong>on</strong>centrati<strong>on</strong> of parent chemical or area under blood c<strong>on</strong>centrati<strong>on</strong> curve of parent<br />
chemical) are not available for this study, exposure c<strong>on</strong>centrati<strong>on</strong> of the parent chemical will be used as<br />
the default dose metric.
<str<strong>on</strong>g>Vinyl</str<strong>on</strong>g> chloride<br />
Page 8<br />
3.1.3 Point of Departure (POD) for the Key Study<br />
A NOAEL of 261 ppm was identified in the Baretta et al. (1969) study based <strong>on</strong> mild headache and<br />
dryness of eyes and nose in human volunteers and will be used as the human equivalent c<strong>on</strong>centrati<strong>on</strong><br />
POD (PODHEC).<br />
3.1.4 Dosimetric Adjustments<br />
3.1.4.1 Default Exposure Durati<strong>on</strong> Adjustments<br />
Since there is not sufficient evidence to show that the critical effects in the key study (mild headache and<br />
dryness of eyes and nose) are both c<strong>on</strong>centrati<strong>on</strong> and durati<strong>on</strong> dependent, and the exposure durati<strong>on</strong> is<br />
greater than 1 h, no durati<strong>on</strong> adjustment was c<strong>on</strong>ducted as recommended by the TCEQ ESL guidelines<br />
(TCEQ 2006). Therefore, the PODHEC of 261 ppm is c<strong>on</strong>servatively not adjusted.<br />
3.1.5 Critical Effect and Adjustment of PODHEC<br />
The specific critical effects for the key study (Baretta et al. 1969) are mild headache and dry eyes and<br />
nose in humans following acute exposure to VC. Since these effects are c<strong>on</strong>sidered to have a threshold<br />
(i.e., a n<strong>on</strong>linear MOA), uncertainty factors were applied to the PODHEC.<br />
The following uncertainty factors (UFs) were applied: a UF of 10 for intraspecies variability to account<br />
for sensitive members of the populati<strong>on</strong> (UFH) and a UF of 1 because the acute database is c<strong>on</strong>sidered<br />
complete (UFD) based <strong>on</strong> numerous studies discussed in ATSDR (2006) and AEGL (2004). The total UF<br />
= 10.<br />
acute ReV = PODHEC<br />
UFH x UFD<br />
acute ReV = 261 ppm<br />
10<br />
acute ReV = 26 ppm (26,000 ppb) = 68 mg/m 3 (68,000 µg/m 3 )<br />
3.1.6 Health-Based Acute ReV and acute ESL<br />
As shown in Table 3, the acute ReV is 68,000 µg/m 3 (26,000 ppb). The acute ReV was then used to<br />
calculate the acute ESL. At the target hazard quotient (HQ) of 0.3, the acute ESL is 20,000 µg/m 3 (7800 ppb).<br />
All numbers were rounded to two significant figures at the end of all calculati<strong>on</strong>s.<br />
3.1.7 Special C<strong>on</strong>siderati<strong>on</strong>s<br />
VC carcinogenicity is thought to occur by a mutagenic MOA via DNA adduct formati<strong>on</strong> as described in<br />
Secti<strong>on</strong> 4.1.2. It is possible, although unlikely, that a single exposure to VC could lead to DNA adduct<br />
formati<strong>on</strong> and subsequent tumor formati<strong>on</strong>. While the TD does not routinely examine the possibility of an<br />
increased risk of cancer after acute exposure to a chemical, the TD thought that VC deserved special<br />
c<strong>on</strong>siderati<strong>on</strong> because of its mutagenic MOA and the fact that the acute ReV and acute ESL are<br />
significantly higher than the chr<strong>on</strong>ic ESLlinear(c).<br />
AEGL (2004) provides a detailed discussi<strong>on</strong> of the possibility of an increased risk of cancer after a single<br />
exposure to VC. They estimated an air c<strong>on</strong>centrati<strong>on</strong> that corresp<strong>on</strong>ds to a 1 x 10 -5 cancer risk for a single<br />
1-h exposure to VC of 32.1 ppm based <strong>on</strong> an analysis of liver angiosarcoma incidence in newborn rats
<str<strong>on</strong>g>Vinyl</str<strong>on</strong>g> chloride<br />
Page 9<br />
exposed to VC for 5 weeks by inhalati<strong>on</strong> (Malt<strong>on</strong>i et al. 1981). AEGL (2004) emphasized that there are<br />
c<strong>on</strong>siderable uncertainties in estimating cancer risk from a single exposure. The acute ReV of 26 ppm and<br />
acute -5<br />
ESL of 7.8 ppm are below 32.1 ppm, the estimated air c<strong>on</strong>centrati<strong>on</strong> associated with a 1 x 10 cancer<br />
risk for a single 1-h exposure.<br />
Table 3. Derivati<strong>on</strong> of the Acute ReV and acute ESL<br />
Study Baretta et al. (1969)<br />
Study populati<strong>on</strong> 4-8 healthy human volunteers<br />
Study quality Medium<br />
Exposure Methods Exposure chamber<br />
Critical Effects Mild headache and dryness of eyes and nose<br />
POD (original study) 261 ppm (NOAEL)<br />
Exposure Durati<strong>on</strong> 7.5 h<br />
261 ppm (no durati<strong>on</strong> adjustment)<br />
PODADJ<br />
PODHEC<br />
261 ppm<br />
Total UFs 10<br />
Interspecies UF Not applicable<br />
Intraspecies UF 10<br />
LOAEL UF Not applicable<br />
Incomplete Database UF 1<br />
Database <strong>Quality</strong> High<br />
Acute ReV [1 h] (HQ = 1) 68,000 µg/m 3 (26,000 ppb)<br />
Acute<br />
ESL [1 h] (HQ = 0.3)<br />
3<br />
20,000 µg/m (7800 ppb)<br />
3.2 Welfare-Based Acute ESLs<br />
3.2.1 Odor Percepti<strong>on</strong><br />
VC has a sweet, chloroform-like odor with 50% detecti<strong>on</strong> odor thresholds reported from 260 ppm to 3000<br />
ppm (Van Gemert 1977, Amoore and Hautula 1983). Since these sources are not accepted odor reference<br />
sources listed in the TCEQ ESL guidelines (TCEQ 2006) and other acceptable odor references were not<br />
identified, the TD did not develop an acute ESLodor value.<br />
3.2.2 Vegetati<strong>on</strong> Effects<br />
No acute vegetative studies were identified for VC.<br />
3.3 Short-Term ESL and Values for Air M<strong>on</strong>itoring Evaluati<strong>on</strong><br />
The acute evaluati<strong>on</strong> resulted in the derivati<strong>on</strong> of the following values:<br />
• acute ReV = 68,000 µg/m 3 (26,000 ppb)<br />
•<br />
acute ESL = 20,000 µg/m 3 (7800 ppb)<br />
The short-term ESL for air permit reviews is the health-based acute ESL of 20,000 µg/m 3 (7800 ppm)<br />
(Table 1). The acute ReV of 68,000 µg/m 3 (26,000 ppm) is the acute comparis<strong>on</strong> value for the evaluati<strong>on</strong><br />
of ambient air m<strong>on</strong>itoring data (Table 1). The acute ESL (HQ = 0.3) is not used to evaluate ambient air<br />
m<strong>on</strong>itoring data.
<str<strong>on</strong>g>Vinyl</str<strong>on</strong>g> chloride<br />
Page 10<br />
3.4 Comparis<strong>on</strong> of Results<br />
The Agency for Toxic Substances and Disease Registry (ATSDR 2006) has developed an acute inhalati<strong>on</strong><br />
minimal risk level (MRL) for VC of 500 ppb for a c<strong>on</strong>tinuous 9-day exposure based <strong>on</strong> a NOAEL of 50<br />
ppm for developmental effects in mice (John et al. 1977 and 1981). The TD did not use these studies in<br />
the development of the acute ReV for reas<strong>on</strong>s stated in Secti<strong>on</strong> 3.1.1.2. California Envir<strong>on</strong>mental<br />
Protecti<strong>on</strong> Agency (CalEPA) published an acute Reference Exposure Level (REL) for VC of 72 ppm in<br />
1999 based <strong>on</strong> a NOAEL of 261 ppm for reports of mild headaches and dryness of eyes and nose in<br />
human volunteers (Baretta et al. 1969). An Acute Exposure Guideline Level (AEGL)-1 of 250 ppm was<br />
developed based <strong>on</strong> the Baretta et al. (1969) study with a total UF of 3 (AEGL 2004). The TD ReV of 26<br />
ppm is comparable to the values based <strong>on</strong> human data.<br />
Chapter 4 Chr<strong>on</strong>ic Evaluati<strong>on</strong><br />
4.1 N<strong>on</strong>carcinogenic Potential<br />
4.1.1 Physical/Chemical Properties and Key Studies<br />
The physical/chemical properties of VC are summarized in Chapter 3.<br />
4.1.1.1 Human Studies<br />
A large number of occupati<strong>on</strong>al exposure studies are available in the literature and have identified a wide<br />
range of target organs that may be affected by chr<strong>on</strong>ic inhalati<strong>on</strong> exposure to VC (see USEPA 2000 and<br />
ATSDR 2006 for reviews). The target organs include the liver, lungs, blood, immune system,<br />
cardiovascular system, skin, b<strong>on</strong>es, nervous system, and reproductive organs, although the liver appears<br />
to be the most sensitive organ to VC toxicity. Characteristic hepatic lesi<strong>on</strong>s are produced by VC exposure<br />
and include the following characteristics: hypertrophy and hyperplasia of hepatocytes, activati<strong>on</strong> and<br />
hyperplasia of sinusoidal lining cells, fibrosis of the portal tracts and the septa and intralobular<br />
perisinusoidal regi<strong>on</strong>s, sinusoidal dilati<strong>on</strong>, and focal areas of hepatocellular degenerati<strong>on</strong> (Gedigke et al.<br />
1975, Berk et al. 1975, Falk et al. 1974, Ho et al. 1991, J<strong>on</strong>es and Smith 1982, Lilis et al. 1975, Liss et al.<br />
1985, Marstellar et al. 1975, Popper and Thomas 1975, Suciu et al. 1975, Tamburro et al. 1984, Vihko et<br />
al. 1984). According to the TCEQ ESL guidelines (TCEQ 2006), human data are the preferred source <strong>on</strong><br />
which to base toxicity factors; however, relevant human occupati<strong>on</strong>al studies do not provide accurate<br />
informati<strong>on</strong> <strong>on</strong> VC exposure levels and use of the data is limited. Therefore, data from an animal study<br />
were used to derive the chr<strong>on</strong>ic ESL for n<strong>on</strong>carcinogenic potential.<br />
4.1.1.2 Animal Studies<br />
Refer to Table 4 for animal studies c<strong>on</strong>sidered in the development of the chr<strong>on</strong>ic ESL for n<strong>on</strong>carcinogenic<br />
potential.<br />
4.1.1.2.1 Key Study<br />
Thornt<strong>on</strong> et al. (2002) c<strong>on</strong>ducted a two-generati<strong>on</strong> reproductive study in Sprague-Dawley rats. F0<br />
(parental generati<strong>on</strong>) male and female rats were exposed via inhalati<strong>on</strong> to VC c<strong>on</strong>centrati<strong>on</strong>s of 0, 10,<br />
100, or 1100 ppm for 6 h/day for a 10-week premating period and a 3-week mating period. The F0<br />
generati<strong>on</strong> male rats were exposed to VC until terminal euthanasia. F0 female rats were exposed from GD<br />
0 through GD 20 and lactati<strong>on</strong> day (LD) 4 through LD 25 (for a total of approximately 19 weeks with a
<str<strong>on</strong>g>Vinyl</str<strong>on</strong>g> chloride<br />
Page 11<br />
break for delivery of litters). Reproductive tissues, adrenal glands, brain, kidneys, liver, lungs, spleen,<br />
thymus, mammary glands, nasal tissues, and pituitary glands from F0 rats were weighed and examined<br />
histologically. At weaning, fifteen male and fifteen female F1 (first generati<strong>on</strong> of offspring) rats/group<br />
were selected for gross and microscopic examinati<strong>on</strong>s. Other F1 rats were selected to form 30<br />
rats/sex/group and were subjected to the same treatment as the F0 rats during the producti<strong>on</strong> of the F2<br />
generati<strong>on</strong>. F2 generati<strong>on</strong> rats were subjected to gross and microscopic evaluati<strong>on</strong> at weaning. The results<br />
are as follows: Absolute and relative mean liver weights were significantly increased at all exposure<br />
levels in F0 males and in F1 males exposed to 100 and 1000 ppm VC. Slight centrilobular hypertrophy<br />
was observed in the livers of all male and female F0 and F1 rats exposed to 1000 ppm VC, most male and<br />
female F0 and F1 rats exposed to 100 ppm VC, and in 2/30 and 6/30 female F0 and F1 rats exposed to 10<br />
ppm VC.<br />
The incidence of 6/30 in female F1 rats exposed to 10 ppm VC was statistically significantly different<br />
from c<strong>on</strong>trols (p < 0.05 according to Fisher’s Exact Test performed by ATSDR 2006). The study<br />
identified a LOAEL of 10 ppm for liver effects (centrilobular hypertrophy) in F1 female rats. This study<br />
was selected as the key study for the development of the chr<strong>on</strong>ic ReV for n<strong>on</strong>carcinogenic effects because<br />
it was well-designed and it dem<strong>on</strong>strated toxic effects below the LOAELs reported in other chr<strong>on</strong>ic<br />
animal inhalati<strong>on</strong> studies. Analytical c<strong>on</strong>centrati<strong>on</strong>s were not reported so nominal c<strong>on</strong>centrati<strong>on</strong>s (0, 10,<br />
100, and 1100 ppm) were used in the analysis.<br />
4.1.1.2.2 Supporting Studies<br />
Bi et al. (1985) evaluated the testicular toxicity of VC in male Wistar rats. Rats were exposed by<br />
inhalati<strong>on</strong> to 0, 10, 100, and 3000 ppm VC for 6 h/day, 6 days/week. Rats from each group (8, 30, 6, and<br />
10 respectively) were sacrificed at 3, 6, 9, and 12 m<strong>on</strong>ths. Surviving animals were sacrificed at 18 m<strong>on</strong>ths<br />
(6 m<strong>on</strong>ths after the terminati<strong>on</strong> of exposure). Body weight was recorded <strong>on</strong>ce per m<strong>on</strong>th before and after<br />
exposure. Testes, lungs, liver, heart, kidneys, spleen, and brain were examined visually and<br />
microscopically for lesi<strong>on</strong>s and hemorrhage in all sacrificed animals. See Table 4 for a summary of<br />
NOAELs and LOAELs reported for various endpoints. The lowest LOAEL reported in this study is 10<br />
ppm based <strong>on</strong> increased relative liver, spleen, and heart weight at 6 m<strong>on</strong>ths. These effects were <strong>on</strong>ly<br />
observed and reported for the liver and kidney in the 3000 ppm exposure group at 12 m<strong>on</strong>ths and the<br />
kidney in the 100 ppm exposure group at 18 m<strong>on</strong>ths. Interpretati<strong>on</strong> of the organ weight data for this study<br />
is complicated because the authors did not report absolute organ weights, relative weights for groups with<br />
no significant differences, or standard deviati<strong>on</strong>s. The authors <strong>on</strong>ly discussed the histopathology of the<br />
testicular effects in detail. The authors reported the incidence of damage of testicular tubules in the 0, 10,<br />
100, and 3000 ppm exposure groups to be 18.9, 29.7, 36.5, and 56.0% respectively. The incidence of<br />
damage to seminiferous tubules was statistically significant in the 100 and 3000 ppm exposure groups (p<br />
< 0.05 and p < 0.001).<br />
Sokal et al. (1980) evaluated the toxicity of VC in Wistar rats. Rats were exposed via inhalati<strong>on</strong> to 0, 50,<br />
500, or 20,000 ppm VC for 5 h/day, 5 days/week for 10 m<strong>on</strong>ths. Body weight, appearance, and behavior<br />
were recorded weekly. Hematology and urinalysis were performed at 1, 3, 6, and 10 m<strong>on</strong>ths.<br />
Histopathological examinati<strong>on</strong> of organs was c<strong>on</strong>ducted <strong>on</strong> rats sacrificed after 1.5, 3, 6, and 10 m<strong>on</strong>ths<br />
of exposure. The livers of 36 rats exposed to VC for 3, 6, and 10 m<strong>on</strong>ths and 18 c<strong>on</strong>trols were examined<br />
by electr<strong>on</strong> microscopy. Treatment-related pathomorphological changes were observed in the liver and<br />
testes. Liver effects were observed at lower c<strong>on</strong>centrati<strong>on</strong>s than effects in the testes. A LOAEL of 50 ppm<br />
was reported for this study based <strong>on</strong> a decrease in body weight, increased relative weight of some organs<br />
(spleen and heart), slight hematological and biochemical changes, and ultrastructural changes in<br />
hepatocytes.
<str<strong>on</strong>g>Vinyl</str<strong>on</strong>g> chloride<br />
Page 12<br />
Wisniewska-Knypl et al. (1980) evaluated the toxicity of VC in male Wistar rats. Rats (7-10 per group)<br />
were exposed via inhalati<strong>on</strong> to 0, 50, 500, and 20,000 ppm VC for 5 h/day, 5 days/week for up to 10<br />
m<strong>on</strong>ths. Sacrifices were performed at 1, 3, 6, and 10 m<strong>on</strong>ths. This experiment was designed to examine<br />
the effects of VC <strong>on</strong> the activity of cytochrome P-450 m<strong>on</strong>ooxygenase and the ultrastructure of the liver.<br />
A statistically significant decrease in body weight was reported at 20,000 ppm after 10 m<strong>on</strong>ths. Relative<br />
liver weight was significantly increased at 500 and 20,000 ppm after all sacrifices. Electr<strong>on</strong> microscopic<br />
examinati<strong>on</strong> of the liver tissue from rats exposed to 50 ppm showed hepatocellular changes characterized<br />
by proliferati<strong>on</strong> of the smooth endoplasmic reticulum at 3 m<strong>on</strong>ths (although this effect subsided by 6<br />
m<strong>on</strong>ths) and accumulati<strong>on</strong> of lipid droplets in the cytoplasm after 10 m<strong>on</strong>ths. Rats exposed to 500 and<br />
20,000 ppm for 3 m<strong>on</strong>ths exhibited hypertrophy of the smooth endoplasmic reticulum, distensi<strong>on</strong> of<br />
canals of rough-surfaced membranes, swelling of mitoch<strong>on</strong>dria, and an increased number of lipid droplets<br />
in cytoplasm. These changes persisted through the 10 m<strong>on</strong>ths of the study and were more intensive at<br />
20,000 ppm. A LOAEL of 50 ppm was identified in this study for the 10 m<strong>on</strong>th exposure period based <strong>on</strong><br />
minor liver effects (accumulati<strong>on</strong> of lipid droplets).<br />
Torkels<strong>on</strong> et al. (1961) evaluated the toxicity of VC in rats, guinea pigs, rabbits, and dogs. Animals were<br />
exposed by inhalati<strong>on</strong> to 0, 50, 100, 200, or 500 ppm VC for 1.5 to 7 h/day for 4.5 to 6 m<strong>on</strong>ths. Growth,<br />
mortality, organ weight, and body weight were recorded for all animals. Hematology, histopathology, and<br />
urinalysis were also performed. Histopathological changes and increased liver weights were observed<br />
after repeated exposure to 500 ppm in rats. Repeated exposure to 200 ppm for 6 m<strong>on</strong>ths resulted in<br />
increased average liver weights of rats and micropathological changes in livers of rabbits. Repeated<br />
exposure to 100 ppm 7 h/day for 6 m<strong>on</strong>ths resulted in increased liver weight in rats. The NOAEL reported<br />
for this study is 50 ppm and the LOAEL is 100 ppm for increased relative liver weight in rats.
<str<strong>on</strong>g>Vinyl</str<strong>on</strong>g> chloride<br />
Page 13<br />
Table 4. Summary of Chr<strong>on</strong>ic Animal Inhalati<strong>on</strong> Studies (13 Weeks Durati<strong>on</strong> and L<strong>on</strong>ger)<br />
Study Animal<br />
Strain<br />
Thornt<strong>on</strong> et<br />
al. (2002) a<br />
Sprague-<br />
Dawley<br />
Rats<br />
Bi et al.<br />
(1985)<br />
Sokal et al.<br />
(1980)<br />
Torkels<strong>on</strong> et<br />
al. (1961)<br />
Wisniewska-<br />
Knypl et al.<br />
(1980)<br />
Wistar<br />
Rats<br />
Wistar<br />
Rats<br />
Exposure<br />
Durati<strong>on</strong><br />
16 weeks<br />
(males)<br />
19 weeks<br />
(females)<br />
2 gen<br />
6 h/day<br />
6 m<strong>on</strong>ths<br />
6 days/week<br />
6 h/day<br />
3, 6 m<strong>on</strong>ths<br />
6 days/week<br />
6 h/day<br />
12 m<strong>on</strong>ths<br />
6 days/week<br />
6 h/day<br />
10 m<strong>on</strong>ths<br />
5 days/week<br />
5 h/day<br />
Rat (NS) 6 m<strong>on</strong>ths<br />
5 days/week<br />
0.5-7 h/day<br />
Wistar<br />
Rats<br />
10 m<strong>on</strong>ths<br />
5 days/week<br />
5 h/day<br />
System NOAEL LOAEL<br />
(ppm) (ppm)<br />
Hepatic -- 10 b<br />
(females)<br />
Resp<strong>on</strong>se at<br />
LOAEL<br />
Centrilobular<br />
hypertrophy in F1<br />
female rats<br />
Cardio -- 10 Increased relative<br />
heart rate<br />
Hepatic -- 10 Increased relative<br />
liver weight<br />
Immunological/ -- 10 Increased relative<br />
Lymphoreticular<br />
spleen weight<br />
Reproductive 10 100 Decreased relative<br />
testes weight<br />
Hepatic 100 3000 Increased relative<br />
liver weight<br />
Renal 10 3000 Increased relative<br />
kidney weight<br />
Body Weight 10 100 14% decrease in<br />
body weight<br />
Reproductive 10 100 Degenerative<br />
seminiferous tubule<br />
changes<br />
Hepatic -- 50 Fatty changes in<br />
liver<br />
Renal 50 500 Increased kidney<br />
weight<br />
Body Weight -- 50 10% decrease in<br />
body weight<br />
Immunological/ -- 50 Increased spleen<br />
Lymphoreticular<br />
weight<br />
Reproductive 50 500 Spermatogenic<br />
necrosis<br />
Hepatic 50 100 Increased relative<br />
liver weight<br />
Hepatic -- 50 Fatty changes in<br />
liver<br />
a Key study used to derive the chr<strong>on</strong>ic ReV. ATSDR used this study to derive an intermediate-durati<strong>on</strong><br />
inhalati<strong>on</strong> MRL of 0.03 ppm.<br />
b POD for key study
<str<strong>on</strong>g>Vinyl</str<strong>on</strong>g> chloride<br />
Page 14<br />
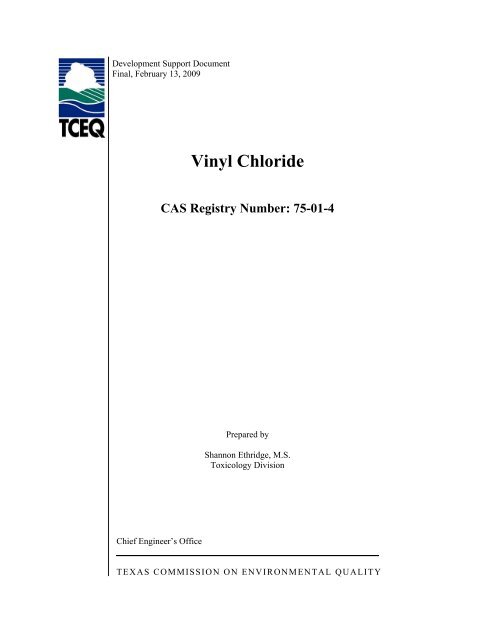
4.1.2 MOA Analysis and Dose Metric<br />
Evidence is str<strong>on</strong>g that the liver toxicity and carcinogenicity of VC are related to the producti<strong>on</strong> of<br />
reactive metabolic intermediates. Up<strong>on</strong> absorpti<strong>on</strong> and distributi<strong>on</strong>, VC is metabolized by the cytochrome<br />
P450 oxidati<strong>on</strong> system in the liver (Ivanetich et al. 1977, Sabadie et al. 1980, Salm<strong>on</strong> 1976). VC is<br />
primarily metabolized to chloroethylene oxide (CEO), which is a highly reactive, short-lived epoxide<br />
intermediate. Some CEO sp<strong>on</strong>taneously rearranges to form chloroacetaldehyde (CAA). Metabolites of<br />
VC are detoxified by a reacti<strong>on</strong> with glutathi<strong>on</strong>e (GSH) catalyzed by glutathi<strong>on</strong>e-S-transferase. The GSH<br />
c<strong>on</strong>jugates may then undergo hydrolysis to be excreted in urine. The metabolites may bind to<br />
macromolecules in the body; CEO is thought to bind primarily to deoxyrib<strong>on</strong>ucleic acid (DNA) and<br />
rib<strong>on</strong>ucleic acid (RNA) and CAA is thought to bind primarily with protein. The mechanism for liver<br />
toxicity is thought to be related to the producti<strong>on</strong> of reactive metabolites that covalently bind to liver<br />
proteins. Animal studies indicate that metabolism of VC is a dose-dependent saturable process (ATSDR<br />
2006). Saturati<strong>on</strong> is thought to occur in humans at air c<strong>on</strong>centrati<strong>on</strong>s above 250 ppm (Clewell et al.<br />
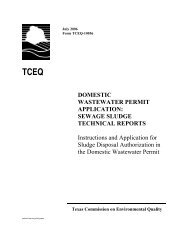
2001). See Figure 1 for a descripti<strong>on</strong> of VC metabolism.<br />
<str<strong>on</strong>g>Vinyl</str<strong>on</strong>g> <str<strong>on</strong>g>Chloride</str<strong>on</strong>g><br />
P450<br />
Adapted from USEPA (2000)<br />
H 2 0<br />
DNA Adducts<br />
Chloroethylene<br />
oxide<br />
(CEO)<br />
CO 2<br />
Epoxide<br />
Hydrolase<br />
GSH<br />
Figure 1. Metabolism of <str<strong>on</strong>g>Vinyl</str<strong>on</strong>g> <str<strong>on</strong>g>Chloride</str<strong>on</strong>g><br />
Tissue Adducts<br />
Chloroacetaldehyde<br />
(CAA)<br />
GSH<br />
Glutathi<strong>on</strong>e<br />
C<strong>on</strong>jugates<br />
The most appropriate pharmacokinetic dose metric for a reactive metabolite is the total amount of the<br />
metabolite generated divided by the volume of tissue in which it is produced (Anders<strong>on</strong> et al. 1987 as<br />
reported in USEPA 2000); however, <strong>on</strong>ly data <strong>on</strong> exposure c<strong>on</strong>centrati<strong>on</strong> of the parent chemical are<br />
available from the key study. Since data <strong>on</strong> other more specific dose metrics (metabolite c<strong>on</strong>centrati<strong>on</strong>s
<str<strong>on</strong>g>Vinyl</str<strong>on</strong>g> chloride<br />
Page 15<br />
divided by the volume of tissue in which it is produced) are not available for this study, exposure<br />
c<strong>on</strong>centrati<strong>on</strong> of the parent chemical will be used as the default dose metric.<br />
4.1.3 POD for Key and Supporting Studies<br />
Benchmark dose (BMD) modeling was c<strong>on</strong>ducted to determine the air c<strong>on</strong>centrati<strong>on</strong> associated with the<br />
95% upper c<strong>on</strong>fidence limit (UCL) for extra risk of the benchmark c<strong>on</strong>centrati<strong>on</strong> at a 10% resp<strong>on</strong>se<br />
(BMCL10) from the Thornt<strong>on</strong> et al. (2002) study using USEPA Benchmark Dose Software versi<strong>on</strong> 1.4.1b<br />
(Table 5). Modeling was performed <strong>on</strong> centrilobular hypertrophy data from F1 female rats (Appendix A).<br />
As noted in Table 5 and Appendix A, the multistage model provided the best fit as assessed by a chisquare<br />
goodness of fit test and the Akaike Informati<strong>on</strong> Criteria (AIC). Therefore, the BMCL10 value of<br />
2.72 ppm, derived from the multistage model, was selected as the POD for calculating the chr<strong>on</strong>ic ReV.<br />
The BMCL10 was chosen as the POD as opposed to the BMCL05 because the critical effects in the key<br />
study were c<strong>on</strong>sidered mildly adverse based <strong>on</strong> the TCEQ ESL guidelines (2006).<br />
Table 5. Benchmark Dose Modeling Results<br />
BMDS Model AIC Goodness of<br />
fit p-value<br />
Chi-Square pvalue<br />
(Scaled Residual)<br />
BMC BMCL10<br />
Weibull 34.02 0.9992 0.000 c 6.72 3.02<br />
Probit 34.02 0.9997 0.000 c 8.57 5.09<br />
Log-logistic 34.02 0.9997 -0.000 c 9.14 5.21<br />
Gamma a 34.02 0.9995 0.000 c 7.77 3.14<br />
Multistage b 32.02 1.0000 -0.000 c 6.87 2.72<br />
Quantal Linear 35.27 0.3286 -1.126 d 3.03 2.04<br />
a Restrict power >=1<br />
b Restrict betas >=0; Degree of polynomial = 2<br />
c Scaled residual at estimated probability of 0.2<br />
d Scaled residual at estimated probability of 0.29<br />
4.1.4 Dosimetric Adjustments<br />
4.1.4.1 Exposure Durati<strong>on</strong> Adjustments<br />
The POD (BMCL10) from the Thornt<strong>on</strong> et al. (2002) study was adjusted to a c<strong>on</strong>tinuous exposure<br />
c<strong>on</strong>centrati<strong>on</strong>:<br />
PODADJ = POD x D/24 x F/7<br />
PODADJ = 2.72 ppm × 6/24 × 7/7<br />
PODADJ = 0.680 ppm<br />
where: PODADJ = POD from an animal study, adjusted to a c<strong>on</strong>tinuous exposure durati<strong>on</strong><br />
POD = POD from an animal study, based <strong>on</strong> a disc<strong>on</strong>tinuous exposure durati<strong>on</strong><br />
D = exposure durati<strong>on</strong>, hours per day<br />
F = exposure frequency, days per week
<str<strong>on</strong>g>Vinyl</str<strong>on</strong>g> chloride<br />
Page 16<br />
4.1.4.2 Default Dosimetry Adjustments from Animal-to-Human Exposure<br />
A dosimetry adjustment from an animal c<strong>on</strong>centrati<strong>on</strong> to a human equivalent c<strong>on</strong>centrati<strong>on</strong> (PODHEC) was<br />
performed for VC, which is a vapor producing remote effects. The measured blood/air partiti<strong>on</strong><br />
coefficients in the rat and human are 2.4 and 1.16, respectively (ATSDR 2006). Because the ratio of the<br />
animal-to-human partiti<strong>on</strong> coefficients (2.4/1.16 = 2.1) is greater than <strong>on</strong>e, a default value of <strong>on</strong>e is used<br />
as the regi<strong>on</strong>al gas dose ratio (RGDR) (i.e., (H b/g)A/(H b/g)H) as recommended by the TCEQ ESL<br />
guidelines (2006). The resulting PODHEC from the PODADJ of 0.680 ppm in the Thornt<strong>on</strong> et al. (2002)<br />
study is 0.680 ppm.<br />
4.1.5 Adjustment of PODHEC and Critical Effect<br />
4.1.5.1 Critical Effect<br />
The critical effect identified in the key study (Thornt<strong>on</strong> et al. 2002) was centriolobular hypertrophy in the<br />
liver. Since this effect is c<strong>on</strong>sidered to have a threshold (i.e., a n<strong>on</strong>linear MOA), uncertainty factors were<br />
applied to the PODHEC to derive the chr<strong>on</strong>ic ReV.<br />
4.1.5.2 Uncertainty Factors<br />
A subchr<strong>on</strong>ic-to-chr<strong>on</strong>ic UF was not applied because the animals were exposed for a total of 19 weeks<br />
which is more than 10% of the animals’ lifetime. A UF of 3 for interspecies variability (UFA) was applied<br />
because a default dosimetric adjustment was c<strong>on</strong>ducted to account for toxicokinetic differences between<br />
animals and humans but not toxicodynamic differences. A UF of 10 for intraspecies variability (UFH) was<br />
applied to account for sensitive members of the populati<strong>on</strong>. BMD modeling was used to derive the<br />
PODHEC based <strong>on</strong> a mild adverse effect (centrilobular hypertrophy in the liver); therefore, a LOAEL-to-<br />
NOAEL UF (UFL) of 1 was applied. The database is robust for this chemical and the key study was well<br />
designed; therefore, a UFD of 1 was applied. A total UF of 30 was applied to the PODHEC.<br />
chr<strong>on</strong>ic ReV = PODHEC<br />
UFH x UFA x UFD x UFL<br />
chr<strong>on</strong>ic ReV = 0.680 ppm<br />
30<br />
chr<strong>on</strong>ic ReV = 0.0227 ppm = 22.7 ppb<br />
4.1.6 Health-Based Chr<strong>on</strong>ic ReV and chr<strong>on</strong>ic ESLn<strong>on</strong>linear(nc)<br />
Rounding to two significant figures at the end of all calculati<strong>on</strong>s yields a chr<strong>on</strong>ic ReV of 23 ppb (60<br />
µg/m 3 ). At the target HQ of 0.3, the chr<strong>on</strong>ic ESLn<strong>on</strong>linear(nc) is 6.9 ppb (18 µg/m 3 ) (Table 6).<br />
4.1.7 Comparis<strong>on</strong> of Results<br />
USEPA (2000) has derived a reference c<strong>on</strong>centrati<strong>on</strong> (RfC) of 100 µg/m 3 (40 ppb) for VC. The RfC<br />
derivati<strong>on</strong> was based <strong>on</strong> a route-to-route extrapolati<strong>on</strong> (using PBPK modeling) from a NOAELHEC of 2.5<br />
mg/m 3 for liver cell polymorphism in rats administered VC in the diet for a lifetime (Til et al. 1983 and<br />
1991) (the Thornt<strong>on</strong> et al. (2002) inhalati<strong>on</strong> study was not available when USEPA (2000) developed the<br />
RfC). ATSDR (2006) published an inhalati<strong>on</strong> intermediate-durati<strong>on</strong> MRL of 30 ppb based <strong>on</strong> a BMCL10<br />
value of 5 ppm derived from the centrilobular hypertrophy data from F1 female rats in Thornt<strong>on</strong> et al.
<str<strong>on</strong>g>Vinyl</str<strong>on</strong>g> chloride<br />
Page 17<br />
(2002). The TD chose to use Thornt<strong>on</strong> et al. (2002) as the key study because it was a recently published,<br />
well-c<strong>on</strong>ducted animal inhalati<strong>on</strong> study. The TCEQ chr<strong>on</strong>ic ReV of 23 ppb is similar to the USEPA RfC<br />
of 40 ppb and the ATSDR MRL of 30 ppb.<br />
Table 6. Derivati<strong>on</strong> of the Chr<strong>on</strong>ic ReV and chr<strong>on</strong>ic ESLn<strong>on</strong>linear(nc)<br />
Study Thornt<strong>on</strong> et al. (2002)<br />
Study Populati<strong>on</strong> Female Sprague-Dawley rats<br />
Study <strong>Quality</strong> High<br />
Exposure Method Inhalati<strong>on</strong><br />
Critical Effects Centrilobular hypertrophy in the liver<br />
POD 2.72 ppm (BMCL10)<br />
Exposure Durati<strong>on</strong> 6 h/day, 7 days/week for 19 weeks<br />
Extrapolati<strong>on</strong> to c<strong>on</strong>tinuous exposure (PODADJ) 0.680 ppm<br />
PODHEC<br />
0.680 ppm<br />
Total UFs 30<br />
Interspecies UF 3<br />
Intraspecies UF 10<br />
LOAEL UF 1<br />
Subchr<strong>on</strong>ic to chr<strong>on</strong>ic UF Not applicable<br />
Incomplete Database UF 1<br />
Database <strong>Quality</strong> High<br />
Chr<strong>on</strong>ic ReV (HQ = 1) 60 µg/m 3 (23 ppb)<br />
chr<strong>on</strong>ic<br />
ESLn<strong>on</strong>linear(nc) (HQ = 0.3) 18 µg/m 3 (6.9 ppb)<br />
4.2 Carcinogenic Potential<br />
4.2.1 Carcinogenic Weight-of-Evidence<br />
VC is a known human carcinogen as evaluated by numerous sources including the USEPA, the<br />
Internati<strong>on</strong>al Agency for Research <strong>on</strong> Cancer (IARC), and the Nati<strong>on</strong>al Toxicology Program (NTP).<br />
Epidemiologic studies provide clear and c<strong>on</strong>sistent evidence of a causal associati<strong>on</strong> between VC exposure<br />
and the development of angiosarcoma and hepatocellular carcinoma (USEPA 2000, ATSDR 2006). As<br />
reviewed in ATSDR (2006), other cancers have previously been reported in VC workers, including<br />
cancers of the brain and central nervous system, respiratory tract, c<strong>on</strong>nective and other soft tissues, and<br />
the lymphatic/hematopoietic system. However, recent follow-up studies do not dem<strong>on</strong>strate a clear<br />
associati<strong>on</strong> between VC exposure and tumor formati<strong>on</strong> (Boffetta et al. 2003, Lewis 2001, Lewis and<br />
Rempala 2003, Lewis et al. 2003, Mundt et al. 2000, Ward et al. 2001). VC has also been shown to cause<br />
cancer by the oral and inhalati<strong>on</strong> routes of exposure in multiple animal species including rats, mice, and<br />
hamsters with the target organ being the same as in humans (the liver). Experimental evidence in both in<br />
vivo and in vitro systems indicate that VC is mutagenic and can form DNA adducts (by VC and its<br />
metabolites). Animal studies have also provided evidence of increased sensitivity during early-life<br />
exposure (ATSDR 2006). Evidence is c<strong>on</strong>sidered str<strong>on</strong>g for the carcinogenicity of VC.
<str<strong>on</strong>g>Vinyl</str<strong>on</strong>g> chloride<br />
Page 18<br />
4.2.2 MOA Analysis<br />
VC carcinogenicity is thought to occur by a genotoxic mechanism as discussed previously in Secti<strong>on</strong><br />
4.1.2. VC is metabolized to a reactive metabolite (CEO) which then binds to DNA forming DNA adducts<br />
that, if not repaired, can lead to mutati<strong>on</strong>s and tumor formati<strong>on</strong> (USEPA 2000). Because carcinogenicity<br />
is thought to occur by a mutagenic MOA, and other more specific biologically-based models are not<br />
available, it is appropriate to use a linear (n<strong>on</strong>-threshold) approach to develop the chr<strong>on</strong>ic ESLlinear(c).<br />
4.2.3 Key Studies<br />
4.2.3.1 Human Epidemiologic Studies<br />
Human epidemiology studies dem<strong>on</strong>strate a clear associati<strong>on</strong> between VC exposure and liver cancer (i.e.,<br />
angiosarcoma and hepatocellular carcinoma) (see USEPA 2000 and ATSDR 2006 for complete reviews).<br />
Quantitative exposure informati<strong>on</strong> is <strong>on</strong>ly available for a few studies and is associated with a high level of<br />
uncertainty. Due to uncertainties associated with human exposure informati<strong>on</strong>, the TD adopted the risk<br />
estimate derived by USEPA (2000) using animal data which was subsequently used to develop the<br />
chr<strong>on</strong>ic ESLlinear(c). Cancer potency estimates derived from human studies are presented in Secti<strong>on</strong> 4.2.4.1 for<br />
comparis<strong>on</strong>.<br />
4.2.3.2 Animal Studies<br />
VC is carcinogenic by the oral and inhalati<strong>on</strong> routes of exposure in multiple animal species including rats,<br />
mice, and hamsters with the target organ being the same as in humans (the liver). Malt<strong>on</strong>i et al. (1981,<br />
1984) c<strong>on</strong>ducted the most comprehensive set of experiments in animals. Malt<strong>on</strong>i et al. (1981, 1984)<br />
evaluated the carcinogenicity of VC in Sprague-Dawley and Wistar rats, Swiss mice, and Golden<br />
hamsters. In an initial series of experiments, male and female Sprague-Dawley rats were exposed by<br />
inhalati<strong>on</strong> to 15 different doses of VC (0, 1, 5, 10, 25, 50, 100, 150, 200, 250, 500, 2500, 6000, 10,000,<br />
and 30,000 ppm) for 4 h/day, 5 days/week, for 52 weeks. Other experiments were performed over 5-, 17-,<br />
and 25-week periods.<br />
Experiments were also performed <strong>on</strong> pregnant Sprague-Dawley rats and embryos. The study examined<br />
effects between strains of rats (Sprague-Dawley versus Wistar) and different species (rats, mice, and<br />
hamsters) as well. Animals were kept alive until sp<strong>on</strong>taneous death. Full autopsy was performed <strong>on</strong> each<br />
animal and all parts of the body were examined.<br />
In Sprague Dawley rats, statistically significant increases were reported in the incidence of liver<br />
angiosarcoma, mammary gland carcinomas, Zymbal gland carcinomas, nephroblastoma, neuroblastoma,<br />
and forestomach tumors. The incidence of liver angiosarcoma was comparable between rat strains at<br />
doses up to 10,000 ppm. The incidence of several other tumor types were comparable between rat strains.<br />
In Swiss mice, liver angiosarcoma was reported in greater proporti<strong>on</strong>s at lower-dose levels after 30-week<br />
exposures than in Sprague-Dawley rats exposed for 52 weeks; however, the incidences were comparable<br />
at higher doses. The incidence of liver angiosarcoma in male hamsters was much less after a 30-week<br />
exposure than in male rats or male mice. Mammary gland tumors were reported in <strong>on</strong>ly rats and mice;<br />
Zymbal gland tumors, neuroblastomas, and nephroblastomas were reported in <strong>on</strong>ly rats; lung tumors were<br />
found in <strong>on</strong>ly mice; and melanomas, acoustical duct epithelial tumors, and leukemias were reported in<br />
<strong>on</strong>ly hamsters.<br />
Other animal studies have supported the carcinogenicity of VC (e.g., Bi et al. 1985, Drew et al. 1983,<br />
Holmberg et al. 1976, H<strong>on</strong>g et al. 1981, and Lee et al. 1977 and 1978). However, the Malt<strong>on</strong>i et al. (1981,
<str<strong>on</strong>g>Vinyl</str<strong>on</strong>g> chloride<br />
Page 19<br />
1984) study is c<strong>on</strong>sidered the most comprehensive in terms of dose-resp<strong>on</strong>se informati<strong>on</strong>. The results<br />
from the Malt<strong>on</strong>i et al. (1981, 1984) study were used to develop the chr<strong>on</strong>ic ESLlinear(c).<br />
4.2.4 Dose-Resp<strong>on</strong>se Assessment<br />
4.2.4.1 Dose Metrics and Potency Estimates Based <strong>on</strong> Human Epidemiological<br />
Studies<br />
4.2.4.1.1 USEPA (2000)<br />
Clewell et al. (1995a) developed a PBPK model for OSHA and USEPA to support a cancer risk<br />
assessment of VC. The PBPK model was basically a refined versi<strong>on</strong> of a PBPK model developed for 1,1dichloroethylene<br />
(D’Souza and Anders<strong>on</strong> 1988). The model c<strong>on</strong>sisted of four compartments: the liver, fat,<br />
highly perfused tissue, and poorly perfused tissue. All metabolism was assumed to occur in the liver by<br />
two saturable pathways, <strong>on</strong>e high affinity, low capacity (CYP2E1) and <strong>on</strong>e low affinity, high capacity<br />
(CYP2C11/6 and CYP1A1/2). The reactive metabolites (CEO, CAA, or other intermediates) were<br />
assumed to then either be metabolized further, producing carb<strong>on</strong> dioxide; react with GSH; or react with<br />
other cellular materials, including DNA. Because VC has been shown to deplete GSH levels, a<br />
descripti<strong>on</strong> of GSH kinetics was also included. Other PBPK models have been developed for VC (i.e.,<br />
USEPA 1987, US Air Force 1990, and Reitz et al. 1996), although the Clewell et al. (1995a, 1995b, 2001)<br />
model is the most comprehensive in terms of VC metabolism and is better validated.<br />
Three dose metrics were evaluated in the model: the amount of metabolite divided by the volume of the<br />
liver (RISK), the total amount of metabolite not detoxified by GSH divided by the volume of the liver<br />
(RISKM), or the total amount reacted with GSH divided by the volume of the liver (RISKG). The average<br />
amount of metabolite generated in a single day was used and was averaged over a lifetime (the lifetime<br />
average daily dose). Three epidemiological studies were identified and evaluated that reported a positive<br />
associati<strong>on</strong> between VC exposure and liver cancer and also provided quantitative exposure informati<strong>on</strong><br />
sufficient to support separate exposure c<strong>on</strong>centrati<strong>on</strong> and durati<strong>on</strong> estimates (as opposed to just<br />
cumulative exposure estimates): Fox and Collier 1977, J<strong>on</strong>es et al. 1988, and Sim<strong>on</strong>ato et al. 1991.<br />
Separate exposure c<strong>on</strong>centrati<strong>on</strong> and durati<strong>on</strong> estimates for each subcohort were required to compute a<br />
PBPK-based cumulative dose. J<strong>on</strong>es et al. (1988) was an update of the Fox and Collier (1977) study.<br />
Dose-resp<strong>on</strong>se assessments were developed for these studies despite the fact that exposure was not<br />
adequately characterized. The PBPK model was run for the exposure scenario appropriate to each of the<br />
selected subcohorts and was used to generate the appropriate internal dose metric (RISK) for each study.<br />
The dose metric was then input into a linear relative risk dose resp<strong>on</strong>se model to determine the 95%<br />
UCLs <strong>on</strong> risk estimates. The other dose metrics previously menti<strong>on</strong>ed (RISKM and RISKG) were<br />
c<strong>on</strong>sidered but not used in the USEPA (2000) assessment.<br />
Table 7 lists the range of risk estimates for each of the three epidemiological studies. The lower risk<br />
estimate in each range was calculated using the background probability of liver cancer death derived in<br />
the original study while the higher risk estimate was calculated using an estimate of lifetime liver cancer<br />
mortality rate in the US populati<strong>on</strong> from Chen and Blancato (1989). The risk estimate determined from<br />
human studies by USEPA (2000) is 2.4 x 10 -6 per µg/m 3 based <strong>on</strong> the higher of the two values calculated<br />
for the J<strong>on</strong>es et al. (1988) study. Ultimately, USEPA (2000) used animal data to derive cancer potency<br />
estimates because of the limitati<strong>on</strong>s of the human epidemiology studies, although the risk estimates<br />
derived from the human studies provide support for those derived from animal studies.
<str<strong>on</strong>g>Vinyl</str<strong>on</strong>g> chloride<br />
Page 20<br />
The Sim<strong>on</strong>ato et al. (1991) study was updated in Ward et al. (2001) which was not available at the time of<br />
the USEPA (2000) assessment. Because the Ward et al. (2001) study did not reduce the uncertainty<br />
regarding exposure c<strong>on</strong>centrati<strong>on</strong>s and durati<strong>on</strong> of exposure for the original Sim<strong>on</strong>ato et al. (1991) study,<br />
the TD adopted the USEPA (2000) cancer risk estimate based <strong>on</strong> animal data discussed in Secti<strong>on</strong> 4.2.4.2.<br />
Table 7. Risk Estimates for Angiosarcoma based <strong>on</strong> Epidemiological Studies (USEPA 2000)<br />
3 a<br />
Study 95% UCL risk per µg/m<br />
Fox and Collier (1977) 0.46 to 2.8 x 10 -6<br />
J<strong>on</strong>es et al. (1988) b -6 c<br />
0.65 to 2.4 x 10<br />
Sim<strong>on</strong>ato et al. (1991) 0.27 to 0.53 x 10 -6<br />
a<br />
Risk estimates based <strong>on</strong> RISK dose metric<br />
b<br />
J<strong>on</strong>es et al. (1988) was an update of Fox and Collier (1977).<br />
c<br />
Highest value in range reported by USEPA (2000) as the best risk estimate from human studies.<br />
4.2.4.1.2 Clewell et al. (2001)<br />
Clewell et al. (2001) developed a PBPK model for VC which was described in Secti<strong>on</strong> 4.2.4.1.2 and<br />
applied this PBPK model with slight modificati<strong>on</strong>s in some parameters to develop human risk estimates<br />
for angiosarcoma based <strong>on</strong> human epidemiological studies (Table 8) and animal studies (Secti<strong>on</strong><br />
4.2.4.2.2). Risk estimates developed for angiosarcoma based <strong>on</strong> the RISK dose metric from the Fox and<br />
Collier (1977), J<strong>on</strong>es et al. (1988), and Sim<strong>on</strong>ato et al. (1991) studies are presented in Table 8. Risk<br />
estimates obtained from all three dose metrics were reportedly very similar but <strong>on</strong>ly those based <strong>on</strong> the<br />
RISK dose metric were presented in the study. The lower risk estimate in each range was calculated using<br />
the background probability of liver cancer death derived in the study while the higher risk estimate was<br />
calculated using an estimate of lifetime liver cancer mortality rate in the US populati<strong>on</strong> from Chen and<br />
Blancato (1989).<br />
Table 8. Risk Estimates for Angiosarcoma based <strong>on</strong> Epidemiological Studies (Clewell et al.<br />
2001).<br />
Study<br />
3 a<br />
95% UCL risk per µg/m<br />
Fox and Collier (1977) 0.27 to 1.6 x 10 -6<br />
J<strong>on</strong>es et al. (1988) b 0.37 to 1.38 x 10 -6<br />
Sim<strong>on</strong>ato et al. (1991) 0.15 to 0.30 x 10 -6<br />
a<br />
Risk estimates based <strong>on</strong> RISK dose metric<br />
b<br />
J<strong>on</strong>es et al. (1988) was an update of Fox and Collier (1977) .<br />
4.2.4.2 Dose Metrics and Potency Estimates Based <strong>on</strong> Animal Data<br />
4.2.4.2.1 USEPA (2000)<br />
USEPA (2000) applied the PBPK model for VC developed by Clewell et al. (1995a) to calculate human<br />
risk estimates from animal data. Human risk estimates were calculated based <strong>on</strong> this PBPK model and the
<str<strong>on</strong>g>Vinyl</str<strong>on</strong>g> chloride<br />
Page 21<br />
1-hit versi<strong>on</strong> of the linearized multistage (LMS) model for extra risk using liver tumor incidence data<br />
(liver angiosarcomas, angiomas, hepatomas, and neoplastic nodules) from animal studies (Malt<strong>on</strong>i et al.<br />
1981 and 1984, Fer<strong>on</strong> et al. 1981). Doses were not c<strong>on</strong>verted to human equivalents prior to calculati<strong>on</strong> of<br />
risk. Risk modeling using the LMS or the LED10 method was c<strong>on</strong>ducted based <strong>on</strong> the animal dose metric<br />
(RISK), and the resulting risk was c<strong>on</strong>verted to a human risk value based <strong>on</strong> an equivalence factor. The<br />
other dose metrics previously menti<strong>on</strong>ed (RISKM and RISKG) were c<strong>on</strong>sidered but not used in the<br />
assessment. The LED10/linear method draws a straight line from the point of departure from the observed<br />
data (in this case, the LED10 or the lower 95% limit <strong>on</strong> a dose that is estimated to cause a 10% resp<strong>on</strong>se)<br />
to the origin.<br />
The equivalence factor for inhalati<strong>on</strong> exposure was calculated by determining the human dose metric for<br />
c<strong>on</strong>tinuous human inhalati<strong>on</strong> exposure to a range of exposure c<strong>on</strong>centrati<strong>on</strong>s (1 µg/m 3 (0.38 ppb) to<br />
10,000 mg/m 3 (3846 ppm)). This calculati<strong>on</strong> showed that the model was linear up to nearly 100 mg/m 3<br />
(38.46 ppm), and the calculated equivalence factor was used to c<strong>on</strong>vert the risk from the inhalati<strong>on</strong><br />
experiments c<strong>on</strong>ducted in animals (in the units of the dose metric) to human risk values.<br />
The inhalati<strong>on</strong> unit risk estimate of 4.4 x 10 -6 per µg/m 3 based <strong>on</strong> liver tumor incidence data from female<br />
rats (Malt<strong>on</strong>i et al. 1981 and 1984) was derived by modeling the RISK dose metric with the LMS model<br />
(extra risk), and for comparis<strong>on</strong>, a risk estimate of 4.2 x 10 -6 per µg/m 3 was derived using the<br />
LED10/linear method (see Table 10 for data used in assessment). Risk estimates based <strong>on</strong> data from<br />
female rats were recommended over those based <strong>on</strong> male rats or female or male mice because they are the<br />
most c<strong>on</strong>servative. The risk estimate is based <strong>on</strong> c<strong>on</strong>tinuous lifetime exposure beginning at adulthood.<br />
However, the applicati<strong>on</strong> of a two-fold uncertainty factor to this value is recommended if exposure begins<br />
in early life (see Secti<strong>on</strong> 4.2.5).
<str<strong>on</strong>g>Vinyl</str<strong>on</strong>g> chloride<br />
Page 22<br />
Table 9. Dose and Tumor Incidence Data from Inhalati<strong>on</strong> of VC by Female Sprague-<br />
Dawley Rats (Malt<strong>on</strong>i et al. 1981 and 1984/Experiments BT1, BT2, and BT15) as Reported<br />
in USEPA (2000)<br />
Exposure C<strong>on</strong>centrati<strong>on</strong><br />
(ppm) a<br />
Metabolite<br />
(mg/L liver) b<br />
Human Equivalent<br />
C<strong>on</strong>centrati<strong>on</strong> (ppm) c<br />
Tumor Incidence d<br />
0 0 0 0/141<br />
1 0.59 0.2 0/55<br />
5 2.96 0.98 0/47<br />
10 5.90 1.95 1/46<br />
25 14.61 4.6 5/40<br />
50 31.27 10.1 1/29<br />
100 55.95 19 1/43<br />
150 76.67 26 5/46<br />
200 90.00 31 10/44<br />
250 103.45 35 3/26<br />
500 116.94 40 11/28<br />
2500 134.37 48 10/24<br />
6000 143.72 51 13/25<br />
a<br />
Animals exposed 4 h/day, 5 days/week, for 52 weeks<br />
b<br />
Dose metric (lifetime average delivered dose in female rats) calculated from PBPK modeling of the administered<br />
animal c<strong>on</strong>centrati<strong>on</strong>.<br />
c<br />
C<strong>on</strong>tinuous human exposure c<strong>on</strong>centrati<strong>on</strong> over a lifetime required to produce an equivalent mg metabolite/L of<br />
liver.<br />
d<br />
Based <strong>on</strong> number of animals alive after detecti<strong>on</strong> of first liver tumor.<br />
4.2.4.2.2 Clewell et al. (2001)<br />
Clewell et al. (2001) used their PBPK model to calculate each of the three dose metrics for angiosarcoma<br />
(RISK, RISKM, and RISKG) from animal studies (Malt<strong>on</strong>i et al. 1981 and 1984, Malt<strong>on</strong>i and Cotti 1988,<br />
Fer<strong>on</strong> et al. 1981). The 95% UCLs <strong>on</strong> human risk estimates for lifetime exposure were then calculated <strong>on</strong><br />
the basis of each of the sets of animal data using the linear multi-stage (LMS) model. Risk estimates<br />
obtained from all three dose metrics were reportedly very similar but <strong>on</strong>ly those based <strong>on</strong> the RISK dose<br />
metric were presented. The human risk estimates derived from animal studies, based <strong>on</strong> the RISK dose<br />
metric, ranged from 0.42 x 10 -6 to 1.99 x 10 -6 per µg/m 3 (Table 9) with a geometric mean of 1.1 x 10 -6 per<br />
µg/m 3 .<br />
Table 10. Human Risk Estimates for Inhalati<strong>on</strong> Exposure based <strong>on</strong> Angiosarcoma<br />
Incidence in Animal Studies (Clewell et al. 2001).<br />
Study Route of Exposure Species and Strain<br />
3 a<br />
95% UCL risk per µg/m<br />
Male Mice 0.59 x 10 -6<br />
Malt<strong>on</strong>i and Cotti Inhalati<strong>on</strong><br />
(1988)<br />
Female Mice 1.26 x 10 -6<br />
Male Rats 1.99 x 10 -6<br />
Malt<strong>on</strong>i et al. Inhalati<strong>on</strong><br />
(1981, 1984)<br />
Female Rats 0.86 x 10 -6<br />
Male Rats 1.17 x 10 -6<br />
Fer<strong>on</strong> et al. (1981) Ingesti<strong>on</strong><br />
Female Rats 0.42 x 10 -6<br />
a<br />
Risk estimates based <strong>on</strong> RISK dose metric
<str<strong>on</strong>g>Vinyl</str<strong>on</strong>g> chloride<br />
Page 23<br />
4.2.4.2.3 Comparis<strong>on</strong> of USEPA (2000) and Clewell et al. (2001)<br />
The USEPA (2000) and Clewell (2001) risk estimates based <strong>on</strong> female rat data from Malt<strong>on</strong>i et al. (1981,<br />
1984) differ by a factor of about 5. The more c<strong>on</strong>servative USEPA (2000) estimate may be explained by<br />
the fact that they modeled tumor incidence data for several liver tumor types (liver angiosarcomas,<br />
angiomas, hepatomas, and neoplastic nodules) and used data from three different inhalati<strong>on</strong> experiments<br />
in rats c<strong>on</strong>ducted by Malt<strong>on</strong>i et al. (1984) (BT1, BT2, and BT15), whereas Clewell et al. (2001) <strong>on</strong>ly<br />
modeled liver angiosarcoma incidence data and used data from two inhalati<strong>on</strong> experiments in rats<br />
c<strong>on</strong>ducted by Malt<strong>on</strong>i et al. (1984) (BT1 and BT15).<br />
Hepatomas, angiomas, and neoplastic nodules were not statistically significantly increased in the Malt<strong>on</strong>i<br />
et al. (1981, 1984) studies. However, because hepatocellular tumors were significantly increased in the<br />
Fer<strong>on</strong> et al. feeding study evaluated in the cancer assessment, USEPA (2000) c<strong>on</strong>cluded that all liver<br />
tumors in the Malt<strong>on</strong>i et al. studies are likely the result of exposure to VC as well, and should be included<br />
as a c<strong>on</strong>servative approach. The USEPA (2000) assessment underwent two formal external panel peer<br />
reviews in which the issue of inclusi<strong>on</strong> of hepatomas and neoplastic nodules in the cancer risk assessment<br />
was raised. Three reviewers believed that including all liver tumors would result in an overestimate of<br />
cancer risk, two reviewers believed that it might address the possibility of tumor inducti<strong>on</strong> at other sites,<br />
and the other reviewers were either uncertain or had no opini<strong>on</strong>. The USEPA (2000) resp<strong>on</strong>se to this<br />
c<strong>on</strong>cern was that there is evidence in both human epidemiological and animal feeding studies that<br />
hepatocellular tumors as well as angiosarcomas are induced by VC and that the inclusi<strong>on</strong> of all liver<br />
tumors, even from studies in which hepatocellular tumors were not significantly increased, is appropriate.<br />
USEPA (2000) also noted that there were relatively few tumor types other than angiosarcomas included<br />
in the assessment and that their effect up<strong>on</strong> cancer potency was minimal.<br />
The most c<strong>on</strong>servative risk estimate from an animal inhalati<strong>on</strong> study derived by Clewell et al. (2001) was<br />
from male rats (1.99 x 10 -6 risk per µg/m 3 ). This risk estimate is <strong>on</strong>ly a factor of about 2 greater than the<br />
most c<strong>on</strong>servative risk estimate derived by USEPA (2000) (4.4 x 10 -6 risk per µg/m 3 based <strong>on</strong> female rat<br />
data using the LMS method, or 4.2 x 10 -6 risk per µg/m 3 using the LED10/linear method). Clewell et al.<br />
(2001) recommended using the geometric mean from all three animal studies evaluated in their cancer<br />
assessment of 1.1 x 10 -6 risk per µg/m 3 . The TD chose to use the USEPA (2000) URF of 4.2 x 10 -6 risk<br />
per µg/m 3 based <strong>on</strong> female rat data using the LED10/linear method because it c<strong>on</strong>servatively incorporated<br />
data <strong>on</strong> all liver tumor types in the assessment versus <strong>on</strong>ly angiosarcomas.<br />
4.2.5 Evaluating Susceptibility from Early-Life Exposures<br />
Human studies that specifically address the effects of VC in children were not identified in the literature.<br />
However, several animal studies provide evidence for early life sensitivity associated with VC-induced<br />
carcinogenicity. Malt<strong>on</strong>i et al. (1981) reported a greater incidence of hepatomas and liver angiosarcomas<br />
in rats exposed from 1 day of age for 5 weeks than in rats exposed to the same c<strong>on</strong>centrati<strong>on</strong>s beginning<br />
at 3 m<strong>on</strong>ths of age. Hepatomas were reported in 47.6% and liver angiosarcomas in 40.5% of rats exposed<br />
from 1 day of age for 5 weeks to 6000 ppm VC.<br />
Drew et al. (1983) examined the effects of age and exposure durati<strong>on</strong> <strong>on</strong> cancer inducti<strong>on</strong> by VC in mice,<br />
rats, and hamsters. Higher death rates were observed when 2-m<strong>on</strong>th-old female hamsters, mice, and rats<br />
were exposed to VC for 12 m<strong>on</strong>ths than when 8- or 14-m<strong>on</strong>th-old animals were exposed. The incidence<br />
of several tumor types including hemangiosarcoma of the liver were greater in animals exposed for 12<br />
m<strong>on</strong>ths, starting immediately after weaning, compared to animals that were 1 year older at the time of
<str<strong>on</strong>g>Vinyl</str<strong>on</strong>g> chloride<br />
Page 24<br />
exposure. The incidence of mammary gland carcinoma was higher in 2- or 8-m<strong>on</strong>th-old hamsters exposed<br />
to 200 ppm VC for 6 m<strong>on</strong>ths than in 14- or 20-m<strong>on</strong>th-old hamsters. Overall, exposures of equal durati<strong>on</strong><br />
were most effective in producing cancer when started early in life.<br />
Mechanistic studies are c<strong>on</strong>sistent with tumor studies. Laib et al. (1979) reported that VC induced<br />
preneoplastic foci in newborn rats but not adult rats. This effect was determined to be a result of the<br />
increased rate of cell proliferati<strong>on</strong> in newborn animals. Laib et al. (1989) reported that inhaled,<br />
radiolabeled VC was incorporated into physiological purines of 11-day-old rats eight times more than in<br />
adult rats, reflecting the higher degree of DNA replicati<strong>on</strong> activity in younger animals. In the same study,<br />
approximately five-fold higher levels of a DNA adduct (7-N-(2-oxyethyl)guanine) were found in the<br />
livers of young animals compared to adult animals, reflecting a higher alkylati<strong>on</strong> rate in younger animals.<br />
Similarly, Fedtke et al. (1990) reported an increased alkylati<strong>on</strong> rate in preweanling rats exposed to VC<br />
compared to adults. Ciroussel et al. (1990) reported a six-fold increase in the formati<strong>on</strong> of<br />
ethen<strong>on</strong>ucleosides in immature rats compared to adults. Similarly, Morinello et al. (2002) reported a two-<br />
to three-fold increase in the c<strong>on</strong>centrati<strong>on</strong> of ethenoguanine adducts in weanling rats compared to adults<br />
exposed to the same dose for the same time period.<br />
USEPA (2000) incorporated informati<strong>on</strong> from these studies into the development of a two-fold<br />
adjustment factor for early-life exposure to VC (see USEPA 2000 for a complete explanati<strong>on</strong> of how this<br />
factor was derived). Since the USEPA (2000) evaluati<strong>on</strong> was published, a PBPK model was developed by<br />
Clewell et al. (2004) to evaluate the potential age- and gender-specific pharmacokinetic differences <strong>on</strong> the<br />
dosimetry of VC. In this model, the rate of metabolite producti<strong>on</strong> per volume of liver was estimated to<br />
rise rapidly from birth until about age 16, after which it remains relatively c<strong>on</strong>stant before rising again<br />
later in life. The rate of metabolite producti<strong>on</strong> per volume of liver (the dose metric used in the cancer risk<br />
assessments for VC by Clewell et al. 2001 and USEPA 2000) varies four-fold from birth to 75 years of<br />
age, with peak values estimated in adolescence at age 14 to 16 and again later in life. Other factors that<br />
may affect VC toxicity early in life include the presence of fetal CYP450s, different levels of glutathi<strong>on</strong>e<br />
c<strong>on</strong>jugati<strong>on</strong> in developing animals, and differences in DNA repair capacity and other pharmacodynamic<br />
factors (ATSDR 2006). Although the results of this study provide support for the potential for early-life<br />
sensitivity to VC carcinogenicity, the authors did not intend for this informati<strong>on</strong> to be used quantitatively<br />
in risk assessments (Clewell et al. 2004). In the absence of more recent and definitive informati<strong>on</strong> to<br />
suggest the use of a different age-adjustment factor, the TD recommends the use of a two-fold ageadjustment<br />
factor as recommended by USEPA (2000) for early-life exposure. The exposure factor does<br />
not need to be applied if exposures <strong>on</strong>ly occur during adulthood. By applying the two-fold age-adjustment<br />
factor, the URF would be 8.4 x 10 -6 per μg/m 3 .<br />
4.2.6 Calculati<strong>on</strong> of Air C<strong>on</strong>centrati<strong>on</strong> at 1 x 10 -5 Excess Cancer Risk<br />
The 2005 USEPA Cancer Guidelines recommend the use of the LED10/linear method to develop cancer<br />
risk estimates for chemicals with a mutagenic MOA; therefore, the TD chose to use the URF of 4.2 x 10 -6<br />
per µg/m 3 (or 8.4 x 10 -6 per µg/m 3 corrected for an increased susceptibility of children) derived by<br />
USEPA (2000) using the LED10/linear method based <strong>on</strong> data from female rats (Malt<strong>on</strong>i et al. 1981 and<br />
1984). By using the inhalati<strong>on</strong> URF of 4.2 x 10 -6 per µg/m 3 , the chr<strong>on</strong>ic ESLlinear(c) for VC at the TCEQ no<br />
significant risk level of 1 x 10 -5 is calculated below:<br />
chr<strong>on</strong>ic ESLlinear(c) = [1 x 10 -5 ] / [4.2 x 10 -6 (µg/m 3 ) -1 ] = 2.4 µg/m 3 or 0.9 ppb<br />
The use of this value would be appropriate in situati<strong>on</strong>s in which you would not expect children to be<br />
exposed (possibly in an industrial envir<strong>on</strong>ment with no residential areas nearby).
<str<strong>on</strong>g>Vinyl</str<strong>on</strong>g> chloride<br />
Page 25<br />
By applying the two-fold age-adjustment factor, the chr<strong>on</strong>ic ESLlinear(c) for VC at the TCEQ no significant<br />
risk level of 1 x 10 -5 is calculated below:<br />
chr<strong>on</strong>ic ESLlinear(c) = [1 x 10 -5 ] / [8.4 x 10 -6 (µg/m 3 ) -1 ] = 1.2 µg/m 3 or 0.45 ppb<br />
The use of this value would be appropriate in situati<strong>on</strong>s in which you would expect children to be<br />
exposed.<br />
4.2.7 Comparis<strong>on</strong> of Results<br />
Table 11 is a comparis<strong>on</strong> of URFs derived by the TCEQ and other sources. Although it is preferable to<br />
use human data to derive risk estimates, similar to the USEPA (2000), the TD used animal studies to<br />
develop risk estimates because of the limitati<strong>on</strong>s regarding exposure c<strong>on</strong>centrati<strong>on</strong>s and durati<strong>on</strong>s in the<br />
available human studies. The TCEQ URF is similar to the URFs derived from human epidemiological<br />
studies developed by Clewell et al. (2001) and WHO (2000), and is about 10 times less c<strong>on</strong>servative than<br />
that derived by CalEPA based <strong>on</strong> a VC risk assessment c<strong>on</strong>ducted by the California Department of Health<br />
Services in 1990.<br />
Table 11. Comparis<strong>on</strong> of VC Inhalati<strong>on</strong> URFs and Chr<strong>on</strong>ic Toxicity Benchmarks<br />
chr<strong>on</strong>ic ESLlinear(c) a 4.2 x 10 -6 (µg/m 3 ) -1<br />
Inhalati<strong>on</strong> URF Air C<strong>on</strong>centrati<strong>on</strong> at 1 x 10 -5<br />
Cancer Risk Level<br />
8.4 x 10 -6 (µg/m 3 -1 b<br />
)<br />
USEPA (2000) a 4.4 x 10 -6 (µg/m 3 ) -1<br />
Clewell et al. (2001) c<br />
8.8 x 10 -6 (µg/m 3 -1 b<br />
)<br />
2.4 µg/m 3 (0.9 ppb)<br />
1.2 µg/m 3 (0.45 ppb)<br />
2.3 µg/m 3 (0.88 ppb)<br />
1.1 µg/m 3 (0.42 ppb)<br />
1.1 x 10 -6 (µg/m 3 ) -1 9.1 µg/m 3 (3.5 ppb)<br />
Clewell et al. (2001) d 0.15 to 1.6 x 10 -6 (µg/m 3 ) -1 66.7 µg/m 3 (25.6 ppb) to<br />
6.3 µg/m 3 (2.4 ppb)<br />
WHO (2000) d 1.0 x 10 -6 (µg/m 3 ) -1 10.0 µg/m 3 (2.6 ppb)<br />
CalEPA (1994) e 7.8 x 10 -5 (µg/m 3 ) -1 0.13 µg/m 3 (0.05 ppb)<br />
a<br />
URFs were estimated based <strong>on</strong> a cancer risk assessment of Malt<strong>on</strong>i et al. (1981, 1984) rat inhalati<strong>on</strong> data<br />
b<br />
URF incorporates a two-fold age-adjustment factor for early-life exposures<br />
c<br />
URF estimated based <strong>on</strong> a cancer risk assessment of Malt<strong>on</strong>i et al. (1981, 1984), Malt<strong>on</strong>i and Cotti (1988), and<br />
Fer<strong>on</strong> et al. (1981) animal data. URF is the geometric mean of risk estimates from all three animal studies.<br />
d<br />
URFs were estimated based <strong>on</strong> human epidemiological data<br />
e<br />
URF estimated based <strong>on</strong> a cancer risk assessment of Drew et al. (1983), Malt<strong>on</strong>i et al. (1984), and Bi et al. (1985)<br />
animal data
<str<strong>on</strong>g>Vinyl</str<strong>on</strong>g> chloride<br />
Page 26<br />
4.3 Welfare-Based Chr<strong>on</strong>ic ESL<br />
No chr<strong>on</strong>ic vegetative studies were identified for VC.<br />
4.4 L<strong>on</strong>g-Term ESL and Values for Air M<strong>on</strong>itoring Evaluati<strong>on</strong><br />
This chr<strong>on</strong>ic evaluati<strong>on</strong> resulted in the derivati<strong>on</strong> of the following chr<strong>on</strong>ic values:<br />
• chr<strong>on</strong>ic ReV = 83 µg/m 3 (32 ppb)<br />
chr<strong>on</strong>ic<br />
• ESLn<strong>on</strong>linear(nc) = 25 µg/m 3 (9.6 ppb)<br />
• URF = 8.4 x 10 -6 per µg/m 3 (2.2 x 10 -5 per ppb)-using the two-fold factor for early life exposure<br />
chr<strong>on</strong>ic<br />
• ESLlinear(c) = 1.2 µg/m 3 (0.45 ppb)<br />
The l<strong>on</strong>g-term ESL for air permit evaluati<strong>on</strong>s is the chr<strong>on</strong>ic ESLlinear(c) of 1.2 μg/m 3 (0.45 ppb) as it is lower<br />
than the chr<strong>on</strong>ic ESLn<strong>on</strong>linear(nc) (Table 1). This value is protective of early-life exposure. If children are not<br />
expected to be exposed, the higher value of 2.3 µg/m 3 (0.90 ppb) may be used.<br />
For evaluati<strong>on</strong> of air m<strong>on</strong>itoring data, the chr<strong>on</strong>ic ESLlinear(c) of 1.2 μg/m 3 (0.45 ppb) is lower than the chr<strong>on</strong>ic<br />
ReV of 83 µg/m 3 (32 ppb), although these two values may both be used for the evaluati<strong>on</strong> of air data<br />
(Table 1). The chr<strong>on</strong>ic ESLn<strong>on</strong>linear(nc) (HQ = 0.3) is not used to evaluate ambient air m<strong>on</strong>itoring data.<br />
Chapter 5 References<br />
5.1 References Cited in the Development Support Document<br />
Acute Exposure Guideline Leve (AEGL). 2004. Acute Exposure Guideline Levels (AEGLs) for vinyl<br />
chloride (CAS Reg. No. 75-01-4). Interim. Available from: www.epa.gov/oppt/aegl.<br />
Agency for Toxic Substances and Disease Registry (ATSDR). 2006. Toxicological profile for vinyl<br />
chloride. Atlanta, GA.<br />
Agency for Toxic Substances and Disease Registry (ATSDR). 2007. Medical management guidelines for<br />
vinyl choride. Atlanta, GA.<br />
Air Force. 1990. Development and validati<strong>on</strong> of methods for applying pharmacokinetic data in risk<br />
assessment. Volume 5. <str<strong>on</strong>g>Vinyl</str<strong>on</strong>g> chloride. Wright-Patters<strong>on</strong> AFB, OH: U.S. Air Force, Air Force<br />
Systems Command, Human Systems Divisi<strong>on</strong>, Harry G. Armstr<strong>on</strong>g Aerospace Medical Research<br />
Laboratory. ADA2373652.<br />
American C<strong>on</strong>ference of Governmental Industrial Hygienists (ACGIH). 2003. <str<strong>on</strong>g>Vinyl</str<strong>on</strong>g> chloride. Threshold<br />
limit values for chemical substances and physical agents and biological exposure indices.<br />
Cincinnati, OH.<br />
Amoore JE, Hautala E. 1983. Odor as an aid to chemical safety: Odor thresholds compared with threshold<br />
limit values and volatilities for 214 industrial chemicals in air and water diluti<strong>on</strong>. J Appl Toxicol<br />
3:272-290.<br />
Andersen, M; Clewell, H; Gargas, M; et al. (1987) Physiologically based pharmacokinetics and the risk<br />
assessment process for methylene chloride. Toxicol Appl Pharmacol 87:185-205.
<str<strong>on</strong>g>Vinyl</str<strong>on</strong>g> chloride<br />
Page 27<br />
Baretta ED, Stewart RD, Mutchler JE. 1969. M<strong>on</strong>itoring exposures to vinyl chloride vapor: Breath<br />
analysis and c<strong>on</strong>tinuous air sampling. Am Ind Hyg Assoc J 30:537.<br />
Berk PD, Martin JF, Wagg<strong>on</strong>er JG. 1975. Persistence of vinyl chloride induced liver injury after cessati<strong>on</strong><br />
of exposure. Ann NY Acad Sci 31:70-77.<br />
Bi W, Wang Y, Huang M, et al. 1985. Effect of vinyl chloride <strong>on</strong> testis in rats. Ecotoxicol Envir<strong>on</strong> Safety<br />
10:281-289.<br />
Boffetta P, Matisane L, Mundt KA, et al. 2003. Meta-analysis of studies of occupati<strong>on</strong>al exposure to vinyl<br />
chloride in relati<strong>on</strong> to cancer mortality. Scand J Work Envir<strong>on</strong> Health 29(3):220-229.<br />
California Envir<strong>on</strong>mental Protecti<strong>on</strong> Agency. 1999. Determinati<strong>on</strong> of acute reference exposure levels for<br />
airborne toxicants: vinyl chloride.<br />
Ciroussel F, Barbin A, Eberle G, et al. 1990. Investigati<strong>on</strong>s <strong>on</strong> the relati<strong>on</strong>ship between DNA ethenobase<br />
adduct levels in several organs of vinyl chloride-exposed rats and cancer susceptibility. Biochem<br />
Pharmacol 39:1109-1113.<br />
Clewell, HJ; Gentry, PR; Gearhart, JM; et al. 1995a. The development and validati<strong>on</strong> of a physiologically<br />
based pharmacokinetic model for vinyl chloride and its applicati<strong>on</strong> in a carcinogenic risk<br />
assessment for vinyl chloride. Prepared by ICF Kaiser for the Office of Health and Envir<strong>on</strong>mental<br />
Assessment, U.S. Envir<strong>on</strong>mental Protecti<strong>on</strong> Agency, and the Directorate of Health and Standards<br />
Programs, Occupati<strong>on</strong>al Safety and Health Administrati<strong>on</strong>, Washingt<strong>on</strong>, DC.<br />
Clewell HJ, Gentry JM, Gearhart BC, et al. 1995b. C<strong>on</strong>sidering pharmacokinetic and mechanistic<br />
informati<strong>on</strong> in cancer risk assessments for envir<strong>on</strong>mental c<strong>on</strong>taminants: Examples with vinyl<br />
chloride and trichloroethylene. Chemosphere 31(1):2561-2578.<br />
Clewell HJ, Gentry PR, Gearhart JM, et al. 2001. Comparis<strong>on</strong> of cancer risk estimates for vinyl chloride<br />
using animal and human data with a PBPK model. Sci Total Envir<strong>on</strong> 274:37-66.<br />
Clewell HJ, Gentry JM, Covingt<strong>on</strong> TR, et al. 2004. Evaluati<strong>on</strong> of the potential impact of age-and genderspecific<br />
pharmacokinetic differences <strong>on</strong> tissue dosimetry. Toxicol Sci 79:381-393.<br />
Drew RT, Boorman GA, Haseman JK, et al. 1983. The effect of age and exposure durati<strong>on</strong> <strong>on</strong> cancer<br />
inducti<strong>on</strong> by a known carcinogen in rats, mice, and hamsters. Toxicol Appl Pharmacol 68:120-<br />
130.<br />
D'Souza RW, Andersen ME. 1988. Physiologically based pharmacokinetic model for vinylidene chloride.<br />
Toxicol Appl Pharmacol 95:230-240.<br />
Falk H, Creech JL Jr, Heath CW Jr, et al. 1974. Hepatic disease am<strong>on</strong>g workers at a vinyl chloride<br />
polymerizati<strong>on</strong> plant. JAMA 230:59-63.<br />
Fedtke N, Boucher<strong>on</strong> JA, Walker VE, et al. 1990. <str<strong>on</strong>g>Vinyl</str<strong>on</strong>g> chloride-induced DNA adducts. II: Formati<strong>on</strong><br />
and persistence of 7-(2-oxoethyl)guanine and N 2 ,3-ethenoguanine in rat tissue DNA.<br />
Carcinogenesis 11(8):1287-1292.
<str<strong>on</strong>g>Vinyl</str<strong>on</strong>g> chloride<br />
Page 28<br />
Fer<strong>on</strong> VJ, Hendriksen CFM, Speek AJ, et al. 1981. Lifespan oral toxicity study of vinyl chloride in rats.<br />
Food Cosmet Toxicol 19:317-333.<br />
Fox AJ, Collier PF. 1977. Mortality experience of workers exposed to vinyl chloride m<strong>on</strong>omer in the<br />
manufacture of polyvinyl chloride in Great Britain. Br J Ind Med 34:1-10.<br />
Gedigke P, Muller R, Bechtelsheimer H. 1975. Morphology of liver damage am<strong>on</strong>g polyvinyl chloride<br />
producti<strong>on</strong> workers. A report <strong>on</strong> 51 cases. Ann N Y Acad Sci 246:278-285.<br />
Ho SF, Pho<strong>on</strong> WH, Gan SL, et al. 1991. Persistent liver dysfuncti<strong>on</strong> am<strong>on</strong>g workers at a vinyl chloride<br />
m<strong>on</strong>omer polymerizati<strong>on</strong> plant. J Soc Occup Med 41(1):10-16.<br />
Holmberg B, Kr<strong>on</strong>evi T, Winell M. 1976. The pathology of vinyl chloride exposed mice. Acta Vet Scand<br />
17:328-342.<br />
Holmberg B. The toxicology of m<strong>on</strong>omers of the polyvinyl plastic series. In: Industrial hazards of plastics<br />
and synthetic elastomers. New York (NY): Alan R Liss, Inc.; 1984. p. 99-112.<br />
H<strong>on</strong>g CB, Winst<strong>on</strong> JM, Thornburg LP, et al. 1981. Follow-up study <strong>on</strong> the carcinogenicity of vinyl<br />
chloride and vinylidene chloride in rats and mice: Tumor incidence and mortality subsequent to<br />
exposure. J Toxicol Envir<strong>on</strong> Health 7:909-924.<br />
Ivanetich, KM; Ar<strong>on</strong>s<strong>on</strong>, I; Katz, ID. 1977. The interacti<strong>on</strong> of vinyl chloride with rat hepatic microsomal<br />
cytochrome P-450 in vitro. Biochem Biophys Res Commun 74:1411-1418.<br />
John JA, Smith FA, Le<strong>on</strong>g BKJ, et al. 1977. The effects of maternally inhaled vinyl chloride <strong>on</strong><br />
embry<strong>on</strong>al and fetal development in mice, rats and rabbits. Toxicol Appl Pharmacol 39:497-513.<br />
John JA, Smith FA, Schwetz BA. 1981. <str<strong>on</strong>g>Vinyl</str<strong>on</strong>g> chloride: Inhalati<strong>on</strong> teratology study in mice, rats, and<br />
rabbits. Envir<strong>on</strong> Health Perspect 41:171-177.<br />
J<strong>on</strong>es DB, Smith PM. 1982. Progressi<strong>on</strong> of vinyl chloride induced hepatic fibrosis to angiosarcoma of the<br />
liver. Br J Ind Med 39:306-307.<br />
J<strong>on</strong>es RD, Smith DM, Thomas PG. 1988. A mortality study of vinyl chloride m<strong>on</strong>omer workers<br />
employed in the United Kingdom in 1940-1974. Scand J Work Envir<strong>on</strong> Health 14:153-160.<br />
Laib, RJ; Stoeckle, G; Bolt, HM; et al. 1979. <str<strong>on</strong>g>Vinyl</str<strong>on</strong>g> chloride and trichloroethylene. Comparis<strong>on</strong> of<br />
alkylating effects of metabolites and inducti<strong>on</strong> of preneoplastic enzyme deficiencies in rat liver. J<br />
Cancer Res Clin Oncol 94:139-147.<br />
Laib RJ, Bolt HM, Cartier R, et al. 1989. Increased alkylati<strong>on</strong> of liver DNA and cell turnover in young<br />
versus old rats exposed to vinyl chloride correlates with cancer susceptibility. Toxicol Lett<br />
45:231-239.<br />
Lee CC, Bhandari JC, Winst<strong>on</strong> JM, et al. 1977. Inhalati<strong>on</strong> toxicity of vinyl chloride and vinylidene<br />
chloride. Envir<strong>on</strong> Health Perspect 21:25-32.<br />
Lee CC, Bhandari JC, Winst<strong>on</strong> JM, et al. 1978. Carcinogenicity of vinyl chloride and vinylidene chloride.<br />
J Toxicol Envir<strong>on</strong> Health 4:15-30.
<str<strong>on</strong>g>Vinyl</str<strong>on</strong>g> chloride<br />
Page 29<br />
Lester D, Greenberg LA, Adams WR. 1963. Effects of single and repeated exposures of humans and<br />
rats to vinyl chloride. Am Ind Hyg Assoc J 3:265-275.<br />
Lewis R. 2001. Use of rank-order analysis of ordinal exposure data: Applicati<strong>on</strong> to vinyl chloride<br />
exposure. Appl Occup Envir<strong>on</strong> Hyg 16(2):188-191.<br />
Lewis RJ, Rempala G, Dell LD, et al. 2003. <str<strong>on</strong>g>Vinyl</str<strong>on</strong>g> chloride and liver and brain cancer at a polymer<br />
producti<strong>on</strong> plant in Louisville, Kentucky. J Occup Envir<strong>on</strong> Med 45(5)533-537.<br />
Lewis R, Rempala G. 2003. A case-cohort study of angiosarcoma of the liver and brain cancer at a<br />
polymer producti<strong>on</strong> plant. J Occup Envir<strong>on</strong> Med 45(5):538-545.<br />
Lilis R, Anders<strong>on</strong> H, Nichols<strong>on</strong> WJ, et al. 1975. Prevalence of disease am<strong>on</strong>g vinyl chloride and<br />
polyvinyl chloride workers. Ann NY Acad Sci 246:22-41.<br />
Liss GM, Greenberg RA, Tamburro CH. 1985. Use of serum bile acids in the identificati<strong>on</strong> of vinyl<br />
chloride hepatotoxicity. Am J Med 78:68-76.<br />
Malt<strong>on</strong>i C, Cotti G. 1988. Carcinogenicity of vinyl chloride in Sprague-Dawley rats after prenatal and<br />
postnatal exposure. Ann NY Acad Sci 534:145-159.<br />
Malt<strong>on</strong>i C, Lefemine G, Ciliberti A, et al. 1981. Carcinogenicity bioassays of vinyl chloride m<strong>on</strong>omer: A<br />
model of risk assessment <strong>on</strong> an experimental basis. Envir<strong>on</strong> Health Perspect 41:3-29.<br />
Malt<strong>on</strong>i C, LeFemine G, Ciliberti A, et al. 1984. Experimental research <strong>on</strong> vinyl chloride carcinogenesis.<br />
Archives of Research <strong>on</strong> Industrial Carcinogenesis, Vol. II. Princet<strong>on</strong>, NJ: Princet<strong>on</strong> Scientific<br />
Publishers.<br />
Marsteller HJ, Lelbach WK, Muller R, et al. 1975. Unusual splenomegalic liver disease as evidenced by<br />
perit<strong>on</strong>eoscopy and guided liver biopsy am<strong>on</strong>g polyvinyl chloride producti<strong>on</strong> workers. Ann NY<br />
Acad Sci 246: 95-134.<br />
Morinello EJ, Ham A-JL, Ranasinghe A, et al. 2002a. Molecular dosimetry and repair of<br />
N2,3ethenoguanine in rats exposed to vinyl chloride. Cancer Res 62:5189-5195.<br />
Mundt KA, Dell LD, Austin RP, et al. 2000. Historical cohort study of 10,109 men in the North American<br />
vinyl chloride industry. 1942-1972. Update of cancer mortality to 31 December 1995. Occup<br />
Envir<strong>on</strong> Med 57(11):774-781.<br />
Patty FA, Yant WP, Waite,CP. 1930. Acute resp<strong>on</strong>se of guinea pigs to vapors of some new commercial<br />
organic compounds. 5. <str<strong>on</strong>g>Vinyl</str<strong>on</strong>g> chloride. Publ Health Reports 45:1963-1971.<br />
Popper H, Thomas LB. 1975. Alterati<strong>on</strong>s of liver and spleen am<strong>on</strong>g workers exposed to vinyl chloride.<br />
Ann NY Acad Sci 246: 172-194.<br />
Reitz RH, Gargas ML, Anders<strong>on</strong> ME, et al. 1996. Predicting cancer risk from vinyl chloride exposure<br />
with a physiologically based pharmacokinetic model. Toxicol Appl Pharmacol 137:253-267.
<str<strong>on</strong>g>Vinyl</str<strong>on</strong>g> chloride<br />
Page 30<br />
Sabadie N, Malaveille C, Camus AM, et al. 1980. Comparis<strong>on</strong> of the hydroxylati<strong>on</strong> of benzo(a)pyrene<br />
with the metabolism of vinyl chloride, N-nitros<strong>on</strong>orpholine, and N-nitroso-N'methylpiperazine to<br />
mutagens by human and rat liver microsomal fracti<strong>on</strong>s. Cancer Res 409:119-126.<br />
Sim<strong>on</strong>ato L, L'Abbe KA, Andersen A, et al. 1991. A collaborative study of cancer incidence and<br />
mortality am<strong>on</strong>g vinyl chloride workers. Scand J Work Envir<strong>on</strong> Health 17(3):159-169.<br />
Sokal JA, Baranski B, Majka J, et al. 1980. Experimental studies <strong>on</strong> the chr<strong>on</strong>ic toxic effects of vinyl-<br />
chloride in rats. J Hyg Epidemiol Microbiol Immunol 24:285-294.<br />
Suciu I, Prodan L, Ilea E, et al. 1975. Clinical manifestati<strong>on</strong>s in vinyl chloride pois<strong>on</strong>ing. Ann N Y Acad<br />
Sci 246:53-69.<br />
Tamburro CH, Makk L, Popper H. 1984. Early hepatic histologic alterati<strong>on</strong>s am<strong>on</strong>g chemical (vinyl<br />
m<strong>on</strong>omer) workers. Hepatology 4:413-418.<br />
Thornt<strong>on</strong> SR, Schroeder RE, Robis<strong>on</strong> RL, et al. 2002. Embryo-fetal developmental and reproductive<br />
toxicology of vinyl chloride in rats. Toxicol Sci 68:207-219.<br />
Torkels<strong>on</strong> TR, Oyen F, Rowe VK. 1961. The toxicity of vinyl chloride as determined by repeated<br />
exposure of laboratory animals. Am Ind Hyg Assoc J 22:354-361.<br />
Van Gemert, LJ; Nettenbreijer AH. 1977. Compilati<strong>on</strong> of odour threshold values in air and water.<br />
Nati<strong>on</strong>al Institute for Water Supply, Voorburg, Netherlands.<br />
Vihko R, Vihko P, Maentausta O, et al. 1984. Assessment of early hepatotoxicity: Biological m<strong>on</strong>itoring<br />
and surveillance of workers exposed to chemicals. In: Aitio A, Riihimaki V, Vainio J, eds.<br />
Washingt<strong>on</strong>, DC: Hemosphere Publishing Co., 309-313.<br />
Ward E, Boffetta P, Andersen A, et al. 2001. Update of the follow-up of mortality and cancer incidence<br />
am<strong>on</strong>g European workers employed in the vinyl chloride industry. Epidemiology 12:710-718.<br />
Wisniewska-Knypl JM, Klimczak J, Kolakowski J. 1980. M<strong>on</strong>ooxygenase activity and ultrastructural<br />
changes of liver in the course of chr<strong>on</strong>ic exposure of rats to vinyl chloride. Int Arch Occup<br />
Envir<strong>on</strong> Health 46:241-249.<br />
World Health Organizati<strong>on</strong>. 2000. Air <strong>Quality</strong> Guidelines – Sec<strong>on</strong>d Editi<strong>on</strong>. Chapter 5.16 – <str<strong>on</strong>g>Vinyl</str<strong>on</strong>g><br />
<str<strong>on</strong>g>Chloride</str<strong>on</strong>g>. WHO Regi<strong>on</strong>al Office for Europe, Copenhagen, Denmark.<br />
Occupati<strong>on</strong>al Safety and Health Administrati<strong>on</strong> (OSHA). 2004. <str<strong>on</strong>g>Vinyl</str<strong>on</strong>g> chloride. Occupati<strong>on</strong>al safety and<br />
health standards. Toxic and hazardous substances. Washingt<strong>on</strong>, DC: Occupati<strong>on</strong>al Safety and<br />
Health Administrati<strong>on</strong>. Code of Federal Regulati<strong>on</strong>s. 29 CFR 1910.1017.<br />
USEPA. 1987. Incorporati<strong>on</strong> of biological informati<strong>on</strong> in cancer risk assessment: Example - vinyl<br />
chloride. Washingt<strong>on</strong>, DC: U.S. Envir<strong>on</strong>mental Protecti<strong>on</strong> Agency, Office of Research and<br />
Development, Office of Health and Envir<strong>on</strong>mental Assessment. PB87198982.<br />
USEPA. 2000. Toxicological review of vinyl chloride. Washingt<strong>on</strong>, DC: U.S. Envir<strong>on</strong>mental Protecti<strong>on</strong><br />
Agency. EPA635R00004.
<str<strong>on</strong>g>Vinyl</str<strong>on</strong>g> chloride<br />
Page 31<br />
5.2 Other References Reviewed But Not Cited:<br />
Bolt HM, Kappus H, Buchter A, et al. 1976. Dispositi<strong>on</strong> of (1,2-14C) vinyl chloride in the rat. Arch<br />
Toxicol 35:153-162.<br />
Cheng T-J, Huang M-L, You N-C, et al. 1999. Abnormal liver functi<strong>on</strong> in workers exposed to low levels<br />
of ethylene dichloride and vinyl chloride m<strong>on</strong>omer. J Occup Envir<strong>on</strong> Med 41(12):1128-1133.<br />
Creech JL, Johns<strong>on</strong> MN. 1974. Angiosarcoma of liver in the manufacture of polyvinyl chloride. J Occup<br />
Med 16:150-151.<br />
Danziger H. 1960. Accidental pois<strong>on</strong>ing by vinyl chloride: report of two cases. Can Med Assoc J 82:828-<br />
830.<br />
Du C-L, Kuo ML, Chang HL, et al. 1995. Changes in lymphocyte single strand breakage and liver<br />
functi<strong>on</strong> of workers exposed to vinyl chloride m<strong>on</strong>omer. Toxicol Lett 77:379-385.<br />
Du C-L, Wang J-D. 1998. Increased morbidity odds ratio of primary liver cancer and cirrhosis of the liver<br />
am<strong>on</strong>g vinyl chloride m<strong>on</strong>omer workers. Occup Envir<strong>on</strong> Med 55:528-532.<br />
Duprat P, Fabry JP, Gradiski D, et al. 1977. Metabolic approach to industrial pois<strong>on</strong>ing: Blood kinetics<br />
and distributi<strong>on</strong> of 14C-vinyl chloride m<strong>on</strong>omer (VCM). Acta Pharmacol Toxicol Suppl 41:142-<br />
143.<br />
Elliott P, Kleinschmidt I. 1997. Angiosarcoma of the liver in Great Britain in proximity to vinyl chloride<br />
sites. Occup Envir<strong>on</strong> Med 54:14-18.<br />
Esmen NA, Hall TA, Phillips ML, J<strong>on</strong>es EP, Basara H, Marsh GM, Buchanich JM. 2007. Chemical<br />
process-based rec<strong>on</strong>structi<strong>on</strong> of exposures for an epidemiological study. Part II. Estimated<br />
exposures to chloroprene and vinyl chloride. Chem Biol Interact Mar 20;166(1-3):264-76. Epub<br />
2006 Aug 22.<br />
Forman D, Bennett B, Stafford J, et al. 1985. Exposure to vinyl chloride and angiosarcoma of the liver: A<br />
report of the register of cases. Br J Ind Med 42:750-753.<br />
Infante PF, Wag<strong>on</strong>er JK, Waxweiler RJ. 1976b. Carcinogenic, mutagenic, and teratogenic risks associated<br />
with vinyl chloride. Mutat Res 41:131-142.<br />
Fortwengler P, Lewis RD, Reynolds L, et al. 1999. Empirical evidence that angiosarcoma of the liver<br />
caused by vinyl chloride exposure has a relatively high threshold dose in humans. Hepatology<br />
30(4 Pt 2):504A.<br />
Hehir RM, McNamara BP, McLaughlin J, Jr, et al. 1981. Cancer inducti<strong>on</strong> following single and multiple<br />
exposures to a c<strong>on</strong>stant amount of vinyl chloride m<strong>on</strong>omer. Envir<strong>on</strong> Health Perspect 41:63-72.
<str<strong>on</strong>g>Vinyl</str<strong>on</strong>g> chloride<br />
Page 32<br />
Hozo I, Andelinovic S, Ljutic D, et al. 1997. Two new classes of liver angiosarcoma: History and<br />
perspectives of liver angiosarcoma am<strong>on</strong>g plastic industry workers. Toxicol Ind Health<br />
13(5):639-648.<br />
Hsieh HI, Wang JD, Chen PC, et al. 2003. Synergistic effects of hepatitis virus infecti<strong>on</strong> and occupati<strong>on</strong>al<br />
exposures to vinyl chloride m<strong>on</strong>omer and ethylene dichloride <strong>on</strong> serum aminotransferase activity.<br />
Occup Envir<strong>on</strong> Med 60:774-778.<br />
Huang CY, Huang KL, Cheng TJ, Wang JD, Hsieh LL. 1997. The GST T1 and CYP2E1 genotypes are<br />
possible factors causing vinyl chloride induced abnormal liver functi<strong>on</strong>. Arch Toxicol 71(8):482-<br />
488.<br />
Krajewski J, Dobecki M, Gromiec J. 1980. Retenti<strong>on</strong> of vinyl chloride in the human lung. Br J Ind Med<br />
37:373-374.<br />
Laplanche A, Clavel-Chapel<strong>on</strong> F, C<strong>on</strong>tassot JC, et al. 1992. Exposure to vinyl chloride m<strong>on</strong>omer: Results<br />
of a cohort study after a 7 year follow-up. Br J Ind Med 49(2):134-137.<br />
Lee FL, Smith PM, Bennett B, et al. 1996. Occupati<strong>on</strong>ally related angiosarcoma of the liver in the United<br />
Kingdom 1972-1994. Gut 39:312-318<br />
Lelbach WK. 1996. A 25-year follow-up study of heavily exposed vinyl chloride workers in Germany.<br />
Am J Ind Med 29:446-458.<br />
Mar<strong>on</strong>i M, Mocci F, Visentin S, et al. 2003. Periportal fibrosis and other liver ultras<strong>on</strong>ography findings in<br />
vinyl chloride workers. Occup Envir<strong>on</strong> Med 60:60-65.<br />
Marsh GM, Youk AO, Buchanich JM, Cunningham M, Esmen NA, Hall TA, Phillips ML. 2007.<br />
Mortality patterns am<strong>on</strong>g industrial workers exposed to chloroprene and other substances. II.<br />
Mortality in relati<strong>on</strong> to exposure. Chem Biol Interact Mar 20;166(1-3):301-16. Epub 2006 Aug<br />
22.<br />
Marsh GM, Youk AO, Buchanich JM, Cunningham M, Esmen NA, Hall TA, Phillips ML. 2007.<br />
Mortality patterns am<strong>on</strong>g industrial workers exposed to chloroprene and other substances. I.<br />
General mortality patterns. Chem Biol Interact Mar 20;166(1-3):285-300. Epub 2006 Aug 22.<br />
Mastrangelo G, Fedeli U, Fadda E, et al. 2004. Increased risk of hepatocellular carcinoma and liver<br />
cirrhosis in vinyl chloride workers: Synergistic effect of occupati<strong>on</strong>al exposure with alcohol<br />
intake. Envir<strong>on</strong> Health Perspect 112(11):1188-1192.<br />
Mastromatteo E, Fisher M, Christie H, Danzinger H. Acute inhalati<strong>on</strong> toxicity of vinyl chloride to<br />
laboratory animals. Am Ind Hyg Assoc J 1960;4:394-398.<br />
M<strong>on</strong>s<strong>on</strong> RR, Peters JM, Johns<strong>on</strong> MN. 1975. Proporti<strong>on</strong>al mortality am<strong>on</strong>g vinyl chloride workers.<br />
Envir<strong>on</strong> Health Perspect 11:75-77.<br />
NIOSH. 1977. A cross-secti<strong>on</strong>al epidemiologic survey of vinyl chloride workers. Cincinnati, OH:U.S.<br />
Department of Health and Human Services, Nati<strong>on</strong>al Institute for Occupati<strong>on</strong>al Safety and<br />
Health, Divisi<strong>on</strong> of Surveillance, Hazard Evaluati<strong>on</strong>s, and Field Studies. PB274193.
<str<strong>on</strong>g>Vinyl</str<strong>on</strong>g> chloride<br />
Page 33<br />
Pirastu R, BAccini M, Biggeri A, Comba P. 2003. Cohort study of vinyl chloride exposed workers in<br />
Porto Marghera: update of the mortality follow-up. Epidemiol Prev 27: 161-172.<br />
Purchase, IFH, Stafford J, Paddle GM. 1987. <str<strong>on</strong>g>Vinyl</str<strong>on</strong>g> chloride: an assessment of the risk of occupati<strong>on</strong>al<br />
exposure. Food Chem Toxicol 25(2):187-202.<br />
Rinsky RA, Ott G, Ward E, et al. 1988. Study of mortality am<strong>on</strong>g chemical workers in the Kanawha<br />
Valley of West Virginia. Am J Ind Med 13:429-438.<br />
Scélo G, C<strong>on</strong>stantinescu V, Csiki I, Zaridze D, Szeszenia-Dabrowska N, Rudnai P, Lissowska J,<br />
Fabiánová E, Cassidy A, Slamova A, Foretova L, Janout V, Fevotte J, Fletcher T, Mannetje A,<br />
Brennan P, Boffetta P. 2004. Occupati<strong>on</strong>al exposure to vinyl chloride, acryl<strong>on</strong>itrile and styrene<br />
and lung cancer risk (europe). Cancer Causes C<strong>on</strong>trol Jun;15(5):445-52.<br />
Sugita M, Masuda Y, TDuchiya K. 1986. Early detecti<strong>on</strong> and signs of hepatoangiosarcoma am<strong>on</strong>g vinyl<br />
chloride workers. Am J Ind Med 10:411-417.<br />
Teta MJ, Schnatter AR, Ott MG, et al. 1990. Mortality surveillance in a large chemical company: The<br />
Uni<strong>on</strong> Carbide Corporati<strong>on</strong> experience, 1974-1983. Am J Ind Med 17:435-447.<br />
Theriault G, Allard P. 1981. Cancer mortality of a group of Canadian workers exposed to vinyl chloride<br />
m<strong>on</strong>omer. J Occup Med 23:671-676.<br />
Ungvary G, Hudak A, Tatrai E, et al. 1978. Effects of vinyl chloride exposure al<strong>on</strong>e and in combinati<strong>on</strong><br />
with trypan blue-applied systematically during all thirds of pregnancy <strong>on</strong> the fetuses of CFY rats.<br />
Toxicology 11:45-54<br />
Watanabe PG, McGowan GR, Madrid EO, et al. 1976. Fate of [14C] vinyl chloride following inhalati<strong>on</strong><br />
exposure in rats. Toxicol Appl Pharmacol 37:49-59.<br />
Watanabe PG, Zempel JA, Gehring PJ. 1978. Comparis<strong>on</strong> of the fate of vinyl chloride following single<br />
and repeated exposure in rats. Toxicol Appl Pharmacol 44:391-399.<br />
Waxweiler RJ, Stringer W, Wagner JK, et al. 1976. Neoplastic risk am<strong>on</strong>g workers exposed to vinyl<br />
chloride. Ann NY Acad Sci 271:40-48.<br />
Weber H, Reinl W, Greiser E. 1981. German investigati<strong>on</strong>s <strong>on</strong> morbidity and mortality of workers<br />
exposed to vinyl chloride. Envir<strong>on</strong> Health Perspect 41:95-99.<br />
Weihrauch M, Lehnert G, Kockerling F, et al. 2000. p53 Mutati<strong>on</strong> pattern in hepatocellular carcinoma in<br />
workers exposed to vinyl chloride. Cancer 88(5):1030-1036.<br />
Withey JR. 1976. Pharmacodynamics and uptake of vinyl chloride m<strong>on</strong>omer administered by various<br />
routes to rats. J Toxicol Envir<strong>on</strong> Health 1:381-394.<br />
W<strong>on</strong>g R-H, Chen P-C, Du C-l, et al. 2002. An increased standardized mortality ratio for liver cancer<br />
am<strong>on</strong>g polyvinyl chloride workers in Taiwan. Occup Envir<strong>on</strong> Med 59:405-409.<br />
W<strong>on</strong>g R-H, Chen P-C, Wang J-D, et al. 2003. Interacti<strong>on</strong> of vinyl chloride m<strong>on</strong>omer exposure and<br />
hepatitis B viral infecti<strong>on</strong> <strong>on</strong> liver cancer. J Occup Envir<strong>on</strong> Med 45(4):379-383.
<str<strong>on</strong>g>Vinyl</str<strong>on</strong>g> chloride<br />
Page 34<br />
Wu W, Steenland K, Brown D, et al. 1989. Cohort and case-c<strong>on</strong>trol analyses of workers exposed to vinyl<br />
chloride: An update. J Occup Med 31:518-523.
<str<strong>on</strong>g>Vinyl</str<strong>on</strong>g> chloride<br />
Page 35<br />
Appendix A. Benchmark Dose Modeling Results for Thornt<strong>on</strong> et al.<br />
(2002)<br />
BMD modeling was c<strong>on</strong>ducted to determine the BMCL10 from the Thornt<strong>on</strong> et al. (2002) study using<br />
USEPA Benchmark Dose Software versi<strong>on</strong> 1.4.1b. Modeling was performed <strong>on</strong> centrilobular hypertrophy<br />
data from F1 female rats (see Table 11 of Thornt<strong>on</strong> et al. 2002). A similar effect was seen in F0 female rats<br />
although the incidence observed at 10 ppm was not statistically significant as in the F1 females. See the<br />
table below for model inputs. The highest c<strong>on</strong>centrati<strong>on</strong> of 1100 ppm was not included in the modeling<br />
because 100% incidence occurred at both the 100 and 1100 ppm c<strong>on</strong>centrati<strong>on</strong>s and in order to obtain a<br />
better visualizati<strong>on</strong> of fit in the lower dose range. Similar results were obtained if the highest<br />
c<strong>on</strong>centrati<strong>on</strong> was included (data not shown).<br />
Dose (ppm) Incidence of centrilobular<br />
hypertrophy observed<br />
Sample Size<br />
0 0 30<br />
10 6 30<br />
100 30 30<br />
1100 30 30<br />
a<br />
C<strong>on</strong>centrati<strong>on</strong> of 1100 ppm was not included in the modeling.<br />
All available dichotomous models were run to determine which model best fit the data. The results of the<br />
modeling are presented below.<br />
Benchmark Dose Modeling Results<br />
BMDS Model AIC Goodness of<br />
fit p-value<br />
Chi-squared pvalue<br />
(Scaled<br />
Residual)<br />
BMC BMCL10<br />
Weibull 34.02 0.9992 0.000 c 6.72 3.02<br />
Probit 34.02 0.9997 0.000 c 8.57 5.09<br />
Log-logistic 34.02 0.9997 -0.000 c 9.14 5.21<br />
Gamma a 34.02 0.9995 0.000 c 7.77 3.14<br />
Multistage b 32.02 1.0000 -0.000 c 6.87 2.72<br />
Quantal Linear 35.27 0.3286 -1.126 d 3.03 2.04<br />
a Restrict power >=1<br />
b Restrict betas >=0; Degree of polynomial = 2<br />
c Scaled residual at estimated probability of 0.2<br />
b Scaled residual at estimated probability of 0.29<br />
The results for the six dichotomous models are presented in this Appendix. The Multistage model<br />
provided the best fit as assessed by the AIC value. Therefore, the BMCL10 value of 2.72 ppm, derived<br />
from the Multistage model, was selected as the POD for calculating the chr<strong>on</strong>ic ReV.
<str<strong>on</strong>g>Vinyl</str<strong>on</strong>g> chloride<br />
Page 36<br />
====================================================================<br />
Gamma Model. (Versi<strong>on</strong>: 2.8; Date: 02/20/2007)<br />
Input Data File: THORNTON_VC_DATA.(d)<br />
Gnuplot Plotting File: THORNTON_VC_DATA.plt<br />
Tue Feb 19 09:25:33 2008<br />
====================================================================<br />
BMDS MODEL RUN<br />
~~~~~~~~~~~~~~~~~~~~~~~~~~~~~~~~~~~~~~~~~~~~~~~~~~~~~~~~~~~~~~~~~~~~~<br />
The form of the probability functi<strong>on</strong> is:<br />
P[resp<strong>on</strong>se]= background+(1-background)*CumGamma[slope*dose,power],<br />
where CumGamma(.) is the cummulative Gamma distributi<strong>on</strong> functi<strong>on</strong><br />
Dependent variable = COLUMN2<br />
Independent variable = COLUMN1<br />
Power parameter is restricted as power >=1<br />
Total number of observati<strong>on</strong>s = 3<br />
Total number of records with missing values = 0<br />
Maximum number of iterati<strong>on</strong>s = 250<br />
Relative Functi<strong>on</strong> C<strong>on</strong>vergence has been set to: 1e-008<br />
Parameter C<strong>on</strong>vergence has been set to: 1e-008<br />
Default Initial (and Specified) Parameter Values<br />
Background = 0.016129<br />
Slope = 0.0220876<br />
Power = 1.3<br />
Asymptotic Correlati<strong>on</strong> Matrix of Parameter Estimates<br />
( *** The model parameter(s) -Background<br />
have been estimated at a boundary point, or have been specified by the user,<br />
and do not appear in the correlati<strong>on</strong> matrix )<br />
Slope Power<br />
Slope 1 1<br />
Power 1 1<br />
Parameter Estimates<br />
95.0% Wald C<strong>on</strong>fidence Interval<br />
Variable Estimate Std. Err. Lower C<strong>on</strong>f. Limit Upper C<strong>on</strong>f. Limit<br />
Background 0 NA<br />
Slope 0.277171 29.4759 -57.4945 58.0489<br />
Power 4.60287 370.467 -721.498 730.704<br />
NA - Indicates that this parameter has hit a bound implied by some inequality c<strong>on</strong>straint and thus has no<br />
standard error.
<str<strong>on</strong>g>Vinyl</str<strong>on</strong>g> chloride<br />
Page 37<br />
Analysis of Deviance Table<br />
Model Log(likelihood) # Param's Deviance Test d.f. P-value<br />
Full model -15.0121 3<br />
Fitted model -15.0121 2 7.45603e-007 1 0.9993<br />
Reduced model -60.5711 1 91.118 2
<str<strong>on</strong>g>Vinyl</str<strong>on</strong>g> chloride<br />
Page 38<br />
====================================================================<br />
Logistic Model. (Versi<strong>on</strong>: 2.9; Date: 02/20/2007)<br />
Input Data File: THORNTON_VC_DATA.(d)<br />
Gnuplot Plotting File: THORNTON_VC_DATA.plt<br />
Tue Feb 19 09:54:17 2008<br />
====================================================================<br />
BMDS MODEL RUN<br />
~~~~~~~~~~~~~~~~~~~~~~~~~~~~~~~~~~~~~~~~~~~~~~~~~~~~~~~~~~~~~~~~~~~~~<br />
The form of the probability functi<strong>on</strong> is:<br />
P[resp<strong>on</strong>se] = background+(1-background)/[1+EXP(-intercept-slope*Log(dose))]<br />
Dependent variable = COLUMN2<br />
Independent variable = COLUMN1<br />
Slope parameter is restricted as slope >= 1<br />
Total number of observati<strong>on</strong>s = 3<br />
Total number of records with missing values = 0<br />
Maximum number of iterati<strong>on</strong>s = 250<br />
Relative Functi<strong>on</strong> C<strong>on</strong>vergence has been set to: 1e-008<br />
Parameter C<strong>on</strong>vergence has been set to: 1e-008<br />
User has chosen the log transformed model<br />
Default Initial Parameter Values<br />
background = 0<br />
intercept = -6.88346<br />
slope = 2.38739<br />
Asymptotic Correlati<strong>on</strong> Matrix of Parameter Estimates<br />
( *** The model parameter(s) -background have been estimated at a boundary point, or have been<br />
specified by the user, and do not appear in the correlati<strong>on</strong> matrix )<br />
intercept slope<br />
intercept NA NA<br />
s lope NA NA<br />
NA - This parameter's variance has been estimated as zero or less. THE MODEL HAS PROBABLY<br />
NOT CONVERGED!!!<br />
Parameter Estimates<br />
95.0% Wald C<strong>on</strong>fidence Interval<br />
Variable Estimate Std. Err. Lower C<strong>on</strong>f. Limit Upper C<strong>on</strong>f. Limit<br />
background 0 * * *<br />
intercept -22.1555 * * *<br />
slope 9.01996 * * *<br />
* - Indicates that this value is not calculated.
<str<strong>on</strong>g>Vinyl</str<strong>on</strong>g> chloride<br />
Page 39<br />
At least some variance estimates are negative.<br />
THIS USUALLY MEANS THE MODEL HAS NOT CONVERGED!<br />
Try again from another starting point.<br />
Analysis of Deviance Table<br />
Model Log(likelihood) # Param's Deviance Test d.f. P-value<br />
Full model -15.0121 3<br />
Fitted model -15.0121 2 2.29261e-007 1 0.9996<br />
Reduced model -60.5711 1 91.118 2
<str<strong>on</strong>g>Vinyl</str<strong>on</strong>g> chloride<br />
Page 40<br />
====================================================================<br />
Multistage Model. (Versi<strong>on</strong>: 2.8; Date: 02/20/2007)<br />
Input Data File: THORNTON_VC_DATA.(d)<br />
Gnuplot Plotting File: THORNTON_VC_DATA.plt<br />
Tue Feb 19 09:57:04 2008<br />
====================================================================<br />
BMDS MODEL RUN<br />
~~~~~~~~~~~~~~~~~~~~~~~~~~~~~~~~~~~~~~~~~~~~~~~~~~~~~~~~~~~~~~~~~~~~~<br />
The form of the probability functi<strong>on</strong> is:<br />
P[resp<strong>on</strong>se] = background + (1-background)*[1-EXP(-beta1*dose^1-beta2*dose^2)]<br />
The parameter betas are restricted to be positive<br />
Dependent variable = COLUMN2<br />
Independent variable = COLUMN1<br />
Total number of observati<strong>on</strong>s = 3<br />
Total number of records with missing values = 0<br />
Total number of parameters in model = 3<br />
Total number of specified parameters = 0<br />
Degree of polynomial = 2<br />
Maximum number of iterati<strong>on</strong>s = 250<br />
Relative Functi<strong>on</strong> C<strong>on</strong>vergence has been set to: 1e-008<br />
Parameter C<strong>on</strong>vergence has been set to: 1e-008<br />
Default Initial Parameter Values<br />
Background = 0<br />
Beta(1) = 0<br />
Beta(2) = 1.00495e+016<br />
Asymptotic Correlati<strong>on</strong> Matrix of Parameter Estimates<br />
( *** The model parameter(s) -Background -Beta(1) have been estimated at a boundary point,<br />
or have been specified by the user, and do not appear in the correlati<strong>on</strong> matrix )<br />
Beta(2)<br />
Beta(2) 1<br />
Parameter Estimates<br />
95.0% Wald C<strong>on</strong>fidence Interval<br />
Variable Estimate Std. Err. Lower C<strong>on</strong>f. Limit Upper C<strong>on</strong>f. Limit<br />
Background 0 * * *<br />
Beta(1) 0 * * *<br />
Beta(2) 0.00223144 * * *<br />
* - Indicates that this value is not calculated.
<str<strong>on</strong>g>Vinyl</str<strong>on</strong>g> chloride<br />
Page 41<br />
Analysis of Deviance Table<br />
Model Log(likelihood) # Param's Deviance Test d.f. P-value<br />
Full model -15.0121 3<br />
Fitted model -15.0121 1 1.22224e-008 2 1<br />
Reduced model -60.5711 1 91.118 2
<str<strong>on</strong>g>Vinyl</str<strong>on</strong>g> chloride<br />
Page 42<br />
====================================================================<br />
Probit Model. (Versi<strong>on</strong>: 2.8; Date: 02/20/2007)<br />
Input Data File: THORNTON_VC_DATA.(d)<br />
Gnuplot Plotting File: THORNTON_VC_DATA.plt<br />
Tue Feb 19 09:59:46 2008<br />
====================================================================<br />
BMDS MODEL RUN<br />
~~~~~~~~~~~~~~~~~~~~~~~~~~~~~~~~~~~~~~~~~~~~~~~~~~~~~~~~~~~~~~~~~~~~~<br />
The form of the probability functi<strong>on</strong> is:<br />
P[resp<strong>on</strong>se] = Background<br />
+ (1-Background) * CumNorm(Intercept+Slope*Log(Dose)),<br />
where CumNorm(.) is the cumulative normal distributi<strong>on</strong> functi<strong>on</strong><br />
Dependent variable = COLUMN2<br />
Independent variable = COLUMN1<br />
Slope parameter is restricted as slope >= 1<br />
Total number of observati<strong>on</strong>s = 3<br />
Total number of records with missing values = 0<br />
Maximum number of iterati<strong>on</strong>s = 250<br />
Relative Functi<strong>on</strong> C<strong>on</strong>vergence has been set to: 1e-008<br />
Parameter C<strong>on</strong>vergence has been set to: 1e-008<br />
User has chosen the log transformed model<br />
Default Initial (and Specified) Parameter Values<br />
background = 0<br />
intercept = -3.82444<br />
slope = 1.29542<br />
Asymptotic Correlati<strong>on</strong> Matrix of Parameter Estimates<br />
( *** The model parameter(s) -background have been estimated at a boundary point, or have been<br />
specified by the user, and do not appear in the correlati<strong>on</strong> matrix )<br />
intercept slope<br />
intercept 1 -1<br />
slope -1 1<br />
Parameter Estimates<br />
95.0% Wald C<strong>on</strong>fidence Interval<br />
Variable Estimate Std. Err. Lower C<strong>on</strong>f. Limit Upper C<strong>on</strong>f. Limit<br />
background 0 NA<br />
intercept -7.44001 399.639 -790.718 775.838<br />
slope 2.86564 173.561 -337.308 343.039<br />
NA - Indicates that this parameter has hit a bound implied by some inequality c<strong>on</strong>straint and thus has<br />
no standard error.
<str<strong>on</strong>g>Vinyl</str<strong>on</strong>g> chloride<br />
Page 43<br />
Analysis of Deviance Table<br />
Model Log(likelihood) # Param's Deviance Test d.f. P-value<br />
Full model -15.0121 3<br />
Fitted model -15.0121 2 2.57224e-007 1 0.9996<br />
Reduced model -60.5711 1 91.118 2
<str<strong>on</strong>g>Vinyl</str<strong>on</strong>g> chloride<br />
Page 44<br />
====================================================================<br />
Quantal Linear Model using Weibull Model (Versi<strong>on</strong>: 2.7; Date: 2/20/2007)<br />
Input Data File: THORNTON_VC_DATA.(d)<br />
Gnuplot Plotting File: THORNTON_VC_DATA.plt<br />
Tue Feb 19 10:01:01 2008<br />
====================================================================<br />
BMDS MODEL RUN<br />
~~~~~~~~~~~~~~~~~~~~~~~~~~~~~~~~~~~~~~~~~~~~~~~~~~~~~~~~~~~~~~~~~~~~~<br />
The form of the probability functi<strong>on</strong> is:<br />
P[resp<strong>on</strong>se] = background + (1-background)*[1-EXP(-slope*dose)]<br />
Dependent variable = COLUMN2<br />
Independent variable = COLUMN1<br />
Total number of observati<strong>on</strong>s = 3<br />
Total number of records with missing values = 0<br />
Maximum number of iterati<strong>on</strong>s = 250<br />
Relative Functi<strong>on</strong> C<strong>on</strong>vergence has been set to: 1e-008<br />
Parameter C<strong>on</strong>vergence has been set to: 1e-008<br />
Default Initial (and Specified) Parameter Values<br />
Background = 0.016129<br />
Slope = 0.0411087<br />
Power = 1 Specified<br />
Asymptotic Correlati<strong>on</strong> Matrix of Parameter Estimates<br />
( *** The model parameter(s) -Background -Power<br />
have been estimated at a boundary point, or have been specified by the user,<br />
and do not appear in the correlati<strong>on</strong> matrix )<br />
Slope<br />
Slope 1<br />
Parameter Estimates<br />
95.0% Wald C<strong>on</strong>fidence Interval<br />
Variable Estimate Std. Err. Lower C<strong>on</strong>f. Limit Upper C<strong>on</strong>f. Limit<br />
Background 0 NA<br />
Slope 0.0347668 0.00822327 0.0186495 0.0508842<br />
NA - Indicates that this parameter has hit a bound<br />
implied by some inequality c<strong>on</strong>straint and thus<br />
has no standard error.
<str<strong>on</strong>g>Vinyl</str<strong>on</strong>g> chloride<br />
Page 45<br />
Analysis of Deviance Table<br />
Model Log(likelihood) # Param's Deviance Test d.f. P-value<br />
Full model -15.0121 3<br />
Fitted model -16.6378 1 3.2515 2 0.1968<br />
Reduced model -60.5711 1 91.118 2
<str<strong>on</strong>g>Vinyl</str<strong>on</strong>g> chloride<br />
Page 46<br />
====================================================================<br />
Weibull Model using Weibull Model (Versi<strong>on</strong>: 2.7; Date: 2/20/2007)<br />
Input Data File: THORNTON_VC_DATA.(d)<br />
Gnuplot Plotting File: THORNTON_VC_DATA.plt<br />
Tue Feb 19 10:03:01 2008<br />
====================================================================<br />
BMDS MODEL RUN<br />
~~~~~~~~~~~~~~~~~~~~~~~~~~~~~~~~~~~~~~~~~~~~~~~~~~~~~~~~~~~~~~~~~~~~~<br />
The form of the probability functi<strong>on</strong> is:<br />
P[resp<strong>on</strong>se] = background + (1-background)*[1-EXP(-slope*dose^power)]<br />
Dependent variable = COLUMN2<br />
Independent variable = COLUMN1<br />
Power parameter is restricted as power >=1<br />
Total number of observati<strong>on</strong>s = 3<br />
Total number of records with missing values = 0<br />
Maximum number of iterati<strong>on</strong>s = 250<br />
Relative Functi<strong>on</strong> C<strong>on</strong>vergence has been set to: 1e-008<br />
Parameter C<strong>on</strong>vergence has been set to: 1e-008<br />
Default Initial (and Specified) Parameter Values<br />
Background = 0.016129<br />
Slope = 0.000177727<br />
Power = 2.18209<br />
Asymptotic Correlati<strong>on</strong> Matrix of Parameter Estimates<br />
( *** The model parameter(s) -Background have been estimated at a boundary point, or have<br />
been specified by the user, and do not appear in the correlati<strong>on</strong> matrix )<br />
Slope Power<br />
Slope 1 -1<br />
Power -1 1<br />
Parameter Estimates<br />
95.0% Wald C<strong>on</strong>fidence Interval<br />
Variable Estimate Std. Err. Lower C<strong>on</strong>f. Limit Upper C<strong>on</strong>f. Limit<br />
Background 0 NA<br />
Slope 0.00285124 0.0804699 -0.154867 0.160569<br />
Power 1.89348 12.2573 -22.1305 25.9174<br />
NA - Indicates that this parameter has hit a bound<br />
implied by some inequality c<strong>on</strong>straint and thus<br />
has no standard error.
<str<strong>on</strong>g>Vinyl</str<strong>on</strong>g> chloride<br />
Page 47<br />
Analysis of Deviance Table<br />
Model Log(likelihood) # Param's Deviance Test d.f. P-value<br />
Full model -15.0121 3<br />
Fitted model -15.0121 2 1.7445e-006 1 0.9989<br />
Reduced model -60.5711 1 91.118 2