major risk factors and their management within the ... - Euler Hermes
major risk factors and their management within the ... - Euler Hermes
major risk factors and their management within the ... - Euler Hermes

You also want an ePaper? Increase the reach of your titles
YUMPU automatically turns print PDFs into web optimized ePapers that Google loves.
4 Quantitative<br />
MAJOR RISK FACTORS AND THEIR MANAGEMENT WITHIN THE GROUP<br />
<strong>and</strong> qualitative appendices relating to <strong>risk</strong> <strong>factors</strong><br />
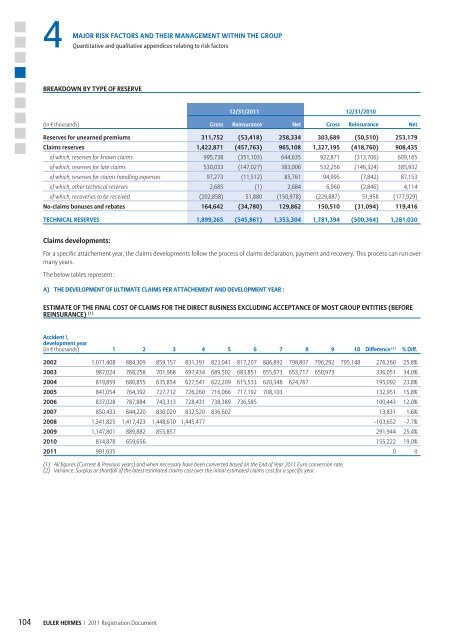
BREAKDOWN BY TYPE OF RESERVE<br />
(in € thous<strong>and</strong>s)<br />
104 EULER HERMES I 2011 Registration Document<br />
12/31/2011 12/31/2010<br />
Gross Reinsurance Net Gross Reinsurance Net<br />
Reserves for unearned premiums 311,752 (53,418) 258,334 303,689 (50,510) 253,179<br />
Claims reserves 1,422,871 (457,763) 965,108 1,327,195 (418,760) 908,435<br />
of which, reserves for known claims 995,738 (351,103) 644,635 922,871 (313,706) 609,165<br />
of which, reserves for late claims 530,033 (147,027) 383,006 532,256 (146,324) 385,932<br />
of which, reserves for claims h<strong>and</strong>ling expenses 97,273 (11,512) 85,761 94,995 (7,842) 87,153<br />
of which, o<strong>the</strong>r technical reserves 2,685 (1) 2,684 6,960 (2,846) 4,114<br />
of which, recoveries to be received (202,858) 51,880 (150,978) (229,887) 51,958 (177,929)<br />
No-claims bonuses <strong>and</strong> rebates 164,642 (34,780) 129,862 150,510 (31,094) 119,416<br />
TECHNICAL RESERVES 1,899,265 (545,961) 1,353,304 1,781,394 (500,364) 1,281,030<br />
Claims developments:<br />
For a specific attachement year, <strong>the</strong> claims developments follow <strong>the</strong> process of claims declaration, payment <strong>and</strong> recovery. This process can run over<br />
many years.<br />
The below tables represent :<br />
A) THE DEVELOPMENT OF ULTIMATE CLAIMS PER ATTACHEMENT AND DEVELOPMENT YEAR :<br />
ESTIMATE OF THE FINAL COST OF CLAIMS FOR THE DIRECT BUSINESS EXCLUDING ACCEPTANCE OF MOST GROUP ENTITIES (BEFORE<br />
REINSURANCE) (1)<br />
Accident \<br />
development year<br />
(in € thous<strong>and</strong>s) 1 2 3 4 5 6 7 8 9 10 Difference (2) % Diff.<br />
2002 1,071,408 884,309 859,157 831,391 823,041 817,207 806,892 798,807 796,292 795,148 276,260 25.8%<br />
2003 987,024 768,258 701,968 697,434 689,502 683,851 655,673 653,717 650,973 336,051 34.0%<br />
2004 819,859 680,855 635,854 627,541 622,209 615,533 620,348 624,767 195,092 23.8%<br />
2005 841,054 764,392 727,712 726,260 716,066 717,192 708,103 132,951 15.8%<br />
2006 837,028 787,884 743,313 728,431 738,389 736,585 100,443 12.0%<br />
2007 850,433 844,220 830,020 832,520 836,602 13,831 1.6%<br />
2008 1,341,825 1,417,423 1,448,610 1,445,477 -103,652 -7.7%<br />
2009 1,147,801 889,882 855,857 291,944 25.4%<br />
2010 814,878 659,656 155,222 19.0%<br />
2011 991,635 0 0<br />
(1) All figures (Current & Previous years) <strong>and</strong> when necessary have been converted based on <strong>the</strong> End of Year 2011 Euro conversion rate.<br />
(2) Variance: Surplus or shortfall of <strong>the</strong> latest estimated claims cost over <strong>the</strong> initial estimated claims cost for a specific year.