

East and West Africa Cement Companies Report November 2011
East and West Africa Cement Companies Report November 2011
East and West Africa Cement Companies Report November 2011

Create successful ePaper yourself
Turn your PDF publications into a flip-book with our unique Google optimized e-Paper software.
Nature of business<br />
EAPCC’s history dates back to the 1930s, where it started off as a<br />
trader in imported cement from Engl<strong>and</strong>, a grinder of clinker<br />
imported from India <strong>and</strong> as the operator of a 0.12mtpa Athi River<br />
cement plant in 1958. Capacity has since been upped to 1.3mtpa<br />
<strong>and</strong> for 70 years now the company has availed to the market its<br />
flagship Blue Triangle <strong>Cement</strong> br<strong>and</strong>. The company also<br />
manufactures concrete pavers, kerbstones, cement slabs, <strong>and</strong><br />
cement fence posts. It also makes cement tiles, culverts, panels,<br />
<strong>and</strong> tubes for the construction industry.<br />
Review of results for the year ended June <strong>2011</strong><br />
The highlight was the turning around from a loss position last year<br />
to a profit courtesy of a KES 680m tax credit as the company booked<br />
income from its deferred tax assets. Operating efficiencies saw<br />
enhanced operating profitability while exchange losses continued to<br />
weigh down performance.<br />
� Revenue grew by a moderate 8.1% to KES 10.2bn while an<br />
improvement in gross margins from 21.6% to 23.3% saw gross<br />
profit grow by 16.5%. Benefits from the changeover to coal were<br />
only enjoyed in the second half of the year <strong>and</strong> hence we<br />
expect the current financial year to better the <strong>2011</strong> outturn.<br />
� Operating expenses declined by 3.1%, driven by administration<br />
expenses which shed 12.1%. Operating income consequently<br />
leapt 7.1x to KES 653m.<br />
� The depreciation of the KES saw the company book an<br />
additional KES 783m loss despite erecting a hedge to cover<br />
possible losses on 25% of the YEN denominated loan.<br />
� Interest bearing loans stood at KES 3.7bn, the majority of which<br />
relate to the YEN denominated loan. The loan amounted to KES<br />
3.0bn when it was acquired <strong>and</strong> it continues to grow despite the<br />
company making regular payments over the years.<br />
Valuations <strong>and</strong> recommendation<br />
We value EAPCC at KES 62.12, which translates to a 13.0% premium<br />
over the current price. The share lost half its value over the past 12<br />
months <strong>and</strong> is trading with relative weakness to both its peers <strong>and</strong><br />
the market (NSE 20).<br />
We expect efficiency enhancement moves effected in the second<br />
half of <strong>2011</strong> to drive operating profitability during the current year.<br />
Additionally, the intervention of the Kenyan authorities to stabilise<br />
the shilling is expected to be largely successful. As such, we do not<br />
expect exchange losses to provide a significant drag to earnings in<br />
Q4 <strong>2011</strong>. Risk of earnings however will remain for as long as the<br />
debt position is not fully hedged.<br />
However, the low free float of 6% <strong>and</strong> government ownership are<br />
the biggest bear factors for EAPCC. The EV/tonne of USD 66.4<br />
compared to a peer average of USD 200 represent the potential<br />
upside that can be unlocked especially if the company is privatised.<br />
On the other h<strong>and</strong>, the EV/EBIDTA of 9.6x is a premium to the peer<br />
average of 7.1x. We therefore maintain our SELL call on the stock.<br />
30<br />
Top shareholders % age<br />
NSFF 27.0%<br />
GoK 25.3%<br />
<strong>Cement</strong>ia (Lafarge) 14.6%<br />
BCI 14.6%<br />
Bamburi (Nominees) 12.5%<br />
Others 6.0%<br />
mtpa<br />
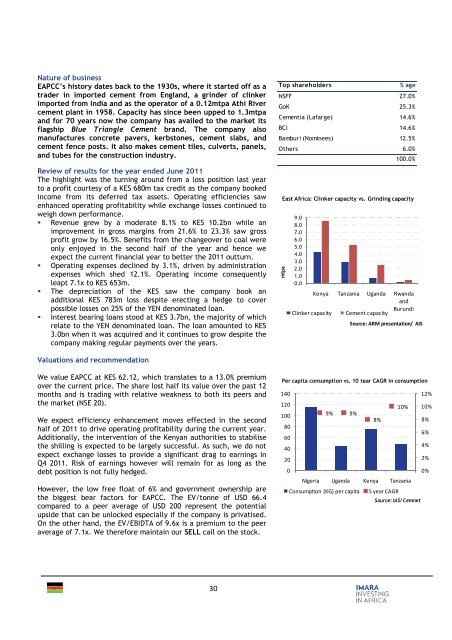
<strong>East</strong> <strong>Africa</strong>: Clinker capacity vs. Grinding capacity<br />
9.0<br />
8.0<br />
7.0<br />
6.0<br />
5.0<br />
4.0<br />
3.0<br />
2.0<br />
1.0<br />
0.0<br />
Kenya Tanzania Ug<strong>and</strong>a Rw<strong>and</strong>a<br />
<strong>and</strong><br />
Burundi<br />
Clinker capacity <strong>Cement</strong> capacity<br />
9% 9%<br />
Source: ARM presentation/ AIS<br />
Per capita consumption vs. 10 tear CAGR in consumption<br />
140<br />
120<br />
100<br />
80<br />
60<br />
40<br />
20<br />
0<br />
8%<br />
10%<br />
Nigeria Ug<strong>and</strong>a Kenya Tanzania<br />
Consumption (KG) per capita 5 year CAGR<br />
100.0%<br />
Source: IAS/ Cemnet<br />
12%<br />
10%<br />
8%<br />
6%<br />
4%<br />
2%<br />
0%