- Page 1 and 2:
lR;eso t;rs State of Environment Re
- Page 5:
© Ministry of Environment and Fore
- Page 10 and 11:
Executive Summary In the global con
- Page 12 and 13:
guideline to help planners and mana
- Page 15 and 16:
CHAPTER - 1 OVERVIEW
- Page 17 and 18:
in the world, India stands apart fr
- Page 19 and 20:
India’s forest cover ranges from
- Page 21:
These include increasing importance
- Page 24 and 25:
LAND India is the seventh largest c
- Page 26 and 27:
The varying degrees and types of de
- Page 28 and 29:
The total tree cover of the country
- Page 30 and 31:
thematic maps like land capability
- Page 32 and 33:
A view of Annamalai forest machine
- Page 34 and 35:
AIR In India, air pollution is prov
- Page 36 and 37:
Air borne emissions emitted from va
- Page 38 and 39:
almost all the locations as per the
- Page 40 and 41:
3 Concentration (µg/m ) 3 Concentr
- Page 42 and 43:
3 Concentration (µg/m ) 3 Concentr
- Page 44 and 45:
Sl. No. per cent), pharyngitis (16.
- Page 46 and 47:
2 Sl.No. Cooking fuel Tuberculosis
- Page 48 and 49:
Source: Central Pollution Control B
- Page 50 and 51:
identified sixteen cities namely; H
- Page 52 and 53:
issued for adherence to idling emis
- Page 54 and 55:
WATER From the East to the West and
- Page 56 and 57:
yields or even total crop failure.
- Page 58 and 59:
Source: Ministry of Water Resources
- Page 60 and 61:
Wastewater from industrial activiti
- Page 62 and 63:
�Socially disadvantaged groups su
- Page 64 and 65:
BIODIVERSITY India is one of the 17
- Page 66 and 67:
Buffalo (Bubalus bubalis) in a smal
- Page 68 and 69:
Table 2.4.1: State-wise List of Wet
- Page 70 and 71:
Meghalaya as well as the plain regi
- Page 72 and 73:
2 while open mangrove covers an are
- Page 74 and 75:
infant mortality and are susceptibl
- Page 76 and 77:
iii. Regulation of introduction of
- Page 78 and 79:
network of biosphere reserves has i
- Page 80 and 81:
66 State Of Environment Report-2009
- Page 82 and 83:
Source: Wildlife Institute of India
- Page 84 and 85:
disclosure. The Act mandatorily req
- Page 87 and 88:
CHAPTER - 3 KEY ENVIRONME NTAL ISSU
- Page 89 and 90:
�Extreme rise in maximum and mini
- Page 91 and 92:
Figure 3.1.3: Natural Hazards Affec
- Page 93 and 94:
Forests Preliminary assessments, us
- Page 95 and 96:
drought include incurred demand of
- Page 97 and 98:
Development of Pre-fab modular hous
- Page 99 and 100:
Climate change will lead to an incr
- Page 101 and 102:
�Poverty Poverty has been identif
- Page 103 and 104:
Flood in Bihar bodies in putting in
- Page 105 and 106:
After registering impressive gains
- Page 107 and 108:
low yields of pulses, the main prot
- Page 109 and 110:
Table 3.2.4 : Average Annual Growth
- Page 111 and 112: There are many factors limiting agr
- Page 113 and 114: (ii) National Food Security Mission
- Page 115 and 116: 6. Establishment of a water securit
- Page 117 and 118: Temporal Challenge Almost 80 per ce
- Page 119 and 120: growing population, there will be g
- Page 121 and 122: IMPACT Most human activities whethe
- Page 123 and 124: Figure 3.3.3 : The Concept of the
- Page 125 and 126: 1. Chennai Petroleum Corporation Li
- Page 127 and 128: for the education and training of p
- Page 129 and 130: framework for integrated water reso
- Page 131 and 132: anging from Andhra Pradesh, borderi
- Page 133 and 134: The Ministry of Petroleum and Natur
- Page 135 and 136: 2. RENEWABLE ENERGY India is blesse
- Page 137 and 138: d) Geothermal Energy It has been es
- Page 139 and 140: Source: Annual Report 2007-08, Mini
- Page 141 and 142: GW (mtoe) 900 800 700 600 500 400 3
- Page 143 and 144: electricity with the focus on deman
- Page 145 and 146: Energy Conservation potential in th
- Page 147 and 148: engaged in the field of oilseed cul
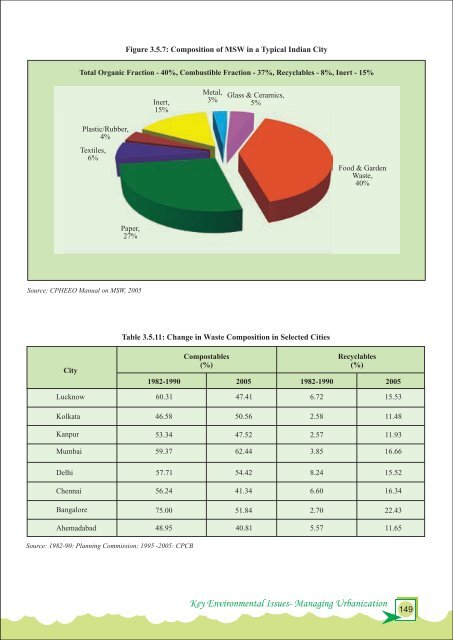
- Page 149 and 150: Census Years Source : Census of Ind
- Page 151 and 152: Census Years According to the Censu
- Page 153 and 154: Opportunities in urban areas for em
- Page 155 and 156: 6) Transport Urban areas in India,
- Page 157 and 158: Figure 3.5.3: Households with Impro
- Page 159 and 160: The higher percentages of urban san
- Page 161: sources of pollution is to integrat
- Page 165 and 166: Box 3.5.4: Recycling Waste In Namak
- Page 167 and 168: No. of Dumpsites Electronic Waste (
- Page 169 and 170: 5. National Urban Transport Policy,
- Page 171: Sectors under this scheme are: �R
- Page 174 and 175: Managing natural resources requires
- Page 176 and 177: of time and is also constantly evol
- Page 178 and 179: The role and the reach of various m
- Page 180 and 181: processes, goods and services, faci
- Page 182 and 183: 168 State Of Environment Report-200
- Page 184 and 185: Table 3.4.3 Type-wise and Category-
- Page 186 and 187: 172 Sensitization/Stakeholders Work
- Page 188 and 189: 15. Mr. Prakash Rao Senior Coordina
- Page 190 and 191: 176 Consultation Workshop on ‘Dra
- Page 192 and 193: 15. Ms. Shipla Chohan Advocate Envi
- Page 194: Ministry of Environment & Forests P