lR;eso t;rs - Ministry of Environment and Forests
lR;eso t;rs - Ministry of Environment and Forests
lR;eso t;rs - Ministry of Environment and Forests

You also want an ePaper? Increase the reach of your titles
YUMPU automatically turns print PDFs into web optimized ePapers that Google loves.
3<br />
Concentration (µg/m )<br />
3<br />
Concentration (µg/m )<br />
70<br />
60<br />
50<br />
40<br />
30<br />
20<br />
10<br />
0<br />
60<br />
50<br />
40<br />
30<br />
20<br />
10<br />
0<br />
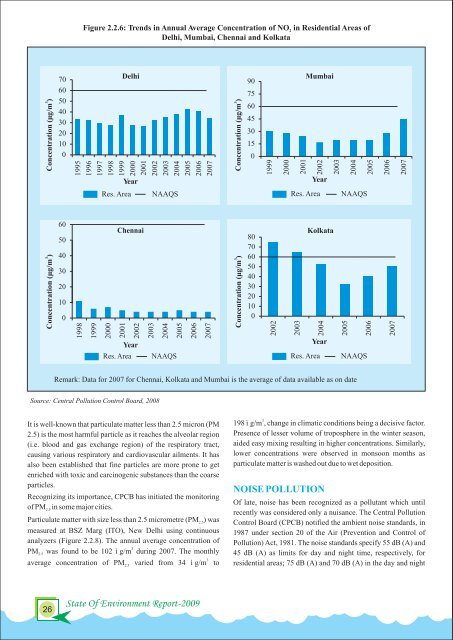
Figure 2.2.6: Trends in Annual Average Concentration <strong>of</strong> NO in Residential Areas <strong>of</strong><br />
2<br />
Delhi, Mumbai, Chennai <strong>and</strong> Kolkata<br />
1995<br />
1996<br />
1997<br />
1998<br />
1998<br />
1999<br />
1999<br />
Delhi<br />
Source: Central Pollution Control Board, 2008<br />
2000<br />
2001<br />
2002<br />
2003<br />
2004<br />
2005<br />
2006<br />
2007<br />
Year<br />
Res. Area NAAQS<br />
2000<br />
Chennai<br />
2001<br />
2002<br />
Year<br />
2003<br />
2004<br />
Res. Area NAAQS<br />
2005<br />
2006<br />
2007<br />
3<br />
Concentration (µg/m )<br />
3<br />
Concentration (µg/m )<br />
90<br />
75<br />
60<br />
45<br />
30<br />
15<br />
0<br />
80<br />
70<br />
60<br />
50<br />
40<br />
30<br />
20<br />
10<br />
0<br />
1999<br />
2002<br />
2000<br />
2003<br />
2001<br />
Mumbai<br />
2002<br />
Year<br />
Kolkata<br />
Remark: Data for 2007 for Chennai, Kolkata <strong>and</strong> Mumbai is the average <strong>of</strong> data available as on date<br />
It is well-known that particulate matter less than 2.5 micron (PM<br />
2.5) is the most harmful particle as it reaches the alveolar region<br />
(i.e. blood <strong>and</strong> gas exchange region) <strong>of</strong> the respiratory tract,<br />
causing various respiratory <strong>and</strong> cardiovascular ailments. It has<br />
also been established that fine particles are more prone to get<br />
enriched with toxic <strong>and</strong> carcinogenic substances than the coa<strong>rs</strong>e<br />
particles.<br />
Recognizing its importance, CPCB has initiated the monitoring<br />
<strong>of</strong> PM in some major cities.<br />
2.5<br />
Particulate matter with size less than 2.5 micrometre (PM 2.5)<br />
was<br />
measured at BSZ Marg (ITO), New Delhi using continuous<br />
analyze<strong>rs</strong> (Figure 2.2.8). The annual average concentration <strong>of</strong><br />
3<br />
PM was found to be 102 ìg/m during 2007. The monthly<br />
2.5<br />
3<br />
average concentration <strong>of</strong> PM 2.5 varied from 34 ìg/m to<br />
26<br />
State Of <strong>Environment</strong> Report-2009<br />
2004<br />
Year<br />
2003<br />
2005<br />
2004<br />
Res. Area NAAQS<br />
Res. Area NAAQS<br />
2005<br />
2006<br />
2006<br />
2007<br />
2007<br />
3<br />
198 ìg/m , change in climatic conditions being a decisive factor.<br />
Presence <strong>of</strong> lesser volume <strong>of</strong> troposphere in the winter season,<br />
aided easy mixing resulting in higher concentrations. Similarly,<br />
lower concentrations were observed in monsoon months as<br />
particulate matter is washed out due to wet deposition.<br />
NOISE POLLUTION<br />
Of late, noise has been recognized as a pollutant which until<br />
recently was considered only a nuisance. The Central Pollution<br />
Control Board (CPCB) notified the ambient noise st<strong>and</strong>ards, in<br />
1987 under section 20 <strong>of</strong> the Air (Prevention <strong>and</strong> Control <strong>of</strong><br />
Pollution) Act, 1981. The noise st<strong>and</strong>ards specify 55 dB (A) <strong>and</strong><br />
45 dB (A) as limits for day <strong>and</strong> night time, respectively, for<br />
residential areas; 75 dB (A) <strong>and</strong> 70 dB (A) in the day <strong>and</strong> night