evaluating the reliability of uranium concentration and isotope ... - Ipen
evaluating the reliability of uranium concentration and isotope ... - Ipen
evaluating the reliability of uranium concentration and isotope ... - Ipen

You also want an ePaper? Increase the reach of your titles
YUMPU automatically turns print PDFs into web optimized ePapers that Google loves.
5th BRAZILIAN CONGRESS OF METROLOGY<br />
Metrology for competitiveness in strategic areas<br />
November, 9 to 13, 2009. Salvador, Bahia – Brazil.<br />
EVALUATING THE RELIABILITY OF URANIUM CONCENTRATION AND ISOTOPE<br />
RATIO MEASUREMENTS VIA AN INTERLABORATORY COMPARISON PROGRAM<br />
Olívio Pereira de Oliveira Junior 1, 2 , Inez Cristina de Oliveira 2 , Marcia Regina Pereira 2 e Eduardo Tanabe 2<br />
Centro Tecnológico da Marinha em São Paulo (CTMSP), São Paulo, Brazil 1<br />
<strong>and</strong><br />
Instituto de Pesquisas Energéticas e Nucleares (IPEN-CNEN-SP), São Paulo, Brazil, oliviojr@ipen.br 2<br />
Abstract: The nuclear fuel cycle is a strategic area for <strong>the</strong><br />
Brazilian development because it is associated with <strong>the</strong><br />
generation <strong>of</strong> electricity needed to boost <strong>the</strong> country’s<br />
economy. Uranium is one <strong>the</strong> key chemical elements in this<br />
cycle <strong>and</strong> its <strong>concentration</strong> <strong>and</strong> <strong>isotope</strong> composition must be<br />
accurately known. In this present work, <strong>the</strong> <strong>reliability</strong> <strong>of</strong> <strong>the</strong><br />
<strong>uranium</strong> <strong>concentration</strong> <strong>and</strong> <strong>isotope</strong> ratio measurements<br />
carried out at <strong>the</strong> CTMSP analytical laboratories is<br />
evaluated by <strong>the</strong> results obtained in an international<br />
interlaboratory comparison program.<br />
Keywords: potentiometric titration, mass spectrometry,<br />
interlaboratory comparison programs.<br />
1. INTRODUCTION<br />
The nuclear fuel cycle comprises <strong>the</strong> processes related to<br />
<strong>the</strong> production <strong>of</strong> nuclear energy, involving technical,<br />
economical, safety <strong>and</strong> environmental aspects [1].<br />
Figure 1. The nuclear fuel cycle<br />
Its first stage is ore mining, followed by milling, <strong>uranium</strong><br />
extraction, <strong>concentration</strong>, purification, conversion to<br />
<strong>uranium</strong> hexafluoride, <strong>isotope</strong> enrichment, conversion to<br />
<strong>uranium</strong> dioxide, fuel fabrication, nuclear fission,<br />
reprocessing, waste management, waste storage <strong>and</strong><br />
decommissioning <strong>of</strong> installations that have processed<br />
nuclear materials [2].<br />
Figure 2. Uranium dioxide (UO2) pellet<br />
The element <strong>uranium</strong> is <strong>the</strong>refore submitted to several<br />
chemical, physical <strong>and</strong> isotopic changes during <strong>the</strong> whole<br />
nuclear fuel cycle. These stages are so intricate <strong>and</strong> complex<br />
that about a twenty-year span is required from <strong>the</strong> initial<br />
mining to <strong>the</strong> final nuclear waste storage [3].<br />
The <strong>uranium</strong> <strong>concentration</strong> <strong>and</strong> isotopic composition<br />
must be accurately known in each stage <strong>of</strong> <strong>the</strong> nuclear fuel<br />
cycle for economic but mainly for nuclear safeguards<br />
reasons [4]. The effectiveness <strong>of</strong> this system depends on <strong>the</strong><br />
<strong>reliability</strong> <strong>of</strong> <strong>the</strong> measurements carried out by laboratories.<br />
Aiming to help <strong>the</strong> improvement <strong>of</strong> <strong>the</strong> measurement results,<br />
a document listing <strong>the</strong> most important nuclear materials, <strong>the</strong><br />
analytical methods used to measure its <strong>concentration</strong> <strong>and</strong><br />
isotopic composition <strong>and</strong> <strong>the</strong> target values for measurement<br />
uncertainties was set in force. The ITV 2000 has become<br />
<strong>the</strong> international reference in judging <strong>the</strong> <strong>reliability</strong> <strong>of</strong><br />
analytical techniques applied to fissile material [5].<br />
The technical requirements <strong>of</strong> <strong>the</strong> ITV 2000 are so<br />
dem<strong>and</strong>ing that it is necessary to apply <strong>the</strong> concepts <strong>and</strong><br />
practices <strong>of</strong> metrology to comply with <strong>the</strong> target values for<br />
measurement uncertainty.
2. OBJECTIVES<br />
The objectives <strong>of</strong> this paper are two-fold: first to present<br />
<strong>the</strong> measurement results <strong>of</strong> <strong>uranium</strong> <strong>concentration</strong> <strong>and</strong><br />
<strong>isotope</strong> composition in a set <strong>of</strong> samples <strong>of</strong> <strong>the</strong> 2008<br />
Safeguards Measurement Evaluation Program (SMEP), an<br />
international interlaboratory comparison program organized<br />
by <strong>the</strong> New Brunswick Laboratory (NBL) to monitor <strong>the</strong><br />
measurement capability that exists in nuclear facilities<br />
worldwide [6].<br />
Second, to compare <strong>the</strong> obtained values <strong>of</strong> measurement<br />
precision <strong>and</strong> bias with <strong>the</strong> requirements <strong>of</strong> <strong>the</strong> ITV 2000.<br />
It is noteworthy that nei<strong>the</strong>r <strong>the</strong> SMEP nor <strong>the</strong> ITV 2000<br />
document have completely adopted <strong>the</strong> modern concept <strong>of</strong><br />
measurement uncertainty, which includes both <strong>the</strong><br />
measurement bias <strong>and</strong> measurement precision, as defined in<br />
<strong>the</strong> BIPM-GUM guide [7] as well as in <strong>the</strong> newest VIM<br />
edition [8].<br />
3. METHODS AND MATERIALS<br />
3.1 Uranium <strong>concentration</strong><br />
The analytical method selected for measuring <strong>the</strong><br />
<strong>uranium</strong> <strong>concentration</strong> was <strong>the</strong> potenciometric titration. This<br />
highly precise <strong>and</strong> accurate method was originally proposed<br />
by Davies <strong>and</strong> Gray [9]. However, <strong>the</strong> procedure actually<br />
used was <strong>the</strong> NBL Modified Davies <strong>and</strong> Gray [10]. The<br />
principle <strong>of</strong> <strong>the</strong> method is <strong>the</strong> following: <strong>uranium</strong> in<br />
concentrated phosphoric acid medium is reduced to U(IV)<br />
with ferrous sulfate; <strong>the</strong> excess Fe (II) ions is removed by<br />
molybdate-catalyzed oxidation with nitric acid. The nitrite<br />
formed in <strong>the</strong> above reaction is removed by sulfamic acid.<br />
The critical step in this method is <strong>the</strong> titration, where <strong>the</strong><br />
U(IV), in <strong>the</strong> presence <strong>of</strong> vanadyl ions, is titrated against a<br />
st<strong>and</strong>ard potassium dichromate. The end point <strong>of</strong> <strong>the</strong><br />
titration is determined through <strong>the</strong> measurement <strong>of</strong> <strong>the</strong><br />
electrode potential <strong>of</strong> <strong>the</strong> solution. The <strong>uranium</strong> content is<br />
calculated from <strong>the</strong> amount <strong>of</strong> dichromate used.<br />
The mesur<strong>and</strong> in this procedure is <strong>the</strong> element <strong>uranium</strong>,<br />
despite <strong>the</strong> fact <strong>the</strong> entity actually measured is U(IV). The<br />
metrological traceability to <strong>the</strong> International System <strong>of</strong> Units<br />
(SI) is established via <strong>the</strong> amount <strong>of</strong> potassium dichromate<br />
used, which, by its turn, was st<strong>and</strong>ardized against <strong>the</strong><br />
solution produced by <strong>the</strong> dissolution <strong>of</strong> certified reference<br />
material CRM NBL 112-A, <strong>uranium</strong> metal assay st<strong>and</strong>ard.<br />
Figure 3. Uranium titration<br />
3.2 Uranium <strong>isotope</strong> ratio<br />
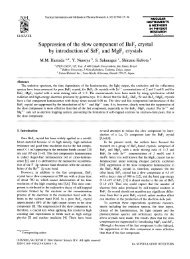
The analytical method selected for measuring <strong>the</strong> <strong>isotope</strong><br />
amount ratios required for calculating <strong>the</strong> <strong>isotope</strong><br />
composition <strong>of</strong> <strong>uranium</strong> samples was mass spectrometry.<br />
Among several different mass spectrometry techniques<br />
presently available, <strong>the</strong>rmal ionization mass spectrometry<br />
(TIMS) was chosen because <strong>of</strong> its high <strong>reliability</strong>.<br />
The mass spectrometer used was <strong>the</strong> THQ, instrument<br />
manufactured by Finnigan MAT (Bremen, Germany). It is<br />
equipped with a sample magazine for thirteen filaments,<br />
quadrupole analyzer <strong>and</strong> one Faraday collector. For small<br />
signals it also has a secondary electron multiplier (SEM).<br />
Samples in this current program were in <strong>the</strong> form <strong>of</strong><br />
pellets <strong>of</strong> <strong>uranium</strong> dioxide (UO2), <strong>uranium</strong> trioxide (UO3) or<br />
tri<strong>uranium</strong> octaoxide (U3O8). They were dissolved with<br />
Suprapur nitric acid <strong>and</strong> <strong>the</strong> resulting uranyl nitrate solutions<br />
were adjusted to <strong>the</strong> <strong>concentration</strong> <strong>of</strong> 1.0 mgU/mL needed<br />
for <strong>isotope</strong> ratio measurements with TIMS.<br />
The rhenium filaments were degassed at 5 A for 30 min<br />
in a high vacuum bake-out unit manufactured by Finnigan<br />
MAT. A sample drop <strong>of</strong> 1.0 µL containing 1.0 µg <strong>of</strong><br />
<strong>uranium</strong> was deposited onto each filament, which was later<br />
dried at 2.0 A for 5 min. These filaments were assembled in<br />
<strong>the</strong> magazine. Each analysis comprised 10 blocks <strong>of</strong> 10<br />
scans with an integration time <strong>of</strong> 16 s.<br />
Filaments having CIRMs or samples were processed<br />
using <strong>the</strong> same operational parameters. The measurement<br />
sequence started analyzing one CIRM, followed by 3<br />
samples maximum. The mass discrimination effect was<br />
corrected using <strong>the</strong> external calibration. In this approach, <strong>the</strong><br />
mean mass discrimination correction factor obtained by <strong>the</strong><br />
measurements <strong>of</strong> <strong>the</strong> <strong>isotope</strong> ratios in <strong>the</strong> CIRMs is used to<br />
correct <strong>the</strong> observed <strong>isotope</strong> ratio for all samples [11].<br />
The metrological traceability to <strong>the</strong> SI was established<br />
through <strong>the</strong> use <strong>of</strong> <strong>the</strong> CRM NBL U005, U010 <strong>and</strong> U030.<br />
Figure 4. THQ Finnigan MAT mass spectrometer
4. RESULTS AND DISCUSSIONS<br />
The NBL sent four different samples to <strong>the</strong> laboratories<br />
in year 2008: two samples for <strong>the</strong> measurement <strong>of</strong> <strong>the</strong><br />
<strong>uranium</strong> <strong>concentration</strong> <strong>and</strong> two for <strong>isotope</strong> composition.<br />
In <strong>the</strong> SMEP, laboratories can select <strong>the</strong> analytical<br />
method <strong>and</strong> procedures <strong>of</strong> <strong>the</strong>ir choice. They must carry on<br />
<strong>the</strong> measurements <strong>and</strong> report <strong>the</strong> results according to certain<br />
specified rules <strong>and</strong> before a fixed deadline.<br />
The pellets devised for <strong>uranium</strong> <strong>concentration</strong> had an<br />
amount <strong>of</strong> <strong>uranium</strong> in <strong>the</strong> range <strong>of</strong> 5mg to about 10g.<br />
The measurement results <strong>of</strong> <strong>the</strong> <strong>uranium</strong> <strong>concentration</strong><br />
are presented in table 1.<br />
Table 1. Measured values <strong>of</strong> <strong>uranium</strong> <strong>concentration</strong><br />
Analysis Sample number Measured value (%U)<br />
1 EU 013 88.0174<br />
2 EU 013 88.1168<br />
3 EU 013 88.0930<br />
4 EU 013 87.9957<br />
5 EU 013 88.0484<br />
6 EU 013 88.2233<br />
7 EU 013 88.2732<br />
8 EU 013 88.0819<br />
9 EU 013 88.1342<br />
10 EU 013 88.1503<br />
11 EU 014 88.0449<br />
12 EU 014 88.0079<br />
13 EU 014 88.0401<br />
14 EU 014 88.0174<br />
15 EU 014 88.0820<br />
16 EU 014 88.1260<br />
17 EU 014 88.1907<br />
18 EU 014 88.1479<br />
19 EU 014 88.0940<br />
20 EU 014 88.1355<br />
The evaluation <strong>of</strong> <strong>the</strong> measurement results presented<br />
above is summarized in <strong>the</strong> table 2.<br />
Table 2. Evaluation <strong>of</strong> results <strong>of</strong> <strong>uranium</strong> <strong>concentration</strong> <strong>and</strong><br />
comparison to <strong>the</strong> requirements <strong>of</strong> <strong>the</strong> ITV 2000 document<br />
Measurements 20<br />
Outlier None<br />
Certified value 88.1290<br />
U <strong>concentration</strong> ITV 2000<br />
Bias -0.032 < 0.1<br />
St<strong>and</strong>ard deviation 0.085 < 0.1<br />
95% C.L. <strong>of</strong> <strong>the</strong> mean 0.794<br />
In <strong>the</strong> SMEP framework, bias <strong>and</strong> st<strong>and</strong>ard deviations<br />
are <strong>the</strong> most important values to evaluate <strong>the</strong> measurement<br />
<strong>reliability</strong>. They are both below 0.1, <strong>the</strong> limit required by<br />
<strong>the</strong> ITV 2000 for <strong>the</strong> <strong>uranium</strong> <strong>concentration</strong>.<br />
The pellets devised for <strong>uranium</strong> <strong>isotope</strong> composition had<br />
235 U enrichment levels between 0.7 <strong>and</strong> 5 weight %.<br />
The results <strong>of</strong> <strong>the</strong> <strong>uranium</strong> <strong>isotope</strong> composition, in terms<br />
<strong>of</strong> <strong>the</strong> 235 U weight percent are presented in table 3.<br />
Table 3. Measured values <strong>of</strong> <strong>the</strong> <strong>isotope</strong> composition<br />
Analysis Sample number Measured 235 U wt %<br />
1 EU 013 4.0049<br />
2 EU 013 4.0102<br />
3 EU 013 4.0029<br />
4 EU 013 4.0104<br />
5 EU 014 4.0058<br />
6 EU 014 4.0116<br />
7 EU 014 4.0108<br />
8 EU 014 4.0057<br />
The evaluation <strong>of</strong> <strong>the</strong> measurement results provided by<br />
mass spectrometry is summarized in table 4.<br />
Table 4. Evaluation <strong>of</strong> <strong>the</strong> <strong>isotope</strong> composition <strong>and</strong> comparison to<br />
<strong>the</strong> requirements <strong>of</strong> <strong>the</strong> ITV 2000 document<br />
Measurements 8<br />
Outlier None<br />
Certified value 4.0078<br />
U <strong>isotope</strong> composition ITV 2000<br />
Bias -0.011 < 0.1<br />
St<strong>and</strong>ard deviation 0.083 < 0.1<br />
95% C.L. <strong>of</strong> <strong>the</strong> mean 0.069<br />
The bias <strong>and</strong> st<strong>and</strong>ard deviations are also below 0.1, <strong>the</strong><br />
limit required by <strong>the</strong> ITV 2000 for <strong>uranium</strong> <strong>isotope</strong> ratio<br />
measurements in low-enriched samples.<br />
The results presented in tables 2 <strong>and</strong> 4 indicate <strong>the</strong><br />
potentiometric titration <strong>and</strong> <strong>the</strong> <strong>isotope</strong> composition<br />
measurements for low-enriched <strong>uranium</strong> are being carried<br />
out with high repeatability <strong>and</strong> accuracy, within <strong>the</strong> limits<br />
required by <strong>the</strong> ITV 2000.<br />
5. CONCLUSIONS<br />
The measurements <strong>of</strong> <strong>uranium</strong> <strong>concentration</strong> <strong>and</strong> <strong>isotope</strong><br />
composition carried out at <strong>the</strong> CTMSP analytical<br />
laboratories can be considered as reliable because <strong>the</strong>y met<br />
<strong>the</strong> requirements <strong>of</strong> <strong>the</strong> ITV 2000 document.<br />
This statement is based on <strong>the</strong> results <strong>of</strong> <strong>the</strong> participation<br />
in <strong>the</strong> 2008 NBL SMEP international interlaboratory<br />
comparison program.<br />
The good results obtained in this year as well as in <strong>the</strong><br />
last years were just achieved with <strong>the</strong> introduction <strong>of</strong> sound<br />
concepts <strong>and</strong> practices <strong>of</strong> metrology in chemical<br />
measurements.<br />
The participation in external, independent, international<br />
quality control programs like NBL SMEP are essential to<br />
demonstrate <strong>the</strong> competence <strong>of</strong> analytical laboratories.
REFERENCES<br />
[1] Ballery, J. L., Cazalet, J. <strong>and</strong> Hagemann, R., The<br />
Nuclear Fuel Cycle, an Overview, Commissariat à<br />
L´Energie Atomique (CEA), Saclay, France, Feb.1995.<br />
[2] Uranium General Overview, Cameco Website,<br />
http://www.cameco.com/<strong>uranium</strong>_101/<br />
[3] Brigolli, B.; Review <strong>of</strong> Separation Processes, in:<br />
Uranium Enrichment, Villani, S. ed., v. 35, p. 13-54,<br />
Springer-Verlag, Berlin, Germany, 1979.<br />
[4] Tabor, C. D., Mass Spectrometry for Uranium Isotopic<br />
Measurements, Review Series, n. 5, International Atomic<br />
Energy Agency, Vienna, Austria, 1960.<br />
[5] E. Kuhn, R. Binner, H. Aigner et all, International<br />
Target Values 2000 for Measuring Uncertainties in<br />
Safeguarding Nuclear Materials, International Atomic<br />
Energy Agency, Report STR-327, Vienna, Austria, 2001<br />
[6] New Brunswick Laboratory (NBL), Department <strong>of</strong><br />
Energy (DOE), 9800 South Cass Avenue, Argonne, IL,<br />
USA, http://www.nbl.doe.gov<br />
[7] Evaluation <strong>of</strong> Measurement Data - Guide to <strong>the</strong><br />
Expression <strong>of</strong> Uncertainty in Measurement, Joint Committee<br />
for Guides in Metrology (JCGM 100:2008), Bureau<br />
Internacional des Poids et Measures (BIPM), 2008.<br />
[8] International Vocabulary <strong>of</strong> Metrology Basic <strong>and</strong><br />
General Concepts <strong>and</strong> Associated Terms (VIM), 3 rd ed.,<br />
International St<strong>and</strong>ardization Organization (ISO),<br />
Switzerl<strong>and</strong>, 2007.<br />
[9] W. Davies <strong>and</strong> W. Gray, Talanta, v. 11, p. 1203, 1964.<br />
[10] A.R. Eberle, M.W. Lerner, C.G. Goldbeck, <strong>and</strong> C.J.<br />
Rodden, "Titrimetric Determination <strong>of</strong> Uranium in Product,<br />
Fuel, <strong>and</strong> Scrap Materials After Ferrous Ion Reduction in<br />
Phosphoric Acid. Part I. Manual Titration," NBL-252, July<br />
1970.<br />
[11] O. Pereira de Oliveira, W. De Bolle, S. Richter, A.<br />
Alonso, H. Kühn, J.E.S. Sarkis <strong>and</strong> R. Wellum, Evaluation<br />
<strong>of</strong> <strong>the</strong> n( 235 U)/n( 238 U) <strong>isotope</strong> ratio measurements in a set <strong>of</strong><br />
<strong>uranium</strong> samples by <strong>the</strong>rmal ionization mass spectrometry,<br />
Int. J. Mass Spectrom. 246 (2005) 35–42.