method for correcting thermoluminescent signal fading - Ipen
method for correcting thermoluminescent signal fading - Ipen
method for correcting thermoluminescent signal fading - Ipen

You also want an ePaper? Increase the reach of your titles
YUMPU automatically turns print PDFs into web optimized ePapers that Google loves.
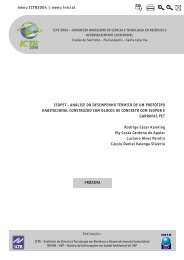
2007 International Nuclear Atlantic Conference - INAC 2007<br />
Santos, SP, Brazil, September 30 to October 5, 2007<br />
ASSOCIAÇÃO BRASILEIRA DE ENERGIA NUCLEAR - ABEN<br />
ISBN: 978-85-99141-02-1<br />
A METHOD FOR CORRECTING THERMOLUMINESCENT SIGNAL FADING OF<br />
ENCAPSULATED LiF:Mg,Ti DETECTORS IN PTFE-Teflon®<br />
Peterson L. Squair 1,2 , Paulo Henrique G. Rosado 1 , Paulo Márcio C. Oliveira 1,2 ,<br />
Maria do S. Nogueira 1 , Teógenes A. da Silva 1,2<br />
1 Centro de Desenvolvimento da Tecnologia Nuclear (CDTN / CNEN - MG)<br />
R. Prof. Mário Werneck, snº, Cidade Universitária<br />
Pampulha, 30123-970, Caixa Postal 941, Belo Horizonte, MG<br />
pls@cdtn.br; phgr2005@yahoo.com.br; pmco@cdtn.br; mnogue@cdtn.br; silvata@cdtn.br.<br />
2 Programa de Pós Graduação em Ciências e Técnicas Nucleares – PCTN<br />
Universidade Federal de Minas Gerais – UFMG<br />
Av. Antônio Carlos, 6627 – Campus UFMG<br />
31270-090 Belo Horizonte/MG<br />
ABSTRACT<br />
Fading is the process when latent in<strong>for</strong>mation of a detector is unintentionally lost mainly due to thermal<br />
influence. Thermoluminescent (TL) detectors have different sensitivities as far as the <strong>fading</strong> effect.<br />
Post-irradiation annealing of 10 minutes at 100ºC is the procedure adopted <strong>for</strong> the bare LiF:Mg,Ti TL detector<br />
(TLD-100) aiming to eliminate low energy peaks and consequently to reduce the <strong>fading</strong> influence in the final<br />
reading. However, encapsulated TL detectors are often used during in-field measurements. PTFE-Teflon ®<br />
polymer is an example of encapsulation material that has a temperature resistance and it allows the<br />
luminescence <strong>signal</strong> to pass through. Since encapsulated TL detectors cannot be submitted to annealing<br />
treatment in an oven, another <strong>fading</strong> reduction <strong>method</strong> is needed. The TL evaluation <strong>method</strong> suggested in this<br />
work is based on a specific glow-curve region. Two areas of the TL glow-curve were selected with the<br />
WimRems software; they correspond to the high and low <strong>fading</strong> emission peaks, channels 070 to 110 and 110 to<br />
190, respectively. The first peak area showed 50% of <strong>fading</strong> in about 22 hours; the other peak area showed only<br />
5% in 60 days. For calibration purposes of the TL dosimetric system the second area is used without significant<br />
reading loss.<br />
1. INTRODUCTION<br />
The thermoluminescence is the emission of light by an insulator or semiconductor that is<br />
thermically stimulated after a prior absorption of the radiation energy given to this material.<br />
When a <strong>thermoluminescent</strong> crystal is exposed to ionizing radiation, this radiation provides<br />
energy to its electrons in their ground state, valence band, so that they can easily go to the<br />
conduction band, leaving a hole in the valence band. The electron and the hole move freely<br />
through the crystal until there are new bounds or until they are captured in meta state levels<br />
of energy, which are usually named traps and placed in the band gap [1].<br />
Fading is the process in which there is unintentional loss of the latent in<strong>for</strong>mation, that is, its<br />
response. Many are the causes of the process of <strong>fading</strong>, but the thermal is the main one. In the<br />
thermal <strong>fading</strong>, the traps that present lower entrapment energy will fade faster than the more<br />
energetic ones, due to their higher probability of transition. This can generate large errors in<br />
the dose assessment [1].<br />
Nowadays, hangers <strong>for</strong> the <strong>thermoluminescent</strong> detectors have been used. These hangers must<br />
have some specific physical characteristics, such as little light attenuation. The hanger with a
PTFE-Teflon ® polymer, which contains <strong>thermoluminescent</strong> detectors encapsulated in its<br />
interior, was efficacious to the use. However, after the identification of the detectors that was<br />
carried out through codes, the use of pre-reading thermal treatments to reduce the <strong>fading</strong><br />
effect got prohibitive [2].<br />
The development and implementation of a dosimetric system includes the realization of<br />
characterization tests of the dosimeter that will be used. These tests assess the consistency of<br />
the obtained outcomes by determining the characteristics of reference adopted. These patterns<br />
of development are described by some standards and recommendations such as the ones from<br />
CASMIE, abbreviation <strong>for</strong> the Brazilian Assessment Committee of Individual Monitoring<br />
System [3], ISO 12794-1 [4] and IEC 1066 [5] that deals with extremity dosimeters.<br />
This paper proposes a <strong>method</strong> <strong>for</strong> charge acquisition regarding a single region of the<br />
<strong>thermoluminescent</strong> glow curve emission to the LiF:Mg,Ti (TLD-100) detector so as to reduce<br />
the <strong>fading</strong> effect in the dosimetry.<br />
INAC 2007, Santos, SP, Brazil.<br />
2. MATERIALS<br />
The equipment used <strong>for</strong> realizing the tests were: a 4500 model Thermo Electron<br />
<strong>thermoluminescent</strong> reader; a 2210 model Thermo Electron 90 Sr/ 90 Y beta irradiator source;<br />
dosimetric cards with two LiF:Mg,Ti detectors from Thermo Electron; a MTH 1380 model<br />
Minipa thermohygrometer.<br />
3. METHODOLOGY AND RESULTS<br />
In order to reduce the <strong>fading</strong> effect without the need of a thermal reading, it was adopted a<br />
<strong>method</strong> of charge acquisition which was related to a single region of the <strong>thermoluminescent</strong><br />
glow curve emission. Two regions of the TL glow curve were selected through the WimRems<br />
software; they were related to the emission peak that presented high and low degree of <strong>fading</strong><br />
including two regions of interest (ROI); the channels 070 to 110 (ROI-1) and the 110 to 190<br />
(ROI-2), respectively, from a total of 200 channels in which the other ones were discarded.<br />
Region 1 (ROI-1) was identified as the “<strong>fading</strong>” region and region 2 (ROI-2) as the “dose”<br />
region, due to its agreement with the <strong>for</strong>mat of the emission curve found after a period of two<br />
months, as shown in figure 1. Region 2 represents the emission peaks 4 and 5 of the TLD<br />
100, being used <strong>for</strong> the dosimetry.<br />
So as to analyze the <strong>fading</strong> process it were used 4 TL cards, each one with two detectors,<br />
resulting in a total of 8 measurements <strong>for</strong> each assessment. The detectors were given an<br />
absorbed dose of 5 mGy in the 90 Sr/ 90 Y beta irradiator source. After the irradiation, a reading<br />
of the detectors in the selected time <strong>for</strong> the analyzes of the <strong>fading</strong> effects was done, as shown<br />
on Table 1, since the packaging temperature of the detectors was 20ºC with a maximum<br />
variation of 2ºC and relative humidity between 40 and 65%. By using the data from Table 1 it<br />
was possible to determine graphically the relative <strong>fading</strong> in the regions 1 and 2 (Figure 2).
INAC 2007, Santos, SP, Brazil.<br />
Figure 1. Channels determination to dose evaluate<br />
Table 1. Response variation in relation to time.
INAC 2007, Santos, SP, Brazil.<br />
Figure 2. Fading results<br />
4. CONCLUSIONS<br />
Through this analyses it was verified that <strong>for</strong> the LiF:Mg,Ti (TLD-100) detector encapsulated<br />
in PTFE-Teflon, the <strong>fading</strong> overestimates 7.3% <strong>for</strong> a period of three days and 4.4% <strong>for</strong> a<br />
period of 2 months.<br />
This reading procedure, which works specifically on some regions of the <strong>thermoluminescent</strong><br />
emission curve, can be used to reduce the effects that the <strong>fading</strong> causes in the final reading of<br />
the dosimetric systems.<br />
For further research works it is suggested a detailed analyses of the <strong>signal</strong> increase <strong>for</strong><br />
readings that lasts up to seven days and also the possibility of determining the irradiation<br />
period.
INAC 2007, Santos, SP, Brazil.<br />
REFERENCES<br />
1. Maurício, C. L. P. Noções de Dosimetria Termoluminescente:Aplicação em Dosimetria<br />
Individual, Apostila, Rio de Janeiro, IRD/CNEN, (1993).<br />
2. P. L. Squair, M. S. Nogueira, P. M. C. Oliveira, “ Desenvolvimento e Fabricação de<br />
Suporte para Detectores de Extremidades” International Nuclear Atlantic Conference -<br />
INAC 2005, Santos, São Paulo, ISBN: 85-99141-01-5 (2005).<br />
3. CASMIE Instituto de Radioproteção e Dosimetria / Comissão Nacional de Energia<br />
Nuclear. Regulamentos Técnicos Referentes ao Processo de Certificação de Sistemas de<br />
Monitoração Individual Externa, IRD/CNEN, (1995).<br />
4. ISO International Organization <strong>for</strong> Standardization. Individual Thermoluminescence<br />
Dosemeters <strong>for</strong> Extremities and Eyes; ISO 12794-1, Geneva, Switzerland, (2000).<br />
5. IEC International Eletrotechnical Commission. Thermoluminescence Dosimetry Systems<br />
<strong>for</strong> Personal and Evironmental Monitoring, IEC 1066, Geneva, Switzerland, (1991).