Governance and finance of long-term care - University of Birmingham
Governance and finance of long-term care - University of Birmingham
Governance and finance of long-term care - University of Birmingham

You also want an ePaper? Increase the reach of your titles
YUMPU automatically turns print PDFs into web optimized ePapers that Google loves.
Allen et al., 2011 <strong>Governance</strong> <strong>and</strong> Financing <strong>of</strong> LTC | European Overview<br />
• Although scientific studies <strong>and</strong> pilot projects had originally been carried out to define LTC needs, for<br />
instance in France, ample discretion remains when it comes to individual needs assessment.<br />
As a result <strong>of</strong> these differences, the share <strong>of</strong> older people with potential LTC needs in the population,<br />
either assessed <strong>and</strong> approved according to the national definitions or estimated according to SHARE <strong>and</strong><br />
EU-‐SILC (European Commission/DG ECFIN, 2009: 133-‐138), varies significantly between Member States,<br />
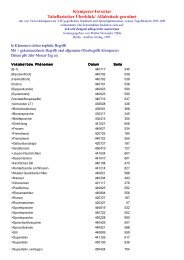
ranging from 1.6 in Slovakia <strong>and</strong> 3.0 in Denmark <strong>and</strong> Greece to 5.2% in Finl<strong>and</strong> (Table 3.1). These<br />
differences can only partly be explained by higher proportions <strong>of</strong> older people in the population, for the<br />
share <strong>of</strong> people with potential LTC needs also varies greatly, from 13.1% in Slovak Republic to around a<br />
third <strong>of</strong> the old-‐age population in Finl<strong>and</strong> <strong>and</strong> the UK. Differences in disability rates among European<br />
countries may reflect national variations in reporting, in needs <strong>and</strong> eligibility testing assessment (for<br />
more information see Ros et al., 2010), response rates, variations in lifestyles <strong>and</strong> socio-‐economic<br />
st<strong>and</strong>ards among countries, or differences in health behaviour risk factors. These differences are widely<br />
recognised <strong>and</strong> literature recommends caution in the cross-‐country analysis <strong>of</strong> these varying disability<br />
rates (see Avendano & Mackenbach, 2008; Hairi et al., 2008).<br />
Table 3.1 Share <strong>of</strong> older people with potential LTC needs in total population (around 2008)<br />
Country Population 65+ with potential LTC needs based on disability rates or according to<br />
national eligibility criteria<br />
n. % <strong>of</strong> total population % <strong>of</strong> 65+ population<br />
CH n/a n/a n/a<br />
DK 164,000 3.0% 19.4%<br />
DE 3,201,000 3.9% 19.5%<br />
EL 338,000 3.0% 16.2%<br />
ES 1.728,000 3.9% 23.1%<br />
FR 2,263,000 3.6% 22.3%<br />
IT 2,515,000 4.3% 21.2%<br />
NL 387,000 2.4% 24.8%<br />
AT (1) 360,000 4.4% 25.4%<br />
SI 76,000 3.8% 23.8%<br />
SK (1) (2) 87,000 1.6% 13.1%<br />
FI 274,000 5.2% 31.4%<br />
SE (1) 497,000 3.4% 19.6%<br />
UK 3,094,000 5.0% 33.1%<br />
Source: European Commission/DG ECFIN, 2009: 138; Eurostat; Confédération Suisse, 2011.– Notes: (1) own<br />
calculations based on national data; (2) people 60+, <strong>care</strong>d for more than 8 hours per day; (3) calculations based on<br />
ANCIEN data <strong>and</strong> CBS.<br />
10


![Benyamin Asadipour-Farsani [EngD Conference abstract]](https://img.yumpu.com/51622940/1/184x260/benyamin-asadipour-farsani-engd-conference-abstract.jpg?quality=85)