A Structural Model of Human Capital and Leverage - Duke ...
A Structural Model of Human Capital and Leverage - Duke ...
A Structural Model of Human Capital and Leverage - Duke ...
You also want an ePaper? Increase the reach of your titles
YUMPU automatically turns print PDFs into web optimized ePapers that Google loves.
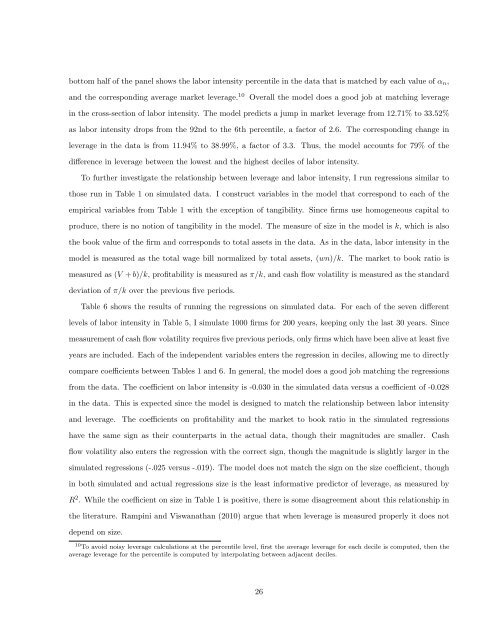
ottom half <strong>of</strong> the panel shows the labor intensity percentile in the data that is matched by each value <strong>of</strong> αn,<br />
<strong>and</strong> the corresponding average market leverage. 10 Overall the model does a good job at matching leverage<br />
in the cross-section <strong>of</strong> labor intensity. The model predicts a jump in market leverage from 12.71% to 33.52%<br />
as labor intensity drops from the 92nd to the 6th percentile, a factor <strong>of</strong> 2.6. The corresponding change in<br />
leverage in the data is from 11.94% to 38.99%, a factor <strong>of</strong> 3.3. Thus, the model accounts for 79% <strong>of</strong> the<br />
difference in leverage between the lowest <strong>and</strong> the highest deciles <strong>of</strong> labor intensity.<br />
To further investigate the relationship between leverage <strong>and</strong> labor intensity, I run regressions similar to<br />
those run in Table 1 on simulated data. I construct variables in the model that correspond to each <strong>of</strong> the<br />
empirical variables from Table 1 with the exception <strong>of</strong> tangibility. Since firms use homogeneous capital to<br />
produce, there is no notion <strong>of</strong> tangibility in the model. The measure <strong>of</strong> size in the model is k, which is also<br />
the book value <strong>of</strong> the firm <strong>and</strong> corresponds to total assets in the data. As in the data, labor intensity in the<br />
model is measured as the total wage bill normalized by total assets, (wn)/k. The market to book ratio is<br />
measured as (V + b)/k, pr<strong>of</strong>itability is measured as π/k, <strong>and</strong> cash flow volatility is measured as the st<strong>and</strong>ard<br />
deviation <strong>of</strong> π/k over the previous five periods.<br />
Table 6 shows the results <strong>of</strong> running the regressions on simulated data. For each <strong>of</strong> the seven different<br />
levels <strong>of</strong> labor intensity in Table 5, I simulate 1000 firms for 200 years, keeping only the last 30 years. Since<br />
measurement <strong>of</strong> cash flow volatility requires five previous periods, only firms which have been alive at least five<br />
years are included. Each <strong>of</strong> the independent variables enters the regression in deciles, allowing me to directly<br />
compare coefficients between Tables 1 <strong>and</strong> 6. In general, the model does a good job matching the regressions<br />
from the data. The coefficient on labor intensity is -0.030 in the simulated data versus a coefficient <strong>of</strong> -0.028<br />
in the data. This is expected since the model is designed to match the relationship between labor intensity<br />
<strong>and</strong> leverage. The coefficients on pr<strong>of</strong>itability <strong>and</strong> the market to book ratio in the simulated regressions<br />
have the same sign as their counterparts in the actual data, though their magnitudes are smaller. Cash<br />
flow volatility also enters the regression with the correct sign, though the magnitude is slightly larger in the<br />
simulated regressions (-.025 versus -.019). The model does not match the sign on the size coefficient, though<br />
in both simulated <strong>and</strong> actual regressions size is the least informative predictor <strong>of</strong> leverage, as measured by<br />
R 2 . While the coefficient on size in Table 1 is positive, there is some disagreement about this relationship in<br />
the literature. Rampini <strong>and</strong> Viswanathan (2010) argue that when leverage is measured properly it does not<br />
depend on size.<br />
10 To avoid noisy leverage calculations at the percentile level, first the average leverage for each decile is computed, then the<br />
average leverage for the percentile is computed by interpolating between adjacent deciles.<br />
26


