A Structural Model of Human Capital and Leverage - Duke ...
A Structural Model of Human Capital and Leverage - Duke ...
A Structural Model of Human Capital and Leverage - Duke ...

Create successful ePaper yourself
Turn your PDF publications into a flip-book with our unique Google optimized e-Paper software.
Firm Value<br />
3<br />
2.5<br />
2<br />
1.5<br />
1<br />
0.5<br />
Panel A<br />
0<br />
−2 −1 0 1 2 3<br />
Net Worth<br />
Firm Value<br />
1.8<br />
1.6<br />
1.4<br />
1.2<br />
1<br />
0.8<br />
0.6<br />
0.4<br />
Panel B<br />
0.2<br />
0 0.5 1 1.5 2 2.5<br />
Employees<br />
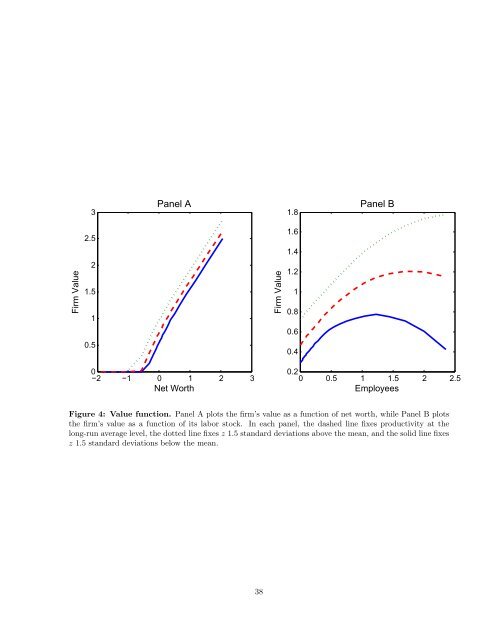
Figure 4: Value function. Panel A plots the firm’s value as a function <strong>of</strong> net worth, while Panel B plots<br />
the firm’s value as a function <strong>of</strong> its labor stock. In each panel, the dashed line fixes productivity at the<br />
long-run average level, the dotted line fixes z 1.5 st<strong>and</strong>ard deviations above the mean, <strong>and</strong> the solid line fixes<br />
z 1.5 st<strong>and</strong>ard deviations below the mean.<br />
38