economic survey of himachal pradesh 2011-12 - Government of ...
economic survey of himachal pradesh 2011-12 - Government of ...
economic survey of himachal pradesh 2011-12 - Government of ...

Create successful ePaper yourself
Turn your PDF publications into a flip-book with our unique Google optimized e-Paper software.
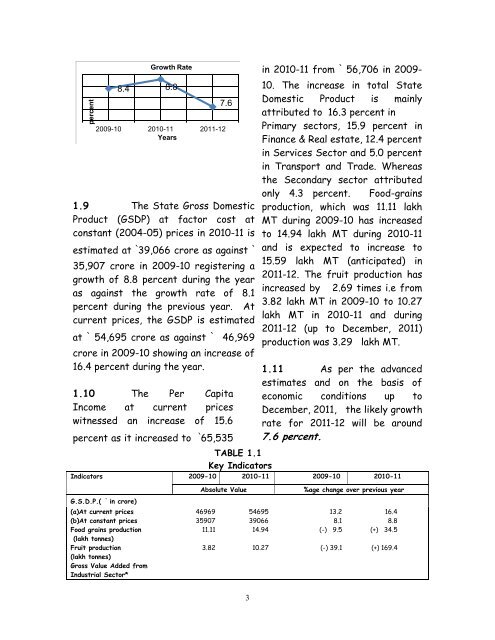
percent<br />
8.4<br />
Growth Rate<br />
8.8<br />
7.6<br />
2009-10 2010-11<br />
Years<br />
<strong>2011</strong>-<strong>12</strong><br />
1.9 The State Gross Domestic<br />
Product (GSDP) at factor cost at<br />
constant (2004-05) prices in 2010-11 is<br />
estimated at `39,066 crore as against `<br />
35,907 crore in 2009-10 registering a<br />
growth <strong>of</strong> 8.8 percent during the year<br />
as against the growth rate <strong>of</strong> 8.1<br />
percent during the previous year. At<br />
current prices, the GSDP is estimated<br />
at ` 54,695 crore as against ` 46,969<br />
crore in 2009-10 showing an increase <strong>of</strong><br />
16.4 percent during the year.<br />
1.10 The Per Capita<br />
Income at current prices<br />
witnessed an increase <strong>of</strong> 15.6<br />
percent as it increased to `65,535<br />
TABLE 1.1<br />
Key Indicators<br />
3<br />
in 2010-11 from ` 56,706 in 2009-<br />
10. The increase in total State<br />
Domestic Product is mainly<br />
attributed to 16.3 percent in<br />
Primary sectors, 15.9 percent in<br />
Finance & Real estate, <strong>12</strong>.4 percent<br />
in Services Sector and 5.0 percent<br />
in Transport and Trade. Whereas<br />
the Secondary sector attributed<br />
only 4.3 percent. Food-grains<br />
production, which was 11.11 lakh<br />
MT during 2009-10 has increased<br />
to 14.94 lakh MT during 2010-11<br />
and is expected to increase to<br />
15.59 lakh MT (anticipated) in<br />
<strong>2011</strong>-<strong>12</strong>. The fruit production has<br />
increased by 2.69 times i.e from<br />
3.82 lakh MT in 2009-10 to 10.27<br />
lakh MT in 2010-11 and during<br />
<strong>2011</strong>-<strong>12</strong> (up to December, <strong>2011</strong>)<br />
production was 3.29 lakh MT.<br />
1.11 As per the advanced<br />
estimates and on the basis <strong>of</strong><br />
<strong>economic</strong> conditions up to<br />
December, <strong>2011</strong>, the likely growth<br />
rate for <strong>2011</strong>-<strong>12</strong> will be around<br />
7.6 percent.<br />
Indicators 2009-10 2010-11 2009-10 2010-11<br />
G.S.D.P.( ` in crore)<br />
(a)At current prices<br />
(b)At constant prices<br />
Food grains production<br />
(lakh tonnes)<br />
Fruit production<br />
(lakh tonnes)<br />
Gross Value Added from<br />
Industrial Sector*<br />
Absolute Value %age change over previous year<br />
46969<br />
35907<br />
11.11<br />
54695<br />
13.2<br />
16.4<br />
39066<br />
8.1<br />
8.8<br />
14.94 (-) 9.5 (+) 34.5<br />
3.82 10.27 (-) 39.1 (+) 169.4