Inland Empire Railroad Main Line Study - UC Berkeley Industrial ...
Inland Empire Railroad Main Line Study - UC Berkeley Industrial ...
Inland Empire Railroad Main Line Study - UC Berkeley Industrial ...

You also want an ePaper? Increase the reach of your titles
YUMPU automatically turns print PDFs into web optimized ePapers that Google loves.
<strong>Inland</strong> <strong>Empire</strong> <strong>Railroad</strong> <strong>Main</strong> <strong>Line</strong> <strong>Study</strong><br />
Final Report<br />
Contract 04-010<br />
Prepared for<br />
Southern California Association of Governments<br />
Robert C. Leachman<br />
Leachman and Associates LLC<br />
245 Estates Drive<br />
Piedmont, CA 94611<br />
Gill V. Hicks<br />
Gill V. Hicks & Associates, Inc.<br />
1121 Embury Street<br />
Pacific Palisades, CA 90272<br />
George R. Fetty<br />
George R. Fetty & Associates, Inc.<br />
277 Pomona Avenue<br />
Long Beach, CA 90803<br />
Mr. Michael Rieger<br />
Weston Solutions, Inc.<br />
14724 Ventura Blvd., Suite 1000<br />
Sherman Oaks, CA 94103<br />
June 30, 2005<br />
Funding: The preparation of this report was financed in part through grants from<br />
the United States Department of Transportation (DOT) – Federal Highway<br />
Administration and the Federal Transit Administration – under provisions of the<br />
Transportation Equity Act of the 21 st Century<br />
1
TABLE OF CONTENTS<br />
2<br />
Page<br />
Executive Summary 7<br />
1. Introduction 22<br />
2. The <strong>Main</strong> <strong>Line</strong> Rail Network 23<br />
3. Freight Traffic Levels 31<br />
4. Passenger Traffic Levels 39<br />
5. Routing Alternatives 50<br />
6. Train Dispatching Simulations 52<br />
7. Simulation Results 57<br />
8. Summary of Track Capacity Improvements 64<br />
9. Capital Costs for <strong>Main</strong> <strong>Line</strong> Rail Infrastructure 70<br />
10. Emissions Analysis 77<br />
11. Ranking of Alternatives 96<br />
12. Stakeholder Comments 101<br />
Appendix A. Year 2000 Trackage Network 104<br />
Appendix B. Train Counts by <strong>Line</strong> Segment 144<br />
NOTE: The contents of this report reflect the views of the author who is responsible<br />
for the facts and accuracy of the data presented herein. The contents do not<br />
necessarily reflect the official views or policies of SCAG or U.S. DOT. This report<br />
does not constitute a standard, specification or regulation.
LIST OF FIGURES<br />
3<br />
Page<br />
1. <strong>Main</strong> <strong>Line</strong> Rail Network, West of Colton Crossing 8<br />
2. <strong>Main</strong> <strong>Line</strong> Rail Network, North and East of Colton Crossing 8<br />
3. Status Quo Routing 10<br />
4. Routing Alternative 1a 11<br />
5. Routing Alternative 1b 12<br />
6. Routing Alternative 2 12<br />
7. UP Train Counts on BNSF Cajon <strong>Line</strong> – Spring, 2004 35<br />
8. BNSF Train Counts on BNSF Cajon <strong>Line</strong> – Spring, 2004 36<br />
9. Total Train Counts on BNSF Cajon <strong>Line</strong> – Spring, 2004 36<br />
10. Rail <strong>Line</strong> Capacity: The Trade-Off Between Train Volume and Delay 49<br />
11. Overview of Rail Dispatch Model Structure 53<br />
LIST OF TABLES<br />
Page<br />
1. Summary of Required Track Capacity on BNSF <strong>Line</strong>, South and West<br />
of Colton Crossing 14<br />
2. Summary of Required Track Capacity on BNSF <strong>Line</strong>, North of Colton<br />
Crossing 15<br />
3. Summary of Required Track Capacity on UP <strong>Line</strong>s East of Pomona 16<br />
4. Summary of Required Track Capacity on UP <strong>Line</strong>s West of Pomona for<br />
Status Quo Alternative 18<br />
5. Summary of Required Track Capacity on UP <strong>Line</strong>s West of Pomona for<br />
Alternatives to Status Quo Routing 18
LIST OF TABLES (cont.)<br />
Page<br />
6. Locomotive and Vehicle Delay Emissions from the <strong>Main</strong> <strong>Line</strong> Rail Network,<br />
Year 2000 Base Case, Year 2010 and Year 2025, Under Status Quo Routing 20<br />
7. Future Basin-wide Emission Benefits from Routing Alternatives 20<br />
8. Ranking of Routing Alternatives 21<br />
9. Comparison of Peak-Day Forecast and Actual Through Freight Train<br />
Movements, BNSF Cajon <strong>Line</strong> 37<br />
10. Peak-Day Passenger Train Counts by <strong>Railroad</strong> <strong>Line</strong> 39<br />
11. Comparison of Peak-Day Passenger Train Counts 46<br />
12. Total Through Train Movements per Peak Day by <strong>Line</strong> Segment 47<br />
13. Forecasted Peak-Day Through Freight Train Counts in Downtown<br />
Riverside and Downtown San Bernardino 50<br />
14. Actual vs. Simulated Transit Times, CP Sepulveda – Colton Crossing 56<br />
15. Simulation Results, Colton Crossing – Indio 58<br />
16. Simulation Results, Colton Crossing – Barstow and West Colton –<br />
Hiland, 2000 and 2010 59<br />
17. Simulation Results, Colton Crossing – Barstow and West Colton –<br />
Hiland, 2025 60<br />
18. Additional Simulation Results, Colton Crossing – Barstow and West<br />
Colton – Hiland, 2025 62<br />
19. Summary of Required Track Capacity on BNSF <strong>Line</strong> South and West of<br />
Colton Crossing 64<br />
20. Summary of Required Track Capacity on UP <strong>Line</strong>s West of Colton<br />
Crossing – Status Quo Alternative 65<br />
21. Summary of Required Track Capacity on UP <strong>Line</strong>s Colton and<br />
Riverside to Pomona for Alternatives to Status Quo Routing 66<br />
22. Summary of Required Track Capacity on UP <strong>Line</strong>s West of Pomona for<br />
Alternatives to Status Quo Routing 67<br />
4
23. Summary of Required Track Capacity on UP <strong>Line</strong>s North and East of<br />
Colton Crossing 68<br />
24. Summary of Required Track Capacity on BNSF <strong>Line</strong> North of Colton<br />
Crossing 69<br />
25. Unit Cost Assumptions 70<br />
26. Summary of Estimated Rail Infrastructure by <strong>Line</strong> Segment 74<br />
27. Estimated Rail Infrastructure Costs by Routing Alternative 75<br />
28. Streets Assumed to Be Grade-Separated by 2010 79<br />
29. Streets Assumed to Be Grade-Separated by 2025 80<br />
30. Grade Crossing Impacts: Total Gate-Down Time and Total Vehicle-Hours<br />
of Delay 82<br />
31. Year 2000 <strong>Main</strong> <strong>Line</strong> Rail Network Emissions from BNSF, UP and<br />
Passenger Trains 85<br />
32. Year 2000 <strong>Main</strong> <strong>Line</strong> Rail Network Emissions from Traffic Delay 85<br />
33. Overall Emissions for Year 2000 85<br />
34. Basin-wide Emission Reduction Benefits from Rail Efficiency in 2010,<br />
Alternative 1a 87<br />
35. Basin-wide Combined Emission Reduction Benefits from Rail Efficiency<br />
and Vehicle Delay Elimination in 2010, Alternative 1a 88<br />
36. Basin-wide Emission Reduction Benefits from Rail Efficiency in 2010,<br />
Alternative 1b 88<br />
37. Basin-wide Combined Emission Reduction Benefits from Rail Efficiency<br />
and Vehicle Delay Elimination in 2010, Alternative 1b 89<br />
38. Basin-wide Emission Reduction Benefits from Rail Efficiency in 2010,<br />
Alternative 2 89<br />
39. Basin-wide Combined Emission Reduction Benefits from Rail Efficiency<br />
and Vehicle Delay Elimination in 2010, Alternative 2 90<br />
40. Basin-wide Emission Reduction Benefits from Rail Efficiency in 2025,<br />
Alternative 1a 91<br />
5
41. Basin-wide Combined Emission Reduction Benefits from Rail Efficiency<br />
and Vehicle Delay Elimination in 2025, Alternative 1a 92<br />
42. Basin-wide Emission Reduction Benefits from Rail Efficiency in 2025,<br />
Alternative 1b 92<br />
43. Basin-wide Combined Emission Reduction Benefits from Rail Efficiency<br />
and Vehicle Delay Elimination in 2025, Alternative 1b 93<br />
44. Basin-wide Emission Reduction Benefits from Rail Efficiency in 2025,<br />
Alternative 2 94<br />
45. Basin-wide Combined Emission Reduction Benefits from Rail Efficiency<br />
and Vehicle Delay Elimination in 2025, Alternative 2 94<br />
46. Future Basin-wide Emission Benefits from the <strong>Main</strong> <strong>Line</strong> Rail Network 95<br />
47. Estimated Rail Infrastructure Costs by Routing Alternative 96<br />
48. Estimated Total Emissions by Routing Alternative in Year 2025 97<br />
49. Population Exposure to <strong>Main</strong>-<strong>Line</strong> Freight Train Operations 98<br />
50. Population Access to Passenger Train Operations 99<br />
51. Ranking of Routing Alternatives 99<br />
6
Executive Summary<br />
The <strong>Inland</strong> <strong>Empire</strong> <strong>Railroad</strong> <strong>Main</strong> <strong>Line</strong> <strong>Study</strong> examines railroad infrastructure needs and<br />
operations for both freight and passenger trains in Southern California. The firm of<br />
Leachman and Associates LLC was contracted by the Southern California Association of<br />
Governments to perform this study. Assisting Leachman and Associates in this study are<br />
George R. Fetty & Associates, Gill V. Hicks & Associates, Inc., and Weston Solutions,<br />
Inc.<br />
This document serves as the Final Report for this study. The existing railroad main line<br />
infrastructure from downtown Los Angeles east and north to Barstow and Indio is<br />
described. Passenger and freight traffic patterns are documented, and future train volumes<br />
are forecast. Alternatives for routing future main-line train movements are formulated<br />
and analyzed. Results are presented from simulating Year 2010 and Year 2025 train<br />
operations in scenarios of increasing track capacity. These results identify track capacity<br />
improvements for each alternative required to maintain Year 2000 transit times while<br />
accommodating forecasted 2010 and 2025 traffic levels. Capital costs for these<br />
infrastructure improvements are estimated. Emissions from locomotives powering<br />
through train movements and from vehicular delays at grade crossings are estimated.<br />
Finally, the alternatives are ranked along the dimensions of capital costs, total emissions,<br />
population exposure to main-line freight train operations, and population access to<br />
passenger train operations.<br />
Frequencies of main-line train operations vary from day to day. Train movement counts<br />
in this study are expressed per peak-day, defined as the 90 th percentile of the statistical<br />
distribution of daily train movements. On lines in the study area, this is about 20% higher<br />
than the average daily train movement count.<br />
Southern California is served by two major freight railroads: Burlington Northern Santa<br />
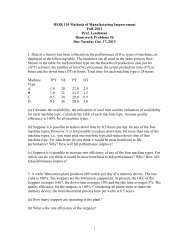
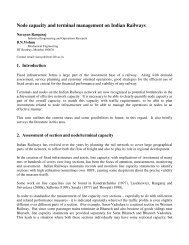
Fe, and Union Pacific. Figures 1 and 2 provide diagrams of the main line rail network in<br />
the study area (not to scale). Not shown in the figures are numerous low-density branch<br />
lines for originating and terminating carload freight.<br />
BNSF operates a single main line extending from downtown Los Angeles to Barstow.<br />
Intermodal terminals are operated by BNSF at Hobart (adjoining the City of Commerce)<br />
and San Bernardino. UP trains utilize trackage rights over the BNSF line from West<br />
Riverside to Barstow. The entire BNSF line has at least two main tracks, reverse-signaled<br />
under centralized traffic control (CTC), with three main tracks over relatively short<br />
stretches in various locales. Expansion of three-main-track territory is underway. Most<br />
recently, a third main track was completed in late 2004 over 6.5 miles of line between<br />
Baseline Road in San Bernardino and Verdemont, and expansion of three-main-track<br />
territory is currently underway to encompass the entire run between Hobart and Fullerton.<br />
In Year 2000, 87 freight trains and two Amtrak passenger trains per peak day traversed<br />
the portion of the BNSF <strong>Line</strong> crossing Cajon Pass. These figures are forecast to rise to<br />
7
Metrolink<br />
Glendale <strong>Line</strong> UP<br />
Metrolink<br />
Yuma Jct.(LATC)<br />
East Bank <strong>Line</strong><br />
El Monte<br />
City of Industry<br />
UP/BNSF<br />
Alameda<br />
Corridor<br />
Figure 1. <strong>Main</strong> <strong>Line</strong> Rail Network, West of Colton Crossing<br />
Keenbrook<br />
Connection<br />
UP Palmdale<br />
<strong>Line</strong><br />
Metrolink<br />
San Bernardino<br />
<strong>Line</strong><br />
West<br />
Colton<br />
Redondo<br />
(Metrolink<br />
Flyover)<br />
2.2% grade<br />
Silverwood<br />
Connection<br />
Colton<br />
Cajon<br />
2.2% grade<br />
Summit<br />
3% grade<br />
San Bernardino<br />
1.8%<br />
grade<br />
Verdemont<br />
UP to<br />
Las Vegas<br />
BNSF to Mojave<br />
BNSF to<br />
UP to Palmdale<br />
Needles<br />
Daggett<br />
Hiland<br />
Barstow<br />
(Valley Jct.)<br />
UP Yuma <strong>Line</strong><br />
Apex<br />
Alhambra<br />
<strong>Line</strong><br />
2.0%<br />
grade<br />
Figure 2. <strong>Main</strong> <strong>Line</strong> Rail Network, North and East of Colton Crossing<br />
8<br />
West<br />
Colton<br />
Pomona<br />
East LA UP San Gabriel<br />
Hobart<br />
<strong>Line</strong><br />
Fullerton<br />
UP Palmdale<br />
<strong>Line</strong><br />
Metrolink lines<br />
Atwood<br />
Victorville<br />
1.6% grade<br />
BNSF <strong>Line</strong><br />
(UP trackage rights)<br />
Palm Springs<br />
(Garnet)<br />
BNSF <strong>Line</strong><br />
(UP trackage rights)<br />
Indio<br />
Colton<br />
Riverside<br />
UP Yuma<br />
<strong>Line</strong><br />
BNSF <strong>Line</strong><br />
UP to<br />
Yuma
123 freight trains and 6 passenger trains in 2010, and 178 freight trains and 8 passenger<br />
trains in 2025. Passenger train movements over the BNSF <strong>Line</strong> are heaviest between<br />
Fullerton and Los Angeles. In Year 2000, this segment had 46 passenger trains and 57<br />
freight trains per peak day. Those figures are forecast to rise to 76 passenger trains and 82<br />
freight trains in 2010 and 106 passenger trains and 121 freight trains in 2025.<br />
UP operates two main lines between downtown Los Angeles and Colton Crossing. In this<br />
report, these lines are designated as the UP San Gabriel <strong>Line</strong> and the UP Alhambra <strong>Line</strong>.<br />
These lines consist of a mixture of single-track and two-main-track territories operated<br />
under CTC. The UP Alhambra <strong>Line</strong> is mostly single-track, while the UP San Gabriel<br />
<strong>Line</strong> is mostly two-main-track. Intermodal terminals are operated by UP at East Los<br />
Angeles (at the west end of the UP San Gabriel <strong>Line</strong>), Los Angeles Transportation Center<br />
(at the west end of the UP Alhambra <strong>Line</strong>) and City of Industry (midway on the UP<br />
Alhambra <strong>Line</strong>). A large carload freight classification yard is located at West Colton (at<br />
the east end of the Alhambra <strong>Line</strong>). North from West Colton, UP operates the singletrack-CTC<br />
Palmdale <strong>Line</strong> to Northern California and Pacific Northwest points. This line<br />
closely parallels the BNSF <strong>Line</strong> as they climb the south slope of Cajon Pass. Compared<br />
to other main lines in the study area, the UP Palmdale <strong>Line</strong> is lightly trafficked.<br />
East from Colton Crossing to Indio, UP operates its transcontinental Sunset Route main<br />
line, designated in this report as the UP Yuma <strong>Line</strong>. The first 48 miles of this line have<br />
two main tracks under CTC, the remaining 24 miles to Indio is a single-track-CTC line.<br />
Eastward extension of the second main track was completed in September, 2004 over the<br />
ten-mile stretch from Fingal to Garnet. Extension of the second main track eastward is<br />
planned.<br />
In Year 2000, UP operated 59 through freight trains per peak day collectively over the<br />
UP San Gabriel and UP Alhambra <strong>Line</strong>s. This figure is forecast to rise to 83 trains in<br />
2010 and 117 trains in 2025. On the Yuma <strong>Line</strong>, UP operated 42 freight trains per peak<br />
day in Year 2000. That figure is forecast to grow to 60 trains in 2010 and 87 trains in<br />
2025.<br />
Passenger train movements over UP tracks in the study area are heaviest on the UP San<br />
Gabriel <strong>Line</strong>. Including both Metrolink and Amtrak, in Year 2000, there were 12 trains<br />
per peak day over this line, forecast to rise to 22 trains in 2010 and 36 trains in 2025. In<br />
contrast, passenger movements over the UP Alhambra and Yuma <strong>Line</strong>s are very light,<br />
only 2 trains per peak day in Year 2000, forecast to rise to 4 trains in 2010 and 8 trains in<br />
2025. There are no regular passenger movements over the UP Palmdale <strong>Line</strong>.<br />
Discrete-event computer simulations of railroad operations (“train dispatch simulation”)<br />
were carried out by the consultant for each routing alternative as well as for the Year<br />
2000 Base Case. Given train volumes and trackage configuration as input, one hundred<br />
peak days of train operations were simulated and statistics on transit times and delays<br />
were compiled. The criterion for planning track capacity in this study is to maintain Year<br />
2000 average transit times under 2010 and 2025 traffic scenarios. From iterative<br />
9
simulation experiments, required trackage configurations were identified for the 2010 and<br />
2025 traffic scenarios meeting this criterion.<br />
The Status Quo alternative represents an allocation of through trains to routes<br />
proportional to the actual average allocation occurring in the Year 2000 Base Case.<br />
Under the Status Quo routing alternative, roughly 60% of UP through train movements<br />
operating between Colton Crossing and downtown Los Angeles points are routed via the<br />
San Gabriel <strong>Line</strong>, the other 40% are routed via the Alhambra <strong>Line</strong> (Figure 3). Under this<br />
alternative, the UP Palmdale <strong>Line</strong> is utilized predominantly by UP trains to and from<br />
Northern California, while almost all UP trains via Barstow utilize the BNSF <strong>Line</strong><br />
between West Riverside and Barstow.<br />
Pasadena<br />
Jct.<br />
East LA<br />
40%<br />
UP Alhambra <strong>Line</strong><br />
60%<br />
Pomona<br />
UP San Gabriel <strong>Line</strong><br />
Figure 3: Status Quo Routing<br />
Three routing alternatives to the Status Quo are formulated and analyzed in this report.<br />
The motivation for consideration of these alternatives stems from the following factors:<br />
• The UP Palmdale <strong>Line</strong> is relatively underutilized, whereas the BNSF <strong>Line</strong><br />
through Riverside, San Bernardino and over Cajon Pass is heavily utilized. By<br />
2025, it will be impossible to achieve Year 2000 transit times unless a significant<br />
fraction of UP Barstow trains are routed via the UP Palmdale <strong>Line</strong>, West Colton<br />
and the UP Alhambra <strong>Line</strong>. Moreover, integrating the UP Palmdale <strong>Line</strong> to be<br />
flexibly dispatched as if it were another BNSF track on the south slope of Cajon<br />
Pass, would significantly reduce track capacity expenditures needed to<br />
accommodate 2010 and 2025 traffic levels.<br />
• Routing trains via the UP San Gabriel <strong>Line</strong> involves use of trackage rights over<br />
the BNSF <strong>Line</strong> between Colton Crossing and West Riverside. This is the most<br />
heavily utilized line segment in the Los Angeles Basin. Expansion of the capacity<br />
of this segment to accommodate 2025 traffic levels is relatively difficult and<br />
expensive under the Status Quo alternative, requiring a fourth main track plus<br />
flying junctions to enter and exit BNSF tracks. Expansion of capacity of the UP<br />
Alhambra <strong>Line</strong> between West Colton and Pomona is more practical and less<br />
costly.<br />
10<br />
West<br />
Colton<br />
40%<br />
60%<br />
Riverside<br />
Colton
• Shifting UP trains operating between Cajon Pass and Pomona off the BNSF <strong>Line</strong><br />
and the UP San Gabriel <strong>Line</strong> and onto the UP Palmdale and UP Alhambra <strong>Line</strong>s<br />
reduces conflicts between Metrolink commuter trains and UP freight operations,<br />
thereby reducing track capacity expenditures needed to accommodate 2010 and<br />
2025 traffic levels.<br />
• Shifting UP trains operating between Cajon Pass and Pomona off the BNSF and<br />
UP San Gabriel <strong>Line</strong>s and onto the UP Palmdale and UP Alhambra <strong>Line</strong>s reduces<br />
total population exposure to through train movements and total vehicular delays at<br />
grade crossings.<br />
All three alternatives to the Status Quo are identical east of Pomona. Compared to the<br />
Status Quo, they reduce the total through train counts in downtown San Bernardino and<br />
downtown Riverside by 22% and 31%, respectively. These three alternatives concentrate<br />
about 88% of UP through train movements via West Colton versus only 12% via the UP<br />
San Gabriel <strong>Line</strong> through Riverside. Under these alternatives, only Metrolink (blue line<br />
in Figures 4 – 6) and UP through freight trains utilizing the Mira Loma auto terminal or<br />
the carload interchange yard at Montclair are normally operated via the UP San Gabriel<br />
<strong>Line</strong> between Colton Crossing and Pomona. The rest operate via the UP Alhambra <strong>Line</strong>.<br />
The three alternatives to the Status Quo differ only in the routing of UP through train<br />
movements west of Pomona, summarized as follows:<br />
• Alternative 1a: About 85% of UP through train movements between Pomona and<br />
downtown Los Angeles points are routed via the UP San Gabriel <strong>Line</strong> (Figure 4).<br />
Only UP through freight trains utilizing the City of Industry or LATC terminals,<br />
plus UP freight trains operating to/from the Glendale <strong>Line</strong>, are routed via the UP<br />
Alhambra <strong>Line</strong> west of Pomona.<br />
Pasadena<br />
Jct.<br />
East LA<br />
15%<br />
UP Alhambra <strong>Line</strong><br />
85%<br />
Figure 4: Routing Alternative 1a<br />
• Alternative 1b: Same as Alternative 1a, but with the additional feature that<br />
Metrolink Riverside – Pomona – Los Angeles trains are re-routed via the UP<br />
11<br />
Pomona<br />
UP San Gabriel <strong>Line</strong><br />
West<br />
Colton<br />
88%<br />
12%<br />
Riverside<br />
Colton
Alhambra <strong>Line</strong> west of Pomona (blue line, Figure 5). The station stop at City of<br />
Industry would be re-sited on the Alhambra line, the station stop at Montebello<br />
would be closed (with passengers re-directed to the Commerce station on the<br />
BSNF <strong>Line</strong>), and a new station stop at Alhambra would be introduced. Under this<br />
alternative, Metrolink operations and heavy UP through train movements are<br />
largely disjoint, thereby reducing track capacity requirements.<br />
Pasadena<br />
Jct.<br />
Figure 5: Routing Alternative 1b<br />
• Alternative 2: About 85% of UP through train movements between Pomona and<br />
downtown Los Angeles points are routed via the UP Alhambra <strong>Line</strong> (Figure 6).<br />
Metrolink operations continue via the UP San Gabriel <strong>Line</strong>. Only UP through<br />
freight trains utilizing the East Los Angeles terminal are routed via the UP San<br />
Gabriel <strong>Line</strong> west of Pomona. Under this alternative, Metrolink operations and<br />
heavy UP through train movements are largely disjoint, except they share<br />
trackage along the Metrolink East Bank <strong>Line</strong> (see Figure 1).<br />
Pasadena<br />
Jct.<br />
15%<br />
East LA<br />
East LA<br />
UP Alhambra <strong>Line</strong><br />
85%<br />
UP Alhambra <strong>Line</strong><br />
85%<br />
15%<br />
Figure 6: Routing Alternative 2<br />
12<br />
Pomona<br />
UP San Gabriel <strong>Line</strong><br />
Pomona<br />
UP San Gabriel <strong>Line</strong><br />
West<br />
Colton<br />
88%<br />
12%<br />
West<br />
Colton<br />
88%<br />
12%<br />
Riverside<br />
Colton<br />
Riverside<br />
Colton
Infrastructure improvements required west and south of Colton Crossing were determined<br />
in an earlier phase of this study. 1 For completeness, these improvements are tabulated in<br />
this report, integrated with the list of improvements required east and north of Colton<br />
Crossing.<br />
In both 2010 and 2025 scenarios, all three alternatives to the Status Quo have common<br />
trackage configurations on the BNSF <strong>Line</strong>, as well as east of Pomona on all UP <strong>Line</strong>s.<br />
Those configurations are summarized and compared to the improvements required for the<br />
Status Quo alternative in Tables 1, 2, and 3. (Increments in track capacity are highlighted<br />
with bold type.)<br />
The key economies in capital requirements afforded by the three alternatives to the Status<br />
Quo are as follows.<br />
• BNSF and UP trains operating on the BNSF <strong>Line</strong> are envisioned to make use of<br />
the UP Palmdale <strong>Line</strong> between Devore Road (Keenbrook) and Silverwood as if it<br />
were another BNSF main track. This avoids construction of a costly 2.2%-graded<br />
main track through the mountains between Devore Road (Keenbrook) and<br />
Silverwood. A new connection at Devore Road (Keenbrook) is required to enable<br />
this flexibility.<br />
• By routing all UP Barstow trains via the UP Palmdale <strong>Line</strong> between West Colton<br />
and Devore Road (Keenbrook), construction of an additional main track between<br />
San Bernardino and Devore Road on the BNSF <strong>Line</strong> is avoided. However, a<br />
second main track on the UP Palmdale <strong>Line</strong> is required between West Colton and<br />
Devore Road by 2025.<br />
• By routing most UP Yuma <strong>Line</strong> trains and all UP Barstow trains via West Colton<br />
instead of via Riverside, the need for costly flying junction connections at Colton<br />
Crossing and West Riverside and the need for a fourth main track on the BNSF<br />
<strong>Line</strong> between those points are avoided.<br />
• Metrolink commute operations and UP through freight operations between<br />
Pomona and Riverside/Colton are made mostly disjoint under these alternatives.<br />
However, a Metrolink fly-over at Pomona is required by 2025.<br />
1 Los Angeles – <strong>Inland</strong> <strong>Empire</strong> <strong>Railroad</strong> <strong>Main</strong> <strong>Line</strong> Advanced Planning <strong>Study</strong>, prepared for the Southern<br />
California Association of Governments by the Los Angeles Economic Development Corporation,, Contract<br />
number 01-077, Work element number 014302, October 1, 2002.<br />
13
Table 1.<br />
Summary of Required Track Capacity on BNSF <strong>Line</strong>,<br />
South and West of Colton Crossing<br />
(Figures express required numbers of main tracks.)<br />
Status Quo Alternatives 1 and 2<br />
<strong>Line</strong> Segment Existing 2010 2025 2010 2025<br />
in 2005<br />
BNSF <strong>Line</strong><br />
Hobart – Bandini 3 3 4 3 4<br />
Bandini – Basta 2 3 4 3 4<br />
Bandini – Fullerton Jct. 3 3 4 3 4<br />
Fullerton Jct. – Atwood 2 2 3 2 3<br />
Atwood – Esperanza 2 3 3 3 3<br />
Esperanza – Prado Dam 3 3 3 3 3<br />
Prado Dam – West Riverside 2 3 3 3 3<br />
West Riverside jct. with UP At At Flying At At<br />
grade grade jct. grade grade<br />
West Riverside – Highland 3 3 4 3 3<br />
Highland – Colton Crossing 2 3 4 3 3<br />
Colton Crossing At At Separated, At Separated<br />
grade grade with flying<br />
jct. to UP<br />
grade<br />
Note: A “flying junction” allows connecting movements to proceed without fouling the route of opposing<br />
through traffic, much like a freeway interchange.<br />
In 2010, the BNSF <strong>Line</strong> will require a minimum of three main tracks over the entire<br />
extent between Colton Crossing and Barstow (Table 2). To match Year 2000 transit<br />
times, four main tracks are required on the steep mountain grade between Devore Road<br />
(Keenbrook) and Summit (Table 2). Under the alternatives to the Status Quo, integration<br />
of the UP Palmdale <strong>Line</strong> with the BNSF main tracks avoids the costly construction of a<br />
new 2.2%-gradient track climbing the south slope of Cajon Pass. In order to economize<br />
on construction costs, the new fourth main track can be constructed as a second, 3%gradient<br />
downhill track on the south slope of Cajon Pass (Table 2). On the other hand,<br />
under the Status Quo, both new 2.2%-gradient and 3%-gradient tracks are required (Table<br />
2).<br />
In 2025, the BNSF <strong>Line</strong> will require a minimum of four main tracks over the entire extent<br />
between Devore Road (Keenbrook) and Barstow (Table 2). Under the Status Quo, four<br />
main tracks also are required San Bernardino – Devore Road (Keenbrook). In contrast,<br />
three tracks are sufficient between San Bernardino and Devore Road (Keenbrook) under<br />
the alternatives to the Status Quo (Table 2). This is because the alternatives to the Status<br />
Quo re-route UP Barstow trains via West Colton. Offsetting this savings, there is a<br />
requirement in 2025 under the alternatives to the Status Quo for two main tracks on the<br />
UP Palmdale <strong>Line</strong> from West Colton to connections with the BNSF <strong>Line</strong> at Devore Road<br />
(Keenbrook).<br />
14
Table 2.<br />
Summary of Required Track Capacity on BNSF <strong>Line</strong>,<br />
North of Colton Crossing<br />
(Figures express required numbers of main tracks. Percentages express track gradients.)<br />
Status Quo Alternatives 1 and 2<br />
<strong>Line</strong> Segment Existing 2010 2025 2010 2025<br />
BNSF <strong>Line</strong><br />
Colton Crossing –<br />
Rana<br />
Rana – San<br />
Bernardino<br />
San Bernardino –<br />
Verdemont<br />
Verdemont –<br />
Devore Road<br />
Devore Rd.<br />
(Keenbrook)<br />
connection<br />
Devore Road –<br />
Cajon<br />
Cajon –<br />
Silverwood<br />
Silverwood<br />
connection<br />
Sliverwood -<br />
in 2005<br />
2 3 3 3 3<br />
4 4 4 4 4<br />
3 4 4 3 3<br />
2 4 4 3 3<br />
One<br />
conn.<br />
One<br />
conn.<br />
15<br />
One<br />
conn.<br />
Univ.<br />
conns.<br />
Univ.<br />
conns.<br />
2 4 4 3 4<br />
One 2.2%, Two 2.2%, Two 2.2%, One 2.2%, One 2.2%,<br />
one 3% two 3% three 3% two 3% three 3%<br />
One One One One One<br />
conn. conn. conn. conn. conn.<br />
One 2.2%, Two 2.2%, Two 2.2%, Two 2.2%, Two 2.2%,<br />
Summit<br />
one 3% two 3% three 3% two 3% three 3%<br />
Summit – Barstow 2 3 4 3 4<br />
Note: “One connection” indicates only two out of four possible connecting movements are feasible.<br />
“Universal connections” indicates all four possible connecting movements are feasible.
Table 3.<br />
Summary of Required Track Capacity on UP <strong>Line</strong>s East of Pomona<br />
(Figures express required numbers of main tracks.)<br />
Status Quo Alts. 1 and 2<br />
<strong>Line</strong> Segment Existing<br />
in 2005 2010 2025 2010 2025<br />
UP Yuma <strong>Line</strong><br />
Colton Crossing – Garnet 2 2 2 2 2<br />
Garnet – Salvia 1 2 2 2 2<br />
Salvia - Indio<br />
UP Palmdale <strong>Line</strong><br />
1 1 2 1 2<br />
West Colton – Devore Rd.<br />
(Keenbrook)<br />
1 1 1 1 2<br />
Devore Rd. (Keenbrook) –<br />
Hiland<br />
UP San Gabriel <strong>Line</strong><br />
1 1 1 1 1<br />
West Riverside – Streeter 1 2 2 1 1<br />
Streeter - Arlington 2 2 2 2 2<br />
Arlington - Pedley 1 2 2 1 1<br />
Pedley – Bon View 2 2 2 2 1<br />
Bon View - Pomona<br />
UP Alhambra <strong>Line</strong><br />
1 2 2 1 1<br />
Colton Crossing – West<br />
Colton<br />
2 2 2 2 2<br />
Jct. with Palmdale <strong>Line</strong> Partial Partial Full Partial Full<br />
at West Colton<br />
flying flying flying flying flying<br />
West Colton – Pomona 1 1 1 2 2<br />
Pomona<br />
At-grade At-grade At-grade At-grade Metro-<br />
route connections<br />
crosscrosscrosscrosslinkoversoversoversovers fly-over<br />
Note: A “flying junction” allows connecting movements to proceed without fouling the route of opposing<br />
through traffic, much like a freeway interchange. A “partial flying junction” partially eliminates conflicts<br />
between through and connecting movements. A “fly-over” is a grade-separated crossing of rail lines.<br />
Movements connecting between routes by using at-grade crossovers block through traffic.<br />
Under the Status Quo alternative, a fifth main track is required in 2025 between Cajon<br />
station and Summit (Table 2). It is recommended that this track be constructed to a 2.2%<br />
gradient to serve flexibly as either an uphill or a down hill track. Under the alternatives to<br />
the Status Quo, integration of the UP Palmdale <strong>Line</strong> with the BNSF main tracks means<br />
that one 2.2%-gradient track and one 3%-gradient track must be constructed to<br />
accommodate 2025 traffic levels. Under the Status Quo, two 2.2%-gradient and one 3%gradient<br />
track must be constructed (Table 2).<br />
Despite these ambitious improvements, passenger trains on both the UP Yuma <strong>Line</strong> and<br />
the BNSF <strong>Line</strong> will experience relatively slow transit times, about 2 hours Colton<br />
16
Crossing – Yuma and 3 hours, 5 minutes Colton Crossing – Barstow. These figures are<br />
longer than free-running transit times by about 60 minutes and about 10 minutes,<br />
respectively. This is due to the need to follow slower-moving freight trains operating on<br />
the same tracks over the mountain grades. Should faster transit times for passenger trains<br />
be desired, an additional track will be required where grades exceed 1.5%. This applies to<br />
the segments Victorville to San Bernardino on the BNSF <strong>Line</strong> and Colton to Garnet<br />
(Palm Springs station) on the UP Yuma <strong>Line</strong>.<br />
Under all alternatives, in 2010, the UP Yuma <strong>Line</strong> will require two main tracks from<br />
Colton Crossing east to Salvia (about 20 miles from Indio). In 2025, two main tracks are<br />
required over the entire extent to Indio (Table 3).<br />
Under all alternatives, a full flying junction of the UP Palmdale and Alhambra <strong>Line</strong>s and<br />
approaches to West Colton Yard also is required, enabling Palmdale <strong>Line</strong> trains to enter<br />
and exit the Yard or the Alhambra <strong>Line</strong> without fouling opposing movements on the<br />
Alhambra <strong>Line</strong> main tracks (Table 3).<br />
Between Colton Crossing and Pomona, the alternatives to the Status Quo concentrate UP<br />
trains on the UP Alhambra <strong>Line</strong>. This requires a second main track in 2010 between West<br />
Colton and Pomona (Table 3). On the other hand, the Status Quo requires a second main<br />
track West Riverside – Pomona on the UP San Gabriel <strong>Line</strong> (Table 3). In addition, in<br />
2025, the Status Quo requires flying junction connections with BNSF tracks at Colton<br />
Crossing and West Riverside, as well as a fourth main track on the BNSF <strong>Line</strong> between<br />
Colton Crossing and West Riverside (Table 1).<br />
West of Pomona, the alternatives take different strategies with consequent different<br />
required trackage configurations, as summarized in Tables 4 and 5. The Status Quo<br />
requires two main tracks on the UP San Gabriel <strong>Line</strong> west of Pomona in 2010 and two<br />
main tracks on the Alhambra <strong>Line</strong> west of Pomona in 2025 (Table 4). Alternative 1a,<br />
concentrating UP through freight operations on the UP San Gabriel <strong>Line</strong> west of Pomona<br />
where they share right of way with Metrolink operations, requires three main tracks on<br />
that line by 2025 (Table 5). Alternative 1b, shifting Metrolink over to the Alhambra <strong>Line</strong><br />
west of Pomona, is able to meet transit time goals with two main tracks west of Pomona<br />
on the San Gabriel <strong>Line</strong> in 2010 and no improvements to the Alhambra <strong>Line</strong> west of<br />
Pomona (Table 5). In terms of track capacity expenditures, this is the most efficient<br />
alternative. Alternative 2, concentrating UP through freight operations on the UP<br />
Alhambra <strong>Line</strong> west of Pomona and leaving Metrolink on the UP San Gabriel <strong>Line</strong>,<br />
requires full double-tracking of the Alhambra <strong>Line</strong>, double-tracking of the San Gabriel<br />
<strong>Line</strong> west of Pomona, triple-tracking of the East Bank <strong>Line</strong>, and a fly-over at Pasadena<br />
Jct. for the Metrolink San Bernardino <strong>Line</strong> (Table 5). This alternative is more costly than<br />
Alternative 1b, but less than Alternative 1a and the Status Quo.<br />
17
Table 4. Summary of Required Track Capacity on<br />
UP <strong>Line</strong>s West of Pomona For Status Quo Alternative<br />
(Figures express required numbers of main tracks.)<br />
<strong>Line</strong> Segment Existing in 2005 2010 2025<br />
UP San Gabriel <strong>Line</strong><br />
Pomona – Roselawn 1 2 2<br />
Roselawn – Bartolo 2 2 2<br />
Bartolo – Pico Rivera 1 2 2<br />
Pico Rivera – Redondo 2 2 2<br />
UP Alhambra <strong>Line</strong><br />
Pomona - Alhambra 1 1 2<br />
Alhambra – Yuma Jct. 2 2 2<br />
Yuma Jct. – Pasadena Jct. 1 1 1<br />
Metrolink crossing at Pasadena Jct. At grade At grade At grade<br />
Pasadena Jct. – Ninth St. 2 2 2<br />
Ninth St. - Redondo 1 1 1<br />
Table 5.<br />
Summary of Required Track Capacity on UP <strong>Line</strong>s West of Pomona<br />
For Alternatives to Status Quo Routing<br />
(Figures express required numbers of main tracks.)<br />
Existing<br />
in 2005<br />
2010 2025<br />
Alt Alt Alt Alt Alt Alt<br />
1a 1b 2 1a 1b 2<br />
San Gabriel <strong>Line</strong><br />
Pomona – Roselawn 1 2 2 1 3 2 2<br />
Roselawn – Bartolo 2 2 2 2 3 2 2<br />
Bartolo – Pico Rivera 1 2 2 1 3 2 2<br />
Pico Rivera – Redondo<br />
Alhambra <strong>Line</strong><br />
2 2 2 2 3 2 2<br />
Pomona – Alhambra 1 1 1 2 1 1 2<br />
Alhambra – Yuma Jct. 2 2 2 2 2 2 2<br />
Yuma Jct. – Pasadena<br />
Jct.<br />
1 1 1 2 1 1 2<br />
Metrolink crossing at At At At At At At Fly-<br />
Pasadena Jct.<br />
grade grade grade grade grade grade over<br />
Pasadena Jct. – Ninth<br />
St.<br />
2 2 2 2 2 2 3<br />
Ninth St. – Redondo 1 1 1 2 1 1 2<br />
Note: A “fly-over” is a grade-separated crossing of rail lines.<br />
18
Total capital costs required to raise track capacity from the Year 2000 Base Case to<br />
configurations that accommodate Year 2010 traffic levels range from 1.2 to 1.4 billion<br />
dollars among the alternatives. Total capital costs required to raise track capacity from<br />
the Year 2000 Base Case to configurations that accommodate Year 2025 traffic levels<br />
range from 2.2 to 2.7 billion dollars. The Status Quo Alternative is the most costly, and<br />
Alternative 1(b) is least costly, about 300 million dollars less than the Status Quo.<br />
Considering the improvements that have already been completed or are now fully funded<br />
and under construction, it is estimated these improvements account for 253 million<br />
dollars worth of the total Year 2025 investment requirements. In terms of net<br />
expenditures still required, the ranking of alternatives is as follows:<br />
• Alternative 1(b) - $2.05 billion<br />
• Alternative 2 - $2.27 billion<br />
• Alternative 1(a) - $2.33 billion<br />
• Status Quo - $2.35 billion<br />
The $253 million in funded capacity improvements to date represents about 18% of the<br />
required capital outlays to raise capacity under the Status Quo Alternative from Year<br />
2000 traffic levels to Year 2010 levels and about 21% of the required outlays under<br />
Alternative 1b. Yet half of the decade has passed. Clearly, improvements in track<br />
capacity are not keeping up with the rising traffic levels; in fact, capacity requirements<br />
are growing at more than double the rate of growth in capacity. As a result, the quality of<br />
freight and passenger services in the Los Angeles Basin is declining. In view of this<br />
trend, recent severe delays to Amtrak and Metrolink trains and “melt-downs” in rail<br />
freight operations are not surprising.<br />
As an input to an emissions analysis of the routing alternatives, vehicular delays at grade<br />
crossings in the study area were estimated for the Year 2000 Base Case and the 2010 and<br />
2025 future scenarios. For delays in future years, it was assumed that 10 existing grade<br />
crossings would be grade separated and one would be closed by 2010, and it was<br />
assumed that an additional 38 streets would be grade separated by 2025. Vehicle-hours of<br />
delay per day for these streets were “zeroed out” in the final results. The list of assumed<br />
grade separations was derived from the high priority listings of various jurisdictions<br />
involved: San Gabriel Valley Council of Governments and the Alameda Corridor-East<br />
Construction Authority, SANBAG, RCTC, OCTA, Caltrans, OnTrac and the Gateway<br />
Cities Council of Governments.<br />
Year 2000 emissions were then calculated for BNSF and UP through freight trains and<br />
passenger trains along BNSF and UP main lines operating over main lines between the<br />
north end of the Alameda Corridor and Barstow and Indio. Locomotive emissions were<br />
calculated based on the average through train movements per day and idling emissions<br />
from traffic delay were estimated based on total vehicle hours of delay at railroad<br />
crossings at grade. Emissions are categorized by reactive organic gases, carbon<br />
monoxide, nitrogen oxides, particulate matter, and sulfurous oxides. Estimates of Year<br />
2000 Base-Case and future emissions under the Status Quo routing are summarized in<br />
19
Table 6. These emissions are comprised of approximately 95% rail emissions and 5%<br />
vehicle delay emissions generated at grade crossings.<br />
Table 6.<br />
Locomotive and Vehicle Delay Emissions from the <strong>Main</strong> <strong>Line</strong> Rail Network,<br />
Year 2000 Base Case, Year 2010 and Year 2025, Under Status Quo Routing<br />
(Emissions expressed in tons)<br />
Year ROG CO NOx PM10 SOx<br />
2000 508.08 821.74 15437.95 348.10 958.45<br />
2010 581.36 2940.13 10576.70 385.03 117.28<br />
2025 868.10 4351.38 15890.83 578.55 11.65<br />
In future years, Basin-wide ROG, CO and PM10 emissions from rail operations are<br />
projected to rise substantially, while SOx emissions will be dramatically reduced. NOx<br />
emissions will be reduced in 2010 but will revert to about Year 2000 levels in 2025. The<br />
accommodation of substantially increased rail traffic without increases in NOx and SOx<br />
results from mitigation afforded by the phased introduction of “Tier II” locomotives plus<br />
the completion of eleven grade separation projects in 2010 and 38 more grade separations<br />
in 2025. 2<br />
Each of the alternatives to the Status Quo reduces emissions. This reduction results from<br />
decreases in freight and passenger train total travel times, plus concentration of heavy<br />
freight train operations on routes that are more grade-separated. Table 7 summarizes the<br />
emission benefits within the <strong>Main</strong> <strong>Line</strong> Rail Network for the alternatives to the Status<br />
Quo.<br />
Table 7<br />
Future Basin-wide Emission Benefits from Routing Alternatives<br />
(Emission Reductions in tons compared to Status Quo Alternative)<br />
ROG CO NOx PM10 SOx<br />
Alternative 2010 2025 2010 2025 2010 2025 2010 2025 2010 2025<br />
1a 92 167 469 839 1671 3059 60.85 111.45 18.52 2.25<br />
1b 99 163 504 818 1802 2984 65.64 108.69 19.99 2.19<br />
2 98 156 491 782 1801 2865 65.50 104.21 19.98 2.09<br />
2 Emission factors for "Tier I" locomotives used in this analysis are based on actual locomotive duty cycles.<br />
Lacking data on actual “Tier II” locomotive duty cycles, emission factors assumed for "Tier II"<br />
locomotives reflect the EPA Tier II standards. Locomotive fleets were 100% Tier I in 2000 but will be<br />
100% Tier II or equivalent by 2010. EPA Tier II standards for ROG and CO are more lenient than actual<br />
Tier I locomotive emissions, more lenient by a factor of three in the case of CO. The CO emissions of Tier<br />
II locomotives may turn out to be much less than the EPA standard, and therefore the projected factor-offive<br />
increase in CO emissions from 2000 to 2025 may be an anomaly resulting from the lack of data.<br />
20
Finally, the four alternatives were evaluated along the following four dimensions:<br />
• Total capital costs required to raise track capacity from Year 2005 configurations<br />
to configurations accommodating Year 2025 traffic forecasts with transit times<br />
comparable to the Year 2000 Base Case.<br />
• Total emissions from through train movements and vehicles delayed at grade<br />
crossings.<br />
• Total population exposure to heavy freight train operations, defined as the total<br />
2025 population residing within 0.5 miles of trackside multiplied by the forecast<br />
number of peak-day through freight train movements.<br />
• Total population access to passenger train operations, defined as the total 2025<br />
population residing within 0.5 miles of trackside multiplied by the forecast<br />
number of weekday passenger trains.<br />
Table 8 summarizes the evaluation. Figures are expressed as percentage improvements<br />
over the Status Quo Alternative.<br />
Table 8<br />
Ranking of Routing Alternatives<br />
(Figures express percentage Year 2025 improvement over Status Quo Alternative)<br />
Alternative Capital Cost Emissions Population Exposure Population Access<br />
To Freight Trains To Passenger Trains<br />
1(a) 1.1% 19.2% 4.6% 0.0%<br />
1(b) 13.1% 18.8% 4.6% 4.7%<br />
2 3.4% 18.0% 0.1% 0.0%<br />
In the dimensions of cost, population exposure to freight trains and population access to<br />
passenger trains, Alternative 1(b) ranks best. In the emissions dimension, Alternative 1(a)<br />
ranks best, but Alternative 1(b) contributes only about 0.6% more emissions. Compared<br />
to the Status Quo, Alternative 1(b) offers about 13% less capital cost, about 19% less<br />
emissions, about 5% less population exposure to main-line freight train operations, and<br />
about 5% more population access to passenger train operations.<br />
21
1. Introduction<br />
The <strong>Inland</strong> <strong>Empire</strong> <strong>Railroad</strong> <strong>Main</strong> <strong>Line</strong> <strong>Study</strong> examines railroad infrastructure needs and<br />
operations for both freight and passenger trains in Southern California. Major objectives<br />
of the study include:<br />
* Maximize goods movement carrying capacity of the railroad main lines extending from<br />
downtown Los Angeles to Barstow and Indio;<br />
* Guarantee that existing levels of reliability and existing train speeds can be maintained<br />
or increased such that the rail freight mode will continue to be competitive with trucking<br />
for long-haul, time-sensitive shipments including marine port and domestic traffic;<br />
* Reduce the impacts of increasing levels of freight train traffic on communities traversed<br />
by these rail lines;<br />
* Facilitate Metrolink and other passenger rail use of the rail corridors and ensure that the<br />
potential to enhance and improve commuter and other transit service will be maintained;<br />
* Identify new facilities and infrastructure needs, and their respective implementation and<br />
phasing requirements.<br />
A previous phase of this study examined infrastructure needs from downtown Los<br />
Angeles to Colton Crossing. 3 The subsequent phase, the subject of this report, extends the<br />
scope eastward and northward over rail main lines to Barstow and Indio.<br />
The firm of Leachman and Associates LLC was contracted by the Southern California<br />
Association of Governments to perform this study. Subconsultants assisting Leachman<br />
and Associates in the work reported herein include Gill V. Hicks & Associates and<br />
George R. Fetty & Associates.<br />
This document serves as the final report for the study. This report was authored by Dr.<br />
Robert C. Leachman, who is solely responsible for the accuracy and completeness of the<br />
contents. Dr. Maged M. Dessouky of Leachman and Associates LLC was a key technical<br />
contributor to the simulation modeling and analysis reported in sections 6 and 7. Mr. Gill<br />
Hicks was a key technical contributor and co-author of section 9, capital costs. Messrs.<br />
Michael Rieger and Gill Hicks were key technical contributors and primary authors of<br />
section 10, emissions analysis. Mr. George Fetty made important contributions to the<br />
determination of current traffic levels and traffic forecasts, formulation of routing<br />
alternatives, estimation of capital costs, and quantification of population exposure to train<br />
operations.<br />
This study has benefited from data, comments and suggestions received from<br />
representatives of BNSF, UP and Metrolink. However, the conclusions and evaluations<br />
expressed herein are those of the consultant, and do not necessarily represent the views of<br />
the railroads or of any governmental agency.<br />
3 Los Angeles Economic Development Corporation, Los Angeles – <strong>Inland</strong> <strong>Empire</strong> <strong>Railroad</strong> <strong>Main</strong> <strong>Line</strong><br />
Advanced Planning <strong>Study</strong>, Prepared for the Southern California Association of Governments, Contract<br />
number 01-077, Work element number 014302, October 1, 2002.<br />
22
2. The <strong>Main</strong> <strong>Line</strong> Rail Network<br />
Southern California is served by two major freight railroads, Burlington Northern Santa<br />
Fe (BNSF) and Union Pacific (UP). These are competing carriers operating their own<br />
terminals and rail networks. On several important segments within the study area, one<br />
carrier exercises trackage rights over lines owned by the other. There also are certain<br />
segments of the network owned and controlled by Metrolink over which the freight<br />
railroads exercise trackage rights.<br />
Through freight trains on both railroads may be classified as intermodal (trailers and<br />
containers on rail flat cars), carload (mixed freight in carload lots, mostly bulk<br />
commodities), unit auto trains (solid trains of multilevel vehicle-carrying cars) and unit<br />
bulk (grain, coal, soda ash and oil trains, both loaded and empty). Intermodal trains may<br />
be further sub-classified into expedited intermodal (trailers and some double-stacked<br />
domestic container traffic), and non-expedited intermodal (mostly double-stacked marine<br />
container traffic).<br />
Figures 1 and 2 provide diagrams of the main line rail network in the study area (not to<br />
scale). Not shown in the figures are numerous low-density branch lines for originating<br />
and terminating carload freight. An overview of through freight train operations and<br />
terminals in this network for each freight railroad follows.<br />
BNSF Overview<br />
BNSF operates a single main line (hereafter referred to as the “BNSF <strong>Line</strong>”) in the study<br />
area, extending 152 miles from Barstow at the northeastern end to Redondo (near<br />
downtown Los Angeles) on the southwestern end. This line comprises two crew districts.<br />
All BNSF through freight trains change crews at San Bernardino and Barstow.<br />
At Barstow, BNSF lines to Northern California and to eastern points diverge. A large<br />
carload classification yard is located there. All BNSF carload through freight trains in the<br />
study area originate or terminate here. BNSF intermodal, auto and unit bulk trains<br />
operating in the study area generally bypass the Barstow classification yard. Beyond<br />
Barstow, the vast majority of them operate over the line to/from eastern points rather than<br />
the line to/from Northern California.<br />
From Daggett westward to West Riverside, UP freight trains on the UP Las Vegas <strong>Line</strong><br />
operate over the BNSF <strong>Line</strong> under a long-standing trackage rights agreement. Some UP<br />
trains cross over to/from the UP Palmdale <strong>Line</strong> using connections installed at Silverwood<br />
or Keenbrook. Others may use connections at Colton Crossing or West Riverside to reach<br />
home rails.<br />
Between Victorville and San Bernardino, the BNSF <strong>Line</strong> crosses Cajon Pass. The<br />
ascending grade southbound to Summit is 1.6%. From San Bernardino to Summit, the<br />
ascending grade northbound is 2.2% on the track ordinarily used by uphill trains. On the<br />
23
track ordinarily used by downhill trains, the grade is 3% from Summit to Cajon station,<br />
rejoining the other track at that point to run parallel for the remainder of the descent to<br />
San Bernardino.<br />
These are steep grades. Northbound, non-expedited intermodal trains typically require<br />
remotely-controlled or manned pusher engines San Bernardino – Summit, as do some<br />
northbound carload trains. Southbound, loaded unit bulk trains typically require pusher<br />
engines Victorville – San Bernardino. For safety reasons, all southbound trains leaving<br />
Summit on the 3%-gradient track are subject to a minimum 30-minute time lag to the<br />
departure of the previous train descending to Cajon station.<br />
At San Bernardino, BNSF operates a large intermodal terminal. Some intermodal trains<br />
to/from eastern points originate/terminate here. Others to/from Los Angeles may stop to<br />
pick up or set out intermodal traffic. BNSF also operates a terminal for unit auto trains in<br />
San Bernardino. One carload train per day in each direction enters/exits the BNSF main<br />
line at San Bernardino, operating to/from a carload freight train terminal at Kaiser station,<br />
located along the Metrolink San Bernardino <strong>Line</strong> about 10 miles west of San Bernardino.<br />
Metrolink commuter trains operate over the BNSF line between San Bernardino and<br />
Hobart. Some of these trains originate/terminate at San Bernardino, some at Riverside.<br />
Some diverge from the BNSF line at Atwood, while others enter the BNSF line at<br />
Fullerton. Amtrak Surfliner trains also operate over the BNSF line between Fullerton and<br />
Hobart. At Hobart, passenger trains diverge on passenger-only tracks that fly over the<br />
entrance to the Alameda Corridor at Redondo.<br />
At Colton, BNSF and UP main lines cross at grade. A connecting track in the southeast<br />
quadrant of the crossing allows UP trains to/from the UP Yuma <strong>Line</strong> to operate over the<br />
BNSF line between Colton and West Riverside under trackage rights. A connecting track<br />
in the northwest quadrant of the crossing allows UP trains to/from the UP Las Vegas <strong>Line</strong><br />
to connect to the UP Alhambra <strong>Line</strong> to West Colton. BNSF operates one carload train<br />
each way between Barstow and UP’s West Colton classification yard, also using the<br />
connecting track in the northwest quadrant.<br />
At Atwood, a Metrolink-owned line to Orange County points diverges from the BNSF<br />
line. This line is used by BNSF through freight trains to/from San Diego.<br />
At Fullerton, another Metrolink-owned line to Orange County junctions with the BNSF<br />
line. This line does not see through freight train operations, but it does see heavy use by<br />
Amtrak and Metrolink passenger trains.<br />
At La Mirada and Pico Rivera (about 8 miles and 15 miles west of Fullerton,<br />
respectively), BNSF operates small terminals for interchanging carload freight traffic<br />
to/from local freight switching operations. Through carload freight trains stop to set out<br />
or pick up at these points.<br />
24
At Hobart BNSF operates a large intermodal terminal and a locomotive facility (at the<br />
adjacent Commerce station). Most expedited BNSF intermodal trains operating in the<br />
study area originate or terminate here. The crews and locomotives for carload freight<br />
trains serving La Mirada and Pico Rivera also originate and terminate here.<br />
At Redondo, the BNSF main line ends in a connection with the Alameda Corridor. BNSF<br />
trains to/from terminals in the vicinity of the Ports of Los Angeles and Long Beach<br />
operate through Redondo. These include non-expedited intermodal trains, carload trains,<br />
and occasional unit bulk trains (grain, coal or white bulk such as soda ash).<br />
UP Overview<br />
UP operates a more complicated main line network in Southern California, a legacy of<br />
merging Southern Pacific into Union Pacific in 1996.<br />
UP’s principal carload freight classification terminal in the study area is located at West<br />
Colton. Almost all UP carload freight trains in the study area originate or terminate here.<br />
Regional carload freight trains termed Haulers operate between West Colton and various<br />
points in the Los Angeles Basin. Long-distance carload freight trains operate in/out of<br />
West Colton to Northern California via the Glendale <strong>Line</strong>, to Northern California and the<br />
Pacific Northwest via the Palmdale <strong>Line</strong>, and to eastern points via the Yuma <strong>Line</strong>. Longdistance<br />
carload freight trains to/from the Las Vegas line typically utilize the Palmdale<br />
line as far as Keenbrook or Silverwood, then crossing over onto the BNSF Cajon line and<br />
exercising trackage rights as far as Daggett. As described above, an alternate route for<br />
these trains is to use the connecting track in the northwest quadrant of Colton Crossing,<br />
exercising trackage rights over BNSF from that point to Daggett.<br />
Extending east from Colton Crossing is UP’s main line to Yuma, El Paso and eastern<br />
points. Within the limits of the study area, this line extends 72 miles from Colton<br />
Crossing to Indio. The line ascends a 1.8% grade eastbound to Apex station (near the<br />
town of Beaumont). Westbound, the line ascends a 2.0% grade from Garnet station<br />
(location of the Palm Springs passenger station) to Apex. Most eastbound carload trains<br />
and many eastbound intermodal trains require pusher engines Colton – Apex. Most<br />
westbound carload trains and some westbound intermodal trains require pusher engines<br />
Garnet – Apex.<br />
Extending north from West Colton is UP’s main line to Palmdale, Bakersfield, Northern<br />
California and Pacific Northwest points. The line ascends grades of up to 2.2%<br />
northbound for 29 miles to Hiland station. As remarked earlier, connections to the BNSF<br />
Cajon line exist at Keenbrook and Silverwood. Some northbound carload trains require<br />
pusher engines West Colton – Hiland. In contrast to the heavy traffic volumes on the<br />
BNSF <strong>Line</strong> over Cajon Pass, traffic volumes on the UP Palmdale <strong>Line</strong> are light. UP<br />
intermodal trains between Los Angeles and the Pacific Northwest exit the Los Angeles<br />
Basin via the Glendale <strong>Line</strong>, and unit oil and white bulk trains heading to the Southern<br />
California ports from Central California also normally use the Glendale <strong>Line</strong>. This leaves<br />
25
only UP carload traffic to/from Northern California and the Pacific Northwest as the<br />
principal traffic on the Palmdale <strong>Line</strong>, forecast to reach only 9 trains per peak day in<br />
2025. (This count excludes UP trains to/from Barstow that may be routed to use this route<br />
as far north as Keenbrook or Silverwood.)<br />
From Colton Crossing to the downtown Los Angeles area, UP has two main line routes.<br />
The San Gabriel <strong>Line</strong> uses trackage rights over BNSF south from Colton Crossing to<br />
West Riverside, then turns westward. Metrolink commuter trains to/from Riverside<br />
operate over the UP San Gabriel <strong>Line</strong> from West Riverside to a connection with<br />
Metrolink’s East Bank <strong>Line</strong> near East Los Angeles. The Alhambra <strong>Line</strong> extends<br />
westward from West Colton to Yuma Jct. (at the Los Angeles Transportation Center<br />
intermodal terminal) where connections with the Glendale <strong>Line</strong> and the East Bank <strong>Line</strong><br />
are made. The junction of the connecting track with the East Bank <strong>Line</strong> is known as<br />
Pasadena Jct. The Metrolink San Bernardino <strong>Line</strong> is crossed at grade at is point.<br />
The San Gabriel and Alhambra <strong>Line</strong>s come alongside each other at Pomona, where<br />
connections allow trains to cross over from one route to the other.<br />
Along the Alhambra <strong>Line</strong>, UP operates a major intermodal terminal and a unit auto train<br />
terminal at City of Industry. West of City of Industry, there are no significant rail freight<br />
terminals until LATC is reached at the western end of the line (adjacent to Yuma Jct.).<br />
LATC originates and terminates a modest number of UP intermodal trains. Other<br />
intermodal trains, unit auto trains and one carload (Hauler) train each way utilize the<br />
Metrolink East Bank <strong>Line</strong> to secure a route connection between the Alhambra <strong>Line</strong> and<br />
the Alameda Corridor.<br />
The Glendale <strong>Line</strong> contributes unit oil trains that traverse the East Bank <strong>Line</strong> en route to<br />
the Alameda Corridor. Empty unit oil trains make a reverse movement.<br />
Along the San Gabriel <strong>Line</strong>, the UP operates a terminal for unit auto trains at Mira Loma<br />
(about 13 miles east of Pomona). A small terminal for interchanging carload freight<br />
traffic to/from local operations is located at Montclair (about 3 miles east of Pomona). At<br />
East Los Angeles, UP operates a large intermodal terminal. Expedited UP intermodal<br />
trains operate to and from this terminal. Carload trains also originate and terminate at<br />
East Los Angeles.<br />
At Soto St. Jct. (located just west of East Los Angeles), Metrolink trains from Riverside<br />
diverge on to Metrolink’s East Bank <strong>Line</strong> and proceed north along the Los Angeles River<br />
towards Los Angeles Union Passenger Terminal (LAUPT). Just across the bridge over<br />
the Los Angeles River, the San Gabriel <strong>Line</strong> terminates at Redondo, the start of the<br />
Alameda Corridor. Intermodal, carload, unit auto and occasional unit bulk trains from the<br />
San Gabriel line enter/exit the Corridor at this point.<br />
26
Track Configuration<br />
In this section, current track configuration of the main line network is summarized.<br />
Detailed track schematics for the Year 2000 network are provided in Appendix A.<br />
All main lines in the study area are controlled under a system known as Centralized<br />
Traffic Control (CTC). Switches and signals are controlled remotely by a traffic<br />
controller known as a train dispatcher. Both UP and BN dispatchers for lines in the study<br />
are located in the same building in San Bernardino. Being co-located allows dispatchers<br />
from the two railroads to converse and jointly plan the movement of trains needing to<br />
exercise trackage rights. Metrolink dispatchers are located in downtown Los Angeles.<br />
BNSF Trackage<br />
The BNSF <strong>Line</strong> features reverse-signaled multiple tracks over its entire length. Power<br />
crossovers are located every several miles for flexible routing of trains.<br />
Starting the review at Redondo, parallel two-main-track passenger and freight lines<br />
merge to become three main tracks 2 miles east at Hobart, narrowing to two main tracks<br />
at Bandini (about 5 miles east of Hobart). Three main tracks resume at Basta (2 miles<br />
west of Fullerton) and extend 2.5 miles to Fullerton Jct., where most Amtrak and<br />
Metrolink trains diverge. A third main track between Bandini and Basta is currently<br />
under construction.<br />
The BNSF <strong>Line</strong> has two main tracks from Fullerton Jct. through Atwood to Esperanza,<br />
where three main tracks resume. The third main track ends about 6 miles further east at<br />
Prado Dam. At West Riverside (where the UP San Gabriel <strong>Line</strong> trains enter the BNSF<br />
<strong>Line</strong> on trackage rights), a third main track resumes and extends 4.5 miles to Highgrove.<br />
From Highgrove across Colton Crossing to Rana (4.5 miles), there are two main tracks.<br />
Single-track connections to Union Pacific tracks at West Riverside and Colton Crossing<br />
are at-grade junctions.<br />
From Rana to San Bernardino, there are four main tracks. One main track (known as<br />
<strong>Main</strong> 4) takes a shorter route than the other three, but it has an at-grade, puzzle-switch<br />
junction with the Metrolink San Bernardino <strong>Line</strong>. Both through Metrolink movements<br />
and equipment movements between the San Bernardino station and lay-over/servicing<br />
tracks foul this junction. As a result, <strong>Main</strong> 4 is generally restricted to passenger train<br />
operations.<br />
Between San Bernardino and Verdemont (7.5 miles), there are three main tracks,<br />
collapsing to two main tracks at Verdemont. The 6.5-mile segment of third main track<br />
from Baseline to Verdemont was completed and entered service in late 2004. A<br />
connecting track between the UP Palmdale <strong>Line</strong> and the BNSF <strong>Line</strong> is installed at<br />
Keenbrook, located about a half mile north of Devore Road on the BNSF <strong>Line</strong> and a half<br />
mile north of Dike Road on the UP Palmdale <strong>Line</strong>.<br />
27
Two-main-track operation extends 10.5 miles from Verdemont to Cajon, where the two<br />
tracks diverge to take separate routes to Summit. Operation is normally left-handed in<br />
order to take advantage of more favorable grades. <strong>Main</strong> 1, the usual northbound track,<br />
has a 2.2% gradient to Summit, while <strong>Main</strong> 2 has a 3% gradient Cajon – Summit.<br />
Another connecting track with the UP Palmdale <strong>Line</strong> is located at Silverwood,<br />
connecting only to <strong>Main</strong> 1. A UP train operating on BNSF <strong>Main</strong> 2 southward from<br />
Victorville must use one of the crossovers to <strong>Main</strong> 1 at or before Summit in order to<br />
utilize this connection.<br />
In deference to the steep and dangerous grade on <strong>Main</strong> 2, BNSF has instituted a policy of<br />
spacing southbound trains leaving Summit on <strong>Main</strong> 2 by at least 30 minutes. This spacing<br />
requirement does not apply to UP trains using the Silverwood connecting track.<br />
From Summit north about 1.5 miles to Martinez, there is a third main track. This track<br />
entered service in October, 2003.<br />
From Martinez northward 50 miles to Valley Jct. (the south end of Barstow), there are<br />
two main tracks. The tracks reverse positions at Frost (1.3 miles south of Victorville),<br />
with <strong>Main</strong> 2 (the usual southbound track) flying over the top of <strong>Main</strong> 1.<br />
UP Trackage<br />
The UP San Gabriel <strong>Line</strong> extends 55.1 miles from Redondo to West Riverside, where UP<br />
trains switch on to the BNSF <strong>Line</strong> exercising trackage rights as discussed above. The<br />
<strong>Line</strong> is mostly two-main-track CTC, with several stretches of single track, summarized as<br />
follows.<br />
The San Gabriel <strong>Line</strong> has two or three main tracks over the entire stretch from Redondo<br />
to Pico Rivera, a distance of 9.3 miles. At that point it narrows to single track for 1.5<br />
miles to Bartolo, where two-main-track operation resumes for the next 19 miles to<br />
Roselawn. In the Year 2000 Base Case, this line was single track for 3.8 miles between<br />
East Montebello and Bartolo, with a controlled siding at Pico Rivera. It also was single<br />
track for 2.3 miles between Diamond Bar and Spadra, located between Bartolo and<br />
Roselawn. Improvements made to the line since then eliminated the single-track<br />
segments East Montebello – Pico Rivera and Diamond Bar – Spadra.<br />
A complicated at-grade junction with the UP Alhambra <strong>Line</strong> is located in the vicinity of<br />
Pomona. A short single-track segment extends 0.3 miles from Roselawn to Oak (station<br />
names for the junction switches 1-1.5 miles west of Pomona). At Roselawn and Oak,<br />
there are parallel connecting tracks to the UP Alhambra <strong>Line</strong> whereby eastbound trains<br />
on the San Gabriel <strong>Line</strong> can cross over to continue eastward on the Alhambra <strong>Line</strong>.<br />
Westbound movements on the UP Alhambra <strong>Line</strong> also can use this connection to cross<br />
over and continue westward on the UP San Gabriel <strong>Line</strong>.<br />
28
From Oak through Pomona to Antonio (2.2 miles), the line once again has two main<br />
tracks. There are universal crossovers between the north main track of the UP San<br />
Gabriel <strong>Line</strong> and the UP Alhambra <strong>Line</strong> 0.4 miles east of Oak (named Hamilton station<br />
on the UP Alhambra <strong>Line</strong>), permitting trains in either direction on either line to cross<br />
over between the routes. Pomona station is located 0.7 miles east of Hamilton and 0.7<br />
miles west of Antonio.<br />
The San Gabriel <strong>Line</strong> continues as a single track for 5.4 miles from Antonio to Bon<br />
View, with a controlled passing siding midway at Montclair. Two-main-track operation<br />
resumes for 11.8 miles from Bon View to Limonite, with single-track operation over the<br />
next 2.7 miles to Arlington. This is followed by 2.9 miles of two-main-track operation to<br />
Streeter, in turn followed by 1.2 miles of single track to the BNSF connection at West<br />
Riverside.<br />
The UP Alhambra <strong>Line</strong> extends 56.2 miles from Yuma Jct. (adjacent to LATC) to Colton<br />
Crossing. The line is mostly single-track CTC with passing sidings, summarized as<br />
follows.<br />
The Alhambra <strong>Line</strong> has two main tracks extending from connections with Metrolink East<br />
Bank <strong>Line</strong> at Yuma Jct. 5.5 miles eastward to Alhambra. Over the next 50 miles to West<br />
Colton, the line is single track with controlled passing sidings. Usable sidings are located<br />
at El Monte (5.2 miles from Alhambra), Bassett (4.5 miles further east), City of Industry<br />
– Marne (three connected sidings in a row), Walnut (4.5 miles east of Marne), Hamilton-<br />
Reservoir (7 miles east of Walnut, albeit this passing track actually is one of the two main<br />
tracks of the San Gabriel <strong>Line</strong>), North Montclair (3 miles from Hamilton - Reservoir),<br />
North Ontario (3 miles from North Montclair), Guasti (4 miles from North Ontario), and<br />
South Fontana (5.5 miles from Guasti, at the approach to West Colton Yard). From West<br />
Colton to Colton Crossing, the line has two main tracks.<br />
The UP Palmdale <strong>Line</strong> is single-track CTC with controlled passing sidings over the 29<br />
miles from West Colton to Hiland. Passing tracks are located at Slover (1.7 miles from<br />
West Colton), Dike (10 miles from Slover), Canyon (11 miles from Dike), and Hiland.<br />
The Keenbrook connection to the BNSF <strong>Line</strong> is located 1.2 miles north of the north<br />
switch of Dike siding. The Silverwood connection to the BNSF <strong>Line</strong> is located 1.1 miles<br />
south of the south switch of Hiland siding.<br />
In the Year 2000 Base Case, the UP Yuma <strong>Line</strong> had two main tracks from Colton<br />
Crossing eastward 39.0 miles to Fingal. From that point to Indio, the line was single<br />
track. Another 8.5 miles of second main track was opened in September, 2004, from<br />
Fingal to Garnet, absorbing the controlled siding at West Palm Springs. Two main tracks<br />
now cover the entire 24.5-mile west-side 1.8% grade to the summit at Apex plus 23.5<br />
miles of the 2.0% east-side grade. A controlled siding serving the Palm Springs passenger<br />
station is located at Garnet.<br />
The remaining 23.4 miles to Indio is single track, with grades opposing westward trains<br />
ranging up to 1.1%. Controlled passing sidings are located at Salvia (5 miles from<br />
29
Garnet), Rimlon (4 miles from Salvia), Thousand Palms (5 miles from Rimlon, long<br />
enough to accommodate three trains), and Myoma (4 miles from Thousand Palms).<br />
Double track begins at West Indio (2.5 miles from Myoma), covering the last 1.3 miles<br />
into Indio.<br />
Metrolink Trackage<br />
The Metrolink East Bank <strong>Line</strong> is used by UP trains operating via the Alameda Corridor<br />
and the Alhambra <strong>Line</strong>. A single-track connection with the Corridor at Redondo crosses<br />
the Los Angles River and joins the two main tracks of the East Bank <strong>Line</strong> at Ninth Street.<br />
(Metrolink commuter trains from Riverside diverge from the UP San Gabriel <strong>Line</strong> at Soto<br />
St. Jct. and proceed over the 0.3 miles from Soto St Jct. to Ninth Street.) From Ninth<br />
Street to Pasadena Jct. (2.6 miles), the East Bank <strong>Line</strong> has two main tracks. At Pasadena<br />
Jct., UP freight trains to the Alhambra <strong>Line</strong> diverge from the East Bank <strong>Line</strong> and proceed<br />
0.4 miles on the Balloon Track (single track) to Yuma Jct., where they enter the UP<br />
Alhambra <strong>Line</strong>. There is an at-grade crossing with the Metrolink San Bernardino <strong>Line</strong> at<br />
Pasadena Jct.<br />
30
3. Freight Traffic Levels<br />
Rail freight traffic mix and overall levels exhibit considerable variability by day of week<br />
and time of year. For the purposes of simulation analysis of track capacity, a series of<br />
“peak days” is simulated. Assumed traffic levels on a peak day reflect the 90 th percentile<br />
of the statistical distribution of daily train movements. This is done to insure a robust<br />
design for trackage configuration is achieved.<br />
Base Year Methodology<br />
The counts given on following pages are for the sum of through freight train movements<br />
in both directions on a peak day. Excluded from these counts are light engine movements<br />
and local freight trains providing carload customer pick-up and delivery service. Peakday<br />
counts of 57 trains per peak day on BNSF 4 and 55 trains per peak day on UP <strong>Line</strong>s 5<br />
in year 2000 are assumed. These counts were developed from information obtained from<br />
the railroads and from previous studies, summarized as follows.<br />
Freight train movements are classified into the following types: domestic intermodal,<br />
international intermodal (including double-stack and “bare table” movements), unit auto,<br />
unit coal, unit white bulk, unit oil, and mixed carload. Some intermodal trains haul<br />
exclusively domestic traffic, some haul exclusively international traffic, while others haul<br />
a mixture of domestic and international traffic. The consultant assumed overall domesticinternational<br />
splits of intermodal traffic equal to 45:55 for BNSF and 25:75 for UP.<br />
BNSF supplied information on average-day, 90 th -percentile day 6 and theoretical peakday<br />
7 movements by type of freight train and line segment for year 2000. For the purposes<br />
of this study, the consultant established year 2000 peak-day BNSF train counts consistent<br />
with the BNSF counts on a 90 th -percentile day, except counts of certain regional carload<br />
distribution trains were held fixed. (In the BNSF data, a 90 th -percentile day has about<br />
20% more train movements than an average day.)<br />
The consultant obtained unofficial UP average-day total freight train counts by line<br />
segment for year 2001. A distribution of these counts among types of freight trains was<br />
made by the consultant based on field observations, published UP train counts 8 , and the<br />
distribution reported in the 1991 ACTC rail capacity study. 9 To define year 2000 peakday<br />
UP train counts, a 20% peaking factor was applied to the year 2001 average train<br />
counts, except counts of regional carload distribution trains (“Haulers”) were held fixed.<br />
4<br />
The figure given applies between Atwood and San Bernardino. The BNSF peak-day count drops to 50<br />
west of Atwood.<br />
5<br />
The figure given applies at Pomona. The UP peak-day count at Colton rises to 64.<br />
6 th<br />
90 percentile-day means 90% of the year did not exceed the train count on this day.<br />
7<br />
Theoretical peak-day includes the maximum daily count for each train type, but the maxima occur on<br />
different days of the year.<br />
8<br />
UP average-day train counts by route were published in the Nov., 2001 issue of Trains magazine.<br />
9<br />
Leachman and Associates, Final Report: <strong>Railroad</strong> Capacity and Operations Analysis for the Alameda<br />
Consolidated Transportation Corridor Project, December, 1991, prepared for DMJM and the Ports of Los<br />
Angeles and Long Beach.<br />
31
For the purposes of this study, the consultant assumed year 2000 international-traffic<br />
intermodal trains that originate and terminate at East Yard (UP), LATC (UP) and Hobart<br />
(BNSF) to operate through the Alameda Corridor (although the Corridor actually did not<br />
open until 2002). This was done to facilitate comparative analysis in simulations of year<br />
2000, year 2010 and year 2025 dispatching delays.<br />
Future Traffic Levels<br />
In the first phase of the <strong>Inland</strong> <strong>Empire</strong> <strong>Main</strong> <strong>Line</strong> Rail <strong>Study</strong>, LAEDC estimated growth<br />
rates that apply to various types of freight traffic. 10 Applying LAEDC’s growth rates<br />
(specified below), the through freight train counts rise to 82 BNSF and 81 UP in Year<br />
2010, and to 121 BNSF and 117 UP in Year 2025.<br />
Zero growth rates were applied to certain carload trains providing local origination and<br />
termination services. Specifically, counts of the UP “Hauler” carload trains between West<br />
Colton Yard and City of Industry (Anaheim Hauler), between West Colton Yard and the<br />
Alameda Corridor (J Yard and Dolores Haulers), are held fixed. Similarly, counts of the<br />
BNSF carload trains between Barstow and the Alameda Corridor (Watson trains) also<br />
were held fixed.<br />
International intermodal traffic is assumed to undergo 80.6% growth over the period<br />
2000 – 2010 (6.09% per year), and a 77.3% growth over the period 2010-2025 (3.89%<br />
per year). Domestic intermodal traffic is assumed to undergo 28.0% growth over the<br />
period 2000-2010 (2.5% per year) and a 25.0% growth over the period 2010-2025 (1.5%<br />
per year).<br />
Unit oil, auto, white bulk, and coal movements, and all other carload traffic, are assumed<br />
to undergo a 16.1% growth over the period 2000 – 2010 (1.5% per year), and 16.1%<br />
growth over the period 2010-2025 (1.0% per year).<br />
10 Los Angeles Economic Development Corporation, Los Angeles – <strong>Inland</strong> <strong>Empire</strong> <strong>Railroad</strong> <strong>Main</strong> <strong>Line</strong><br />
Advanced Planning <strong>Study</strong>, Prepared for the Southern California Association of Governments, Contract<br />
number 01-077, Work element number 014302, October 1, 2002.<br />
32
UP<br />
Train type 2000 2010 2025<br />
6,000’ Dom. Intermodal, East Yard – Indio (via Montclair) 2.0 2.6 3.2<br />
8,000’ Dom. Intermodal, East Yard – Barstow (via Montclair) 2.0 2.6 3.2<br />
Unit auto, East Yard – Indio (flex. routing, via Montclair in 2000) 0.8 0.9 1.1<br />
Carload, East Yard – Barstow (via Montclair) 4.0 4.6 5.4<br />
Carload, East Yard – Barstow (flex, via Montclair in 2000) 3.2 3.7 4.3<br />
Unit coal, Alameda Corr. – Barstow (flex, via Montclair in 2000) 4.8 5.6 6.5<br />
Unit white bulk, Ala. Corr. – Barstow (flex, via Montclair in 2000) 0.6 0.7 0.8<br />
8,000’ Intermod., Ala. Corr. – Bars. (flex, via Montclair in 2000) 7.6 13.7 24.3<br />
6,000’ Intermod., Ala. Corr. – Indio (flex, via Alhambra in 2000) 10.0 18.1 32.1<br />
6,000’ Intermod., Ala. Corr. – Indio (flex, via Montclair in 2000) 5.6 10.1 17.9<br />
Unit auto, Alameda Corridor – Indio (flex, via Montclair in 2000) 0.6 0.7 0.8<br />
Carload, Ala. Corr. – West Colton (flex, via Alhambra in 2000) 4.0 4.0 4.0<br />
6,000’ Dom. Intermodal, LATC – Indio (via Alhambra) 4.0 5.1 6.4<br />
Carload, Glendale <strong>Line</strong> – West Colton Yard (via Alhambra) 3.4 3.9 4.6<br />
Carload, City of Industry – West Colton Yard 2.0 2.0 2.0<br />
Subtotal, UP LATC – West Colton plus<br />
UP East Yard – Mira Loma 1<br />
33<br />
54.6 78.3 116.6<br />
Carload, West Colton Yard – Indio 15.0 17.4 20.2<br />
Unit auto, Mira Loma – Indio (via Riverside) 4.0 4.6 5.4<br />
Subtotal, UP West Colton – Colton Crossing plus<br />
UP Mira Loma – Colton Crossing 2<br />
Trains using UP Colton Connection 3<br />
Subtotal, UP Yuma <strong>Line</strong> 4<br />
64.2 90.4 131.6<br />
13.0 18.9 28.4<br />
42.0 59.5 87.1<br />
Unit oil, Alameda Corridor – Glendale <strong>Line</strong> 4.0 4.6 5.4<br />
Unit white bulk, Alameda Corridor – Glendale <strong>Line</strong> 0.4 0.5 0.5<br />
Subtotal, Metrolink East Bank <strong>Line</strong> 5<br />
24.0 27.2 42.0<br />
Carload, West Colton Yard – Hiland 6.5 7.5 8.8<br />
Subtotal, UP Palmdale <strong>Line</strong> 6.5 7.5 8.8<br />
Notes: 1. Sum of preceding trains. 2. Sum of preceding trains less trains whose eastern terminal is West<br />
Colton. 3. Sum of Indio trains via Montclair. 4. Sum of all Indio trains. 5. Sum of Alameda Corridor trains<br />
via Alhambra or via Glendale <strong>Line</strong>.
BNSF<br />
Train type 2000 2010 2025<br />
Carload, Alameda Corridor – Barstow (BNSF) 2.0 2.0 2.0<br />
Unit coal, Alameda Corridor – Barstow (BNSF) 1.0 1.2 1.3<br />
8,000’ Intermodal, Alameda Corridor - Barstow (BNSF) 11.0 19.9 35.2<br />
6,000’ Intermodal, Alameda Corridor – Bartow (BNSF) 11.0 19.9 35.2<br />
Unit auto, Alameda Corridor – Barstow (BNSF) 2.0 2.3 2.7<br />
6,000’ Dom. intermodal, Hobart Yard – Barstow (BNSF) 18.0 23.0 28.8<br />
Carload, Hobart Yard – Barstow (BNSF) 3.0 3.5 4.0<br />
Unit auto, Hobart Yard – Barstow (BNSF) 2.0 2.3 2.7<br />
Carload, Atwood – Barstow (BNSF) 3.0 3.5 4.0<br />
Unit white bulk, Atwood – Barstow (BNSF) 2.0 2.3 2.7<br />
Unit auto, Atwood – Barstow (BNSF) 2.0 2.3 2.7<br />
Subtotal, BNSF Atwood – Colton Crossing 57.0 82.2 121.3<br />
Subtotal, Alameda Corridor (UP & BNSF) 64.6 103.3 168.7<br />
Additional Through Train Movements<br />
The previous phase of the <strong>Inland</strong> <strong>Empire</strong> Rail <strong>Study</strong> did not encompass trackage between<br />
Colton Crossing and Barstow nor between Colton Crossing and Indio. Because no UP<br />
through freight trains originate or terminate at points between Colton and Indio, UP<br />
traffic counts developed in the previous phase remain applicable for the extended study<br />
area. However, there exist a number of BNSF through freight trains operating between<br />
Barstow and San Bernardino that originate or terminate at San Bernardino. Counts of<br />
these trains were excluded from the previous phase but are included in the analysis<br />
reported herein. Assumed peak-day counts for these movements are as follows:<br />
Carload, San Bernardino – Barstow (BNSF) 2.0 2.0 2.0<br />
Unit auto, San Bernardino – Barstow (BNSF) 2.0 2.3 3.7<br />
6,000’ Intermodal, San Bernardino – Barstow (BNSF) 4.0 5.1 6.4<br />
Subtotal, BNSF Cajon <strong>Line</strong> (UP & BNSF) 87.2 122.5 177.9<br />
Subtotal, UP Palmdale <strong>Line</strong> 6.5 7.5 8.8<br />
Subtotal, UP Yuma <strong>Line</strong> 42.0 59.5 87.1<br />
34
Validation of Freight Train Forecasts<br />
BNSF provided the consultant with actual daily train counts on the BNSF Cajon <strong>Line</strong> for<br />
the 63-day period March 22 – May 23, 2004, inclusive. Figures 7 and 8 display frequency<br />
distributions for UP and BNSF through freight trains on this line. (Light pusher engine<br />
movements are excluded.) As may be seen, UP averaged 20 trains per day and its 90 th<br />
percentile was about 24 trains per day. BNSF averaged 71 trains per day and its 90 th<br />
percentile was about 78 trains per day. This gives a total of 91 trains per average day and<br />
102 freight trains per peak day. Figure 9 displays the frequency distribution for total<br />
through freight trains on the BNSF Cajon <strong>Line</strong>. This figure shows 91 freight trains per<br />
average day and 100 freight trains per peak day. (The 90 th percentile count is moderated<br />
slightly from the sum of BNSF and UP peak-day counts because peak days for the two<br />
railroads do not always occur on the same day of the week.)<br />
Cum Frequency<br />
1<br />
0.9<br />
0.8<br />
0.7<br />
0.6<br />
0.5<br />
0.4<br />
0.3<br />
0.2<br />
0.1<br />
0<br />
Figure 7. UP Train Counts on BNSF Cajon <strong>Line</strong> -<br />
Spring, 2004<br />
10 11 12 13 14 15 16 17 18 19 20 21 22 23 24 25 26 27<br />
No. of trains<br />
35
Cum Frequency<br />
Cum Frequency<br />
1<br />
0.9<br />
0.8<br />
0.7<br />
0.6<br />
0.5<br />
0.4<br />
0.3<br />
0.2<br />
0.1<br />
0<br />
1<br />
0.9<br />
0.8<br />
0.7<br />
0.6<br />
0.5<br />
0.4<br />
0.3<br />
0.2<br />
0.1<br />
0<br />
Figure 8. BNSF Train Counts on BNSF Cajon <strong>Line</strong> -<br />
Spring, 2004<br />
58 59 60 61 62 63 64 65 66 67 68 69 70 71 72 73 74 75 76 77 78 79 80 81 82 83<br />
No. of Trains<br />
Figure 9. Total Through Freight Train Counts,<br />
BNSF Cajon <strong>Line</strong> - Spring, 2004<br />
83 84 85 86 87 88 89 90 91 92 93 94 95 96 97 98 99 100 101 102 103 104 105<br />
No. of Trains<br />
36
Applying the LAEDC growth rates to the Base Year (2000) train counts, we calculated<br />
the expected numbers of train movements per peak day over Cajon Pass four years later<br />
(i.e., 2004). These are summarized in Table 9. As may be seen, total forecast train counts<br />
track reasonably closely with the actual train counts. We remark, however, that the mix of<br />
freight trains is different than it was in 2000. While actual unit auto and carload train<br />
movements are very close to their forecasts, unit bulk train movements have declined<br />
rather than increased, domestic intermodal has grown faster than forecast, and<br />
international intermodal has grown slower than forecast. 11 Also, railroad market shares<br />
have evolved. BNSF intermodal has grown faster than forecast, while UP intermodal has<br />
grown more slowly. On the other hand, UP auto traffic has grown faster than forecast,<br />
while BNSF has grown more slowly.<br />
Table 9. Comparison of Peak-Day Forecast and Actual Through Freight Train<br />
Movements, BNSF Cajon <strong>Line</strong><br />
Year 2000 Year 2004 Year 2004<br />
(Base Year) Forecast Actual<br />
UP 22.2 25.2 24<br />
BNSF 65.0 74.3 78<br />
Total 87.2 99.5 100<br />
Note: Peak-day is defined by the 90 th percentile of daily train movements. Year 2004 actual figures are 90 th<br />
percentiles for the period March 22 – May 23, 2004.<br />
Because the forecasted total train count is accurate, we believe the forecasts discussed<br />
above are suitable for planning track capacity in 2010 and 2025, and so they have been<br />
adopted for the track capacity analysis reported herein.<br />
Future Intermodal Terminals<br />
The rapid growth in Southern California of value-added processing, warehousing and<br />
transloading of imported goods has strained the capacity of existing rail intermodal<br />
terminals in the study area. There is limited or no space available for expansion of the<br />
terminals in San Bernardino (BNSF), City of Industry (UP), East Yard (UP), LATC (UP),<br />
and Hobart (BNSF). This has prompted several proposals for new terminals. Suitable<br />
locations are scarce, and no concrete proposals for new terminals in the <strong>Inland</strong> <strong>Empire</strong><br />
acceptable to all stakeholders are known to the consultant as of this writing. However,<br />
prospects seem better for shifting marine traffic now handled at Hobart to a new terminal<br />
11 This disparity in domestic and international intermodal train growth rates reflects a nomenclature<br />
inadequacy rather than a decline in import-export trade. For the purposes of this study, we define an<br />
international intermodal train as one hauling primarily double-stacked marine containers. A domestic<br />
intermodal train hauls primarily trailers and/or double-stacked domestic containers (which have a much<br />
larger cubic capacity than marine containers). Imported goods are increasingly transloaded into larger<br />
domestic containers. As a result, a substantial fraction of imported goods are hauled by “domestic”<br />
intermodal trains.<br />
37
proposed near the Port of Los Angeles, which would open up more terminal capacity at<br />
Hobart for handling domestic containers.<br />
Alternative UP Routings<br />
As discussed above, Union Pacific has two routes between downtown Los Angeles and<br />
Colton Crossing (the Alhambra <strong>Line</strong> and the San Gabriel <strong>Line</strong>). In Year 2000, total<br />
freight train movements were divided about 40% Alhambra <strong>Line</strong> and 60% San Gabriel<br />
<strong>Line</strong>. Similar percentages are assumed in 2010 and 2025 under the Status Quo<br />
Alternative. While some freight movements must use one route or the other (because of<br />
the location of terminals), many others are flexible. The preferred allocation of trains to<br />
routes is a function of available track capacity, other traffic on the routes (especially<br />
passenger movements) and congestion at on-line freight terminals. Thus the actual<br />
allocation could vary compared to the scenarios studied here.<br />
A related case of flexibility concerns UP trains operating between downtown Los<br />
Angeles and Barstow. Such trains operate over the San Gabriel <strong>Line</strong> and then can<br />
exercise trackage rights over BNSF from West Riverside to Barstow. Alternatively, they<br />
can be operated over the Alhambra <strong>Line</strong> to West Colton and then via the Palmdale <strong>Line</strong>,<br />
gaining access to the BNSF Cajon <strong>Line</strong> for furtherance to Barstow at either Keenbrook or<br />
Silverwood. In Year 2000, nearly all such UP trains operated via Riverside, and the 2010<br />
and 2025 Status Quo scenarios assume continued predominance of such a routing.<br />
However, the actual allocation from day to day may vary according to conditions and<br />
congestion on the alternative lines.<br />
Looking at the UP more broadly, the railroad has two routes from Southern California to<br />
Chicago: one via Barstow, Las Vegas, Salt Lake City and Omaha (the so-called Overland<br />
Route); the other via Indio, El Paso and Kansas City (the so-called Sunset and Golden<br />
State Route). As in the above case, some freight movements must use one route or the<br />
other (because of the location of terminals), but many others are flexible. The route via El<br />
Paso is shorter to Chicago, but its capacity is limited. The actual allocation of trains to<br />
transcontinental routes is a function of available track capacity, other traffic on the routes<br />
and balancing crew workloads. In Year 2000, total UP freight train movements were<br />
divided about 66% via Indio and 33% via Barstow. Similar percentages are assumed in<br />
our 2010 and 2025 forecasts.<br />
In 2004 UP announced a long-term program to expand capacity of its line between<br />
Colton and El Paso (the Sunset Route). Because of this program or for other reasons, it is<br />
conceivable that the allocation of UP trains to route could vary from the scenarios studied<br />
here.<br />
38
4. Passenger Traffic Levels<br />
On following pages are projected passenger train frequencies on various rail lines within<br />
the study area. These projections were obtained directly from the operating agencies by<br />
the consultant. In the previous phase of the study, the consultant interviewed engineering<br />
and planning staff from Metrolink (Mr. M. E. McGinley and Ms. J. Capelle) on 6/11/01<br />
and planning staff from Amtrak on 6/18/01 (Mr. D. E. Johnson) to obtain these inputs.<br />
Year 2000 train counts on the following pages are the actual year 2001 service<br />
frequencies.<br />
Metrolink provided planned service levels for the next three decades on their various<br />
lines. The first-decade level has been used as a 2010 forecast; the second-decade level<br />
has been used as a 2020 forecast; and a level mid-way between second- and third-decade<br />
levels has been used as a 2025 forecast.<br />
Amtrak provided their Twenty-Year Improvement Plan for California. The “Near-Term”<br />
service levels were taken as the 2010 forecast, and the “Vision” service levels were taken<br />
as the 2020 forecast. Mr. D. E. Johnson, Planning Director for Amtrak West, provided<br />
specific 2010 and 2025 forecasts for new passenger train services to Las Vegas and Palm<br />
Springs passing through the study area. He confirmed that service levels on other lines<br />
could be assumed to be the same in 2025 as the “Vision” level of their plan.<br />
An overall summary of the specific passenger train counts detailed on following pages is<br />
provided in Table 10.<br />
Table 10. Peak-Day Passenger Train Counts by <strong>Railroad</strong> <strong>Line</strong><br />
RR <strong>Line</strong> 2000 2010 2020 2025<br />
BNSF <strong>Line</strong>, Hobart – Fullerton Jct. 46 76 96 106<br />
BNSF <strong>Line</strong>, Fullerton Jct. - Atwood 5 20 30 34<br />
BNSF <strong>Line</strong>, Atwood - Riverside 15 38 54 62<br />
BNSF/UP <strong>Line</strong>, Riverside – San Bernardino 11 24 32 36<br />
BNSF/UP <strong>Line</strong>, San Bernardino – Barstow 2 6 8 8<br />
UP San Gabriel <strong>Line</strong> 12 22 30 36<br />
UP Alhambra <strong>Line</strong> (east of El Monte only) 2 4 8 8<br />
UP Yuma <strong>Line</strong>, Colton – Garnet (Palm Springs) 2 4 8 8<br />
UP Yuma <strong>Line</strong>, Garnet - Indio 2 2 2 2<br />
Metrolink San Bernardino <strong>Line</strong>, crossing at grade<br />
of the Metrolink East Bank <strong>Line</strong> (UP freight<br />
30 42 50 50<br />
route) at Pasadena Jct.<br />
Metrolink San Bernardino <strong>Line</strong>, crossing at grade<br />
of BNSF <strong>Main</strong> 4 at San Bernardino<br />
39<br />
30 42 50 50
Passenger trains – Year 2000<br />
1. Amtrak Sunset Limited (one train each way three days per week)<br />
LAUPT – [Pasadena Jct.] via Metrolink, crossing UP freight corridor at Pasadena Jct.<br />
[Pasadena Jct.] – [El Monte] via Metrolink San Bernardino <strong>Line</strong> (out of study area)<br />
[El Monte] – Pomona – Indio via UP Alhambra and Yuma <strong>Line</strong>s<br />
2. Amtrak Southwest Limited (one train each way daily)<br />
LAUPT-[Hobart] via Metrolink (out of study area)<br />
[Hobart] – Fullerton – Barstow via BNSF<br />
3. Amtrak Pacific Surfliners (eleven trains each way daily)<br />
LAUPT-[Hobart] via Metrolink (out of study area)<br />
[Hobart]-Fullerton-[Fullerton Jct.] en route San Diego via BNSF<br />
4. Metrolink San Bernardino <strong>Line</strong> (fifteen trains each way, ten in peak)<br />
LAUPT – [Pasadena Jct.] via Metrolink, crossing UP freight corridor at Pasadena Jct.<br />
[Pasadena Jct.] – San Bernardino via Metrolink San Bernardino <strong>Line</strong> (out of study area),<br />
also crossing BNSF <strong>Main</strong> 4 at San Bernardino<br />
5. Metrolink Riverside <strong>Line</strong> (six trains each way, five in peak)<br />
LAUPT – [Pasadena Jct.] via Metrolink (out of study area)<br />
[Pasadena Jct.] – [Soto St. Jct.] via Metrolink<br />
[Soto St. Jct.]-Montebello-Industry-Pomona-East Ontario-Pedley-Riverside via UP San<br />
Gabriel <strong>Line</strong><br />
6. Metrolink Orange County <strong>Line</strong> (nine trains southward per day, six in peak, and ten<br />
trains northward per day, eight in peak)<br />
LAUPT – [Hobart] via Metrolink (out of study area)<br />
[Hobart]-Commerce-Norwalk-Fullerton-[Fullerton Jct.] via BNSF<br />
7. Metrolink <strong>Inland</strong> <strong>Empire</strong> – Orange County <strong>Line</strong> (six trains each way per day, five in<br />
peak)<br />
San Bernardino – Riverside via BNSF (four out of six trains southward and five out of six<br />
trains northward)<br />
Riverside-La Sierra-West Corona-[Atwood] en route Irvine via BNSF<br />
8. Metrolink Riverside-Fullerton-Los Angeles (two trains southward and one train<br />
northward per day, all off-peak)<br />
Riverside-La Sierra-West Corona-Fullerton-Norwalk-Commerce-[Hobart] via BNSF<br />
[Hobart]-LAUPT via Metrolink (out of study area)<br />
Re-cap of Year 2000 peak-day passenger trains by railroad line:<br />
BNSF Hobart – Fullerton Jct.: 46<br />
40
BNSF Fullerton Jct. – Atwood: 5<br />
BNSF Atwood – Riverside: 16<br />
BNSF/UP Riverside – San Bernardino: 11, plus 30 crossing <strong>Main</strong> 4 at San Bernardino<br />
BNSF/UP San Bernardino – Barstow: 2<br />
UP San Gabriel <strong>Line</strong>: 12<br />
UP Alhambra <strong>Line</strong>: 2, plus 30 crossing main tracks at Pasadena Jct.<br />
UP Yuma <strong>Line</strong>: 2<br />
Passenger Trains – Year 2010<br />
1. Amtrak Sunset Limited (one train each way three days per week)<br />
LAUPT – [Pasadena Jct.] via Metrolink, crossing UP freight corridor at Pasadena Jct.<br />
[Pasadena Jct.] – [El Monte] via Metrolink San Bernardino <strong>Line</strong> (out of study area)<br />
[El Monte] – Pomona – Indio via UP Alhambra and Yuma <strong>Line</strong>s<br />
2. Amtrak Southwest Limited (one train each way daily)<br />
LAUPT-[Hobart] via Metrolink (out of study area)<br />
[Hobart] – Fullerton – Barstow via BNSF<br />
3. Amtrak Pacific Surfliners (sixteen trains each way daily; leave terminals hourly 6am-<br />
10pm)<br />
LAUPT-[Hobart] via Metrolink (out of study area)<br />
[Hobart]-Fullerton-[Fullerton Jct.] en route San Diego via BNSF<br />
4. Metrolink San Bernardino <strong>Line</strong> (twenty-two trains each way, thirteen in peak)<br />
LAUPT – [Pasadena Jct.] via Metrolink, crossing UP freight corridor at Pasadena Jct.<br />
[Pasadena Jct.] – San Bernardino via Metrolink San Bernardino <strong>Line</strong> (out of study area),<br />
also crossing BNSF <strong>Main</strong> 4 in San Bernardino<br />
5. Metrolink Riverside <strong>Line</strong> (ten trains each way, eight in peak)<br />
LAUPT – [Pasadena Jct.] via Metrolink (out of study area)<br />
[Pasadena Jct.] – [Soto St. Jct.] via Metrolink<br />
[Soto St. Jct.]-Montebello-Industry-Pomona-East Ontario-Pedley-Riverside via UP San<br />
Gabriel <strong>Line</strong><br />
6. Metrolink Orange County <strong>Line</strong> (twelve trains each way per day, ten in peak)<br />
LAUPT – [Hobart] via Metrolink (out of study area)<br />
[Hobart]-Commerce-Norwalk-Fullerton-[Fullerton Jct.] via BNSF<br />
7. Metrolink <strong>Inland</strong> <strong>Empire</strong> – Orange County <strong>Line</strong> (nine trains each way per day, six in<br />
peak)<br />
San Bernardino – Riverside from/to San Bernardino via BNSF<br />
Riverside-La Sierra-West Corona-[Atwood] en route Irvine via BNSF<br />
41
8. Metrolink Riverside-Fullerton-Los Angeles (eight trains each way per day, five in<br />
peak)<br />
Riverside-La Sierra-West Corona-Fullerton-Norwalk-Commerce-[Hobart] via BNSF<br />
[Hobart]-LAUPT via Metrolink (out of study area)<br />
9. Amtrak Las Vegas Holiday Special via Pomona (one train each way per day)<br />
LAUPT – [Pasadena Jct.] via Metrolink (out of study area)<br />
[Pasadena Jct.] – [Soto St. Jct.] via Metrolink<br />
[Soto St. Jct.]-Pomona-Riverside via UP San Gabriel <strong>Line</strong><br />
Riverside – Barstow via BNSF<br />
10. Amtrak Las Vegas Holiday Special via Fullerton (one train each way per day)<br />
LAUPT – [Hobart] via Metrolink (out of study area)<br />
[Hobart] – Fullerton – Riverside – Barstow via BNSF<br />
11. Amtrak Palm Springs Holiday Special (one train each way per day)<br />
LAUPT – [Pasadena Jct.] via Metrolink, crossing UP freight corridor at Pasadena Jct.<br />
[Pasadena Jct.] – [El Monte] via Metrolink (out of study area)<br />
[El Monte] – Ontario – Palm Springs via UP Alhambra and Yuma <strong>Line</strong>s<br />
Re-cap of Year 2010 peak-day passenger trains by railroad line:<br />
BNSF Hobart – Fullerton Jct.: 76<br />
BNSF Fullerton Jct. – Atwood: 20<br />
BNSF Atwood – Riverside: 38<br />
BNSF/UP Riverside – San Bernardino: 24, plus 42 crossing <strong>Main</strong> 4 at San Bernardino<br />
BNSF/UP San Bernardino – Barstow: 6<br />
UP San Gabriel <strong>Line</strong>: 22<br />
UP Alhambra <strong>Line</strong>: 4, plus 42 crossing main tracks at Pasadena Jct.<br />
UP Yuma <strong>Line</strong>, Colton – Garnet: 4<br />
UP Yuma <strong>Line</strong>, Garnet – Indio: 2<br />
Passenger Trains – Year 2020<br />
1. Amtrak Sunset Limited (one train each way three days per week)<br />
LAUPT – [Pasadena Jct.] via Metrolink, crossing UP freight corridor at Pasadena Jct.<br />
[Pasadena Jct.] – [El Monte] via Metrolink San Bernardino <strong>Line</strong> (out of study area)<br />
[El Monte] – Pomona – Indio via UP Alhambra and Yuma <strong>Line</strong>s<br />
2. Amtrak Southwest Limited (one train each way daily)<br />
LAUPT-[Hobart] via Metrolink (out of study area)<br />
[Hobart] – Fullerton – Barstow via BNSF<br />
42
3. Amtrak Pacific Surfliners (sixteen trains each way daily; leave terminals hourly 6am-<br />
10pm)<br />
LAUPT-[Hobart] via Metrolink (out of study area)<br />
[Hobart]-Fullerton-[Fullerton Jct.] en route San Diego via BNSF<br />
4. Metrolink San Bernardino <strong>Line</strong> (twenty-five trains each way, sixteen in peak)<br />
LAUPT – [Pasadena Jct.] via Metrolink, crossing UP freight corridor at Pasadena Jct.<br />
[Pasadena Jct.] – San Bernardino via Metrolink San Bernardino <strong>Line</strong> (out of study area),<br />
also crossing BNSF <strong>Main</strong> 4 at San Bernardino<br />
5. Metrolink Riverside <strong>Line</strong> (fourteen trains each way, nine in peak)<br />
LAUPT – [Pasadena Jct.] via Metrolink (out of study area)<br />
[Pasadena Jct.] – [Soto St. Jct.] via Metrolink<br />
[Soto St. Jct.]-Montebello-Industry-Pomona-East Ontario-Pedley-Riverside via UP San<br />
Gabriel <strong>Line</strong><br />
6. Metrolink Orange County <strong>Line</strong> (seventeen trains each way per day, fourteen in peak)<br />
LAUPT – [Hobart] via Metrolink (out of study area)<br />
[Hobart]-Commerce-Norwalk-Fullerton-[Fullerton Jct.] via BNSF<br />
7. Metrolink <strong>Inland</strong> <strong>Empire</strong> – Orange County <strong>Line</strong> (twelve trains each way per day, seven<br />
in peak)<br />
San Bernardino – Riverside from/to San Bernardino via BNSF<br />
Riverside-La Sierra-West Corona-[Atwood] en route Irvine via BNSF<br />
8. Metrolink Riverside-Fullerton-Los Angeles (twelve trains each way per day, seven in<br />
peak)<br />
Riverside-La Sierra-West Corona-Fullerton-Norwalk-Commerce-[Hobart] via BNSF<br />
[Hobart]-LAUPT via Metrolink (out of study area)<br />
9. Amtrak Las Vegas Holiday Special via Pomona (one train each way per day)<br />
LAUPT – [Pasadena Jct.] via Metrolink (out of study area)<br />
[Pasadena Jct.] – [Soto St. Jct.] via Metrolink<br />
[Soto St. Jct.]-Pomona-Riverside via UP San Gabriel <strong>Line</strong><br />
Riverside – Barstow via BNSF<br />
10. Amtrak Las Vegas Holiday Special via Fullerton (two trains each way per day)*<br />
LAUPT – [Hobart] via Metrolink (out of study area)<br />
[Hobart] – Fullerton – Riverside – Barstow via BNSF<br />
11. Amtrak Palm Springs Holiday Special (three trains each way per day)*<br />
LAUPT – [Pasadena Jct.] via Metrolink, crossing UP freight corridor at Pasadena Jct.<br />
[Pasadena Jct.] – [El Monte] via Metrolink (out of study area)<br />
[El Monte] – Ontario – Palm Springs via UP Alhambra and Yuma <strong>Line</strong>s<br />
43
*Note: No Amtrak forecast for year 2020 is available. These train counts are from year<br />
2025 Amtrak forecast.<br />
Re-cap of Year 2020 peak-day passenger trains by railroad line:<br />
BNSF Hobart – Fullerton Jct.: 96<br />
BNSF Fullerton Jct. – Atwood: 30<br />
BNSF Atwood – Riverside: 54<br />
BNSF/UP Riverside – San Bernardino: 32, plus 50 crossing <strong>Main</strong> 4 at San Bernardino<br />
BNSF/UP San Bernardino – Barstow: 8<br />
UP San Gabriel <strong>Line</strong>: 30<br />
UP Alhambra <strong>Line</strong>: 8, plus 50 crossing main tracks at Pasadena Jct.<br />
UP Yuma <strong>Line</strong>, Colton – Garnet: 8<br />
UP Yuma <strong>Line</strong>, Garnet – Indio: 2<br />
Passenger Trains – Year 2025<br />
1. Amtrak Sunset Limited (one train each way three days per week)<br />
LAUPT – [Pasadena Jct.] via Metrolink, crossing UP freight corridor at Pasadena Jct.<br />
[Pasadena Jct.] – [El Monte] via Metrolink San Bernardino <strong>Line</strong> (out of study area)<br />
[El Monte] – Pomona – Indio via UP Alhambra and Yuma <strong>Line</strong>s<br />
2. Amtrak Southwest Limited (one train each way daily)<br />
LAUPT-[Hobart] via Metrolink (out of study area)<br />
[Hobart]-Fullerton – Barstow via BNSF<br />
3. Amtrak Pacific Surfliners (sixteen trains each way daily; leave terminals hourly 6am-<br />
10pm)<br />
LAUPT-[Hobart] via Metrolink (out of study area)<br />
[Hobart]-Fullerton-[Fullerton Jct.] en route San Diego via BNSF<br />
4. Metrolink San Bernardino <strong>Line</strong> (twenty-five trains each way, sixteen in peak)<br />
LAUPT – [Pasadena Jct.] via Metrolink, crossing UP freight corridor at Pasadena Jct.<br />
[Pasadena Jct.] – San Bernardino via Metrolink San Bernardino <strong>Line</strong> (out of study area),<br />
also crossing BNSF <strong>Main</strong> 4 at San Bernardino<br />
5. Metrolink Riverside <strong>Line</strong> (seventeen trains each way, eleven in peak)<br />
LAUPT – [Pasadena Jct.] via Metrolink (out of study area)<br />
[Pasadena Jct.] – [Soto St. Jct.] via Metrolink<br />
[Soto St. Jct.]-Montebello-Industry-Pomona-East Ontario-Pedley-Riverside via UP San<br />
Gabriel <strong>Line</strong><br />
6. Metrolink Orange County <strong>Line</strong> (twenty trains each way per day, sixteen in peak)<br />
LAUPT – [Hobart] via Metrolink (out of study area)<br />
[Hobart]-Commerce-Norwalk-Fullerton-[Fullerton Jct.] via BNSF<br />
44
7. Metrolink <strong>Inland</strong> <strong>Empire</strong> – Orange County <strong>Line</strong> (fourteen trains each way per day,<br />
eight in peak)<br />
San Bernardino – Riverside via BNSF<br />
Riverside-La Sierra-West Corona-[Atwood] en route Irvine via BNSF<br />
8. Metrolink Riverside-Fullerton-Los Angeles (fourteen trains each way per day, eight in<br />
peak)<br />
Riverside-La Sierra-West Corona-Fullerton-Norwalk-Commerce-[Hobart] via BNSF<br />
[Hobart]-LAUPT via Metrolink (out of study area)<br />
9. Amtrak Las Vegas Holiday Special via Pomona (one train each way per day)<br />
LAUPT – [Pasadena Jct.] via Metrolink (out of study area)<br />
[Pasadena Jct.] – [Soto St. Jct.] via Metrolink<br />
[Soto St. Jct.]-Pomona-Riverside via UP San Gabriel <strong>Line</strong><br />
Riverside – Barstow via BNSF<br />
10. Amtrak Las Vegas Holiday Special via Fullerton (two trains each way per day)<br />
LAUPT – [Hobart] via Metrolink (out of study area)<br />
[Hobart] – Fullerton – Riverside – Barstow via BNSF<br />
11. Amtrak Palm Springs Holiday Special (three trains each way per day)<br />
LAUPT – [Pasadena Jct.] via Metrolink, crossing UP freight corridor at Pasadena Jct.<br />
[Pasadena Jct.] – [El Monte] via Metrolink (out of study area)<br />
[El Monte] – Ontario – Palm Springs via UP Alhambra and Yuma <strong>Line</strong>s<br />
Re-cap of year 2025 passenger trains by railroad line:<br />
BNSF Hobart – Fullerton Jct.: 106<br />
BNSF Fullerton Jct. – Atwood: 34<br />
BNSF Atwood – Riverside: 62<br />
BNSF Riverside – San Bernardino: 36, plus 50 crossing <strong>Main</strong> 4 at San Bernardino<br />
BNSF San Bernardino – Barstow: 8<br />
UP San Gabriel <strong>Line</strong>: 36<br />
UP Alhambra <strong>Line</strong>: 8, plus 50 crossing main tracks at Pasadena Jct.<br />
UP Yuma <strong>Line</strong>, Colton – Garnet: 8<br />
UP Yuma <strong>Line</strong>, Garnet – Indio: 2<br />
Validation of Passenger Train Forecasts Against Year 2004 Movements<br />
Current (2004) Metrolink and Amtrak schedules were retrieved by the consultant. These<br />
are compared to actual Year 2000 and to forecast Year 2010 movements in Table 11.<br />
45
Table 11. Comparison of Peak-Day Passenger Train Counts<br />
Train Route Year<br />
2000 2004 2010<br />
Metrolink<br />
Covina - Los Angeles 30(20) 34(20) 44(26)<br />
San Bernardino – Covina 30(20) 30(20) 40(26)<br />
San Bernardino – Riverside 9(4) 9(4) 18(12)<br />
Riverside – Atwood 15(10) 21(16) 34(22)<br />
Atwood – Fullerton 3(0) 9(6) 16(10)<br />
Fullerton – Los Angeles 22(14) 28(23) 40(30)<br />
Riverside – Pomona – Los Angeles 12(10) 12(10) 20(16)<br />
Amtrak<br />
Fullerton – Los Angeles 22 23 32<br />
El Monte – Indio 2 2 4<br />
Los Angeles – Fullerton – Barstow 2 2 4<br />
Los Angeles – Pomona – Barstow 0 0 2<br />
Note: Figures in parentheses for Metrolink trains are train counts during peak hours. Figures for years 2000<br />
and 2004 are actual movements, figures for 2010 are forecasts.<br />
As may be seen, actual train counts for Year 2004 are generally consistent with the<br />
forecasted growth towards Year 2010 levels. For this reason, we used the forecasts<br />
discussed above in planning track capacity in 2010 and 2025 scenarios.<br />
Recapitulation of Traffic Forecasts<br />
A recapitulation of peak-day train movements for selected line segments is provided in<br />
Table 12. Further detail, providing counts for all line segments in the study area, is<br />
provided in Tables B-1 through B-12 in Appendix B.<br />
46
Table 12. Total Through Train Movements per Peak Day by <strong>Line</strong> Segment<br />
<strong>Line</strong> Segment Train type 2000 2010 2025<br />
BNSF Hobart – Fullerton Jct. Freight 50.0 74.1 111.9<br />
Psgr 46 96 106<br />
Total 96.0 170.1 207.9<br />
BNSF Fullerton Jct., - Atwood Freight 50.0 74.1 111.9<br />
Psgr 5 20 34<br />
Total 55.0 94.1 145.9<br />
BNSF Atwood – West Riverside Freight 57 82.2 121.3<br />
Psgr 16 38 62<br />
Total 73.0 120.2 183.3<br />
West Riverside – Colton UP Freight 35.2 49.8 72.9<br />
BNSF Freight 57.0 82.2 121.3<br />
Psgr 11 24 36<br />
Total 103.2 156.0 230.2<br />
Colton Crossing BNSF <strong>Line</strong> 90.2 137.1 201.8<br />
UP Yuma <strong>Line</strong> 31.0 44.6 64.7<br />
Total 121.2 181.7 266.5<br />
Colton – San Bernardino UP Freight 22.2 30.9 44.5<br />
BNSF Freight 57.0 82.2 121.3<br />
Psgr 11 24 36<br />
Total 68.0 106.2 157.3<br />
<strong>Line</strong>s over Cajon Pass Freight 93.7 130.0 186.7<br />
(including BNSF/UP Cajon <strong>Line</strong> and Psgr 2 6 8<br />
UP Palmdale <strong>Line</strong>) Total 95.7 136.0 194.7<br />
UP Mira Loma – W. Riverside plus Freight 64.2 90.4 126.2<br />
UP West Colton – Colton Psgr 14 26 44<br />
Total 78.2 116.4 170.2<br />
UP Yuma <strong>Line</strong> Freight 42.0 59.5 87.1<br />
Psgr 2 4 8<br />
Total 44.0 63.5 95.1<br />
47
Discussion of Traffic Levels<br />
The 2010 and 2025 train counts are very large and unprecedented in western U.S.<br />
railroading history. For the moment, suppose we take fifty trains per day per track as a<br />
very rough metric of track capacity. This metric is within reason for multiple-main-track<br />
territory where all trains move at comparable speeds. Where there is great disparity in<br />
speeds, such as on mountain grades, capacity may be much less. Over short stretches<br />
where all trains move at the same speed without switching, capacity could be more.<br />
Given this metric, in 2025 the BNSF <strong>Line</strong> would require four main tracks Hobart to<br />
Fullerton (vs. two or three now), three main tracks Fullerton to Atwood (vs. two now),<br />
four main tracks Atwood to Riverside (vs. two or three now), and five main tracks<br />
Riverside to Colton (vs. two or three now). Colton Crossing clearly would need to be<br />
grade-separated. On UP <strong>Line</strong>s between Los Angeles and Riverside/Colton, there would<br />
need to be a total of four main tracks (vs. two or three now). Over Cajon Pass there would<br />
need to be at least four main tracks (vs. three now). The UP’s Colton – Indio <strong>Line</strong> would<br />
need to have two main tracks over the entire distance (vs. one or two now).<br />
Thus it is obvious that large capital outlays for substantial infrastructure improvements<br />
are required to accommodate these forecasts. Specific plans for these improvements are<br />
developed below.<br />
Capacity Planning Strategy<br />
Rigorously speaking, there is not a fixed capacity figure appropriate for any given rail<br />
line. Average dispatching delays increase whenever more trains are added to a line. Each<br />
increment in delay reduces the quality of service and increases the cost of operating the<br />
rail line; passenger schedules and freight delivery schedules must be slowed down and<br />
more rolling stock is required per unit traffic. Figure 10 illustrates the general trade-off<br />
between transit time and traffic level. The trade-off is worse, i.e., the transit times rise<br />
more sharply, when the line handles a mix of trains that travel at different speeds (e.g.,<br />
freight and passenger).<br />
Discrete-event simulation of railroad traffic is used in this study to examine possible<br />
upgrades to the rail lines in order to handle the rising freight and passenger volumes. The<br />
general analytical strategy taken in this study is to first simulate the Year 2000 Base Case<br />
and take note of the simulated average transit times for BNSF and UP through freight<br />
trains. Next, we devise promising track capacity improvements and test them in iterative<br />
simulations of 2010 and 2025 traffic scenarios. This process continues until we identify<br />
for each scenario a program of track capacity improvements that provides simulated<br />
average transit times close to Year 2000 levels. In this way, we plan track capacity just<br />
sufficient to offer rail freight services comparable to that offered in the Year 2000 Base<br />
Case.<br />
48
Average<br />
Transit<br />
Time<br />
Figure 10<br />
Rail <strong>Line</strong> Capacity:<br />
The Trade-Off Between Train Volume and Delay<br />
49<br />
Number of trains per day
5. Routing Alternatives<br />
Three routing alternatives to the Status Quo are formulated and analyzed in this report.<br />
The motivation for consideration of these alternatives stems from the following factors:<br />
• The UP Palmdale <strong>Line</strong> is relatively underutilized, whereas the BNSF <strong>Line</strong><br />
through Riverside, San Bernardino and over Cajon Pass is heavily utilized. By<br />
2025, it will be impossible to achieve Year 2000 transit times unless a significant<br />
fraction of UP Barstow trains are routed via the UP Palmdale <strong>Line</strong>, West Colton<br />
and the UP Alhambra <strong>Line</strong>. Moreover, integrating the UP Palmdale <strong>Line</strong> to be<br />
flexibly dispatched as if it were another BNSF track on the south slope of Cajon<br />
Pass, would significantly reduce track capacity expenditures needed to<br />
accommodate 2010 and 2025 traffic levels.<br />
• Routing trains via the UP San Gabriel <strong>Line</strong> involves use of trackage rights over<br />
the BNSF <strong>Line</strong> between Colton Crossing and West Riverside. This is the most<br />
heavily utilized line segment in the Los Angeles Basin. Expansion of the capacity<br />
of this segment to accommodate 2025 traffic levels is relatively difficult and<br />
expensive under the Status Quo alternative, requiring a fourth main track plus<br />
flying junctions to enter and exit BNSF tracks. Expansion of capacity of the UP<br />
Alhambra <strong>Line</strong> between West Colton and Pomona is more practical and less<br />
costly.<br />
• Shifting UP trains operating between Cajon Pass and Pomona off the BNSF <strong>Line</strong><br />
and the UP San Gabriel <strong>Line</strong> and onto the UP Palmdale and UP Alhambra <strong>Line</strong>s<br />
reduces conflicts between Metrolink commuter trains and UP freight operations,<br />
thereby reducing track capacity expenditures needed to accommodate 2010 and<br />
2025 traffic levels.<br />
• Shifting UP trains operating between Cajon Pass and Pomona off the BNSF and<br />
UP San Gabriel <strong>Line</strong>s and onto the UP Palmdale and UP Alhambra <strong>Line</strong>s reduces<br />
total population exposure to through train movements and total vehicular delays at<br />
grade crossings.<br />
All three alternatives to the Status Quo have identical train counts on the BNSF <strong>Line</strong> and<br />
on UP <strong>Line</strong>s east of Pomona. As shown in Table 13, these alternatives reduce the through<br />
train counts in downtown San Bernardino and downtown Riverside by approximately<br />
22% and 31%, respectively.<br />
Table 13<br />
Forecasted Peak-Day Through Freight Train Counts<br />
in Downtown Riverside and Downtown San Bernardino<br />
Riverside San Bernardino<br />
2010 2025 2010 2025<br />
Status Quo 132 194 123 178<br />
Alternatives 1 or 2 91 132 96 139<br />
Delta 41 62 27 39<br />
50
The three alternatives all concentrate about 88% of UP through train movements via<br />
West Colton versus only 12% via the UP San Gabriel <strong>Line</strong> between West Riverside and<br />
Pomona. The three alternatives to the Status Quo differ only in the routing of UP through<br />
train movements west of Pomona, summarized as follows:<br />
• Alternative 1a: About 85% of UP through train movements between Pomona and<br />
downtown Los Angeles points are routed via the UP San Gabriel <strong>Line</strong>. Only UP<br />
through freight trains utilizing the City of Industry or LATC terminals, plus UP<br />
freight trains operating to/from the Glendale <strong>Line</strong>, are routed via the UP<br />
Alhambra <strong>Line</strong> west of Pomona.<br />
• Alternative 1b: Same as Alternative 1a, but with the additional feature that<br />
Metrolink Riverside – Pomona – Los Angeles trains are re-routed via the UP<br />
Alhambra <strong>Line</strong> west of Pomona. The station stop at City of Industry would be resited<br />
on the Alhambra line, the station stop at Montebello would be closed (with<br />
passengers re-directed to the Commerce station on the BSNF <strong>Line</strong>), and a new<br />
station stop at Alhambra would be introduced. Under this alternative, Metrolink<br />
operations and heavy UP through train movements are largely disjoint, thereby<br />
reducing track capacity requirements.<br />
• Alternative 2: About 85% of UP through train movements between Pomona and<br />
downtown Los Angeles points are routed via the UP Alhambra <strong>Line</strong>. Metrolink<br />
operations continue via the UP San Gabriel <strong>Line</strong>. Only UP through freight trains<br />
utilizing the East Los Angeles terminal are routed via the UP San Gabriel <strong>Line</strong><br />
west of Pomona. Under this alternative, Metrolink operations and heavy UP<br />
through train movements are largely disjoint, except they share trackage along the<br />
Metrolink East Bank <strong>Line</strong>.<br />
The rationale for formulating and analyzing these three alternatives is as follows. It is<br />
clear that future UP freight traffic needs to be concentrated on the UP Alhambra <strong>Line</strong><br />
west of Pomona, in order to avoid the congestion on the Riverside – Colton Crossing<br />
segment that would result from overlaying UP traffic on top of heavy BNSF and<br />
Metrolink traffic. But it is not clear a priori how UP freight traffic should be routed west<br />
of Pomona. Alternatives 1a and 1b test concentration of UP freight traffic on the UP San<br />
Gabriel <strong>Line</strong>, while Alternative 2 tests concentration of UP freight traffic on the UP<br />
Alhambra <strong>Line</strong>. Alternative 1b tests the additional feature of re-routing Metrolink trains<br />
onto the Alhambra <strong>Line</strong> (west of Pomona) and away from heavy UP freight traffic.<br />
We now turn to the results of evaluating the alternatives using simulation.<br />
51
6. Train Dispatching Simulations<br />
Discrete-event simulation of railroad traffic is used to examine possible upgrades to the<br />
rail lines in order to handle the rising freight and passenger volumes. The general<br />
analytical strategy is to find the average delay per train in Year 2000 and devise<br />
promising track capacity improvements that maintain Year 2000 levels of delay in train<br />
dispatching simulations of 2010 and 2025 traffic levels.<br />
The Simulation Model<br />
Since 1983, Leachman and Associates has progressively developed simulation<br />
methodology to model the complicated rail networks in the Los Angeles-<strong>Inland</strong> <strong>Empire</strong><br />
trade corridor region. The simulation model is based on a discrete event methodology<br />
and developed using the Awesim© Simulation Language. 12 Physical resources modeled<br />
include rail junctions for crossover movement in a rail network, and physical track<br />
divided into track segments with uniform speed limits. The simulation network<br />
comprises of nodes and arcs, where nodes consist of one or more contiguous segments,<br />
and arcs represent movement from one node to another.<br />
Simulation statistics are compiled for 100 consecutive peak-days (which effectively<br />
“stress-tests” the improvements). Freight train departure times are randomized, while<br />
passenger train departure times are fixed. The model incorporates assumptions about train<br />
lengths and tonnages, acceleration and deceleration rates, track configurations and speed<br />
limits. The model also incorporates traffic control logic to resolve conflicts and thereby<br />
“dispatch” the railroad. Technical discussions of the traffic control logic and simulation<br />
methodology are summarized below. Further details are available in the open academic<br />
literature. 13<br />
Figure 11 provides a simplified overview of the rail dispatch model. Data inputs to the<br />
model include Train Schedule, Train Type, and Track Network. Train Schedule with<br />
origin station generates Departing Train Entities and is stored in the Event Calendar.<br />
Event Calendar interacts with the Central Dispatching Algorithm to decide on moving the<br />
train entity or on stopping the train. Moving the train will seize resources and generate<br />
next events, while stopping the train will cause the train to decelerate, stop, and be placed<br />
in a queue to wait. Finally, in case the arrival train terminates, information is recorded.<br />
The primary simulation outputs are the average delay and flow times of the trains.<br />
12<br />
Pritsker, A. B. and J. J. O’Reilly. 1999. Simulation with Visual SLAM and Awesim. John Wiley & Sons,<br />
Inc., New York.<br />
13<br />
Lu, Quan, Maged Dessouky, and Robert C. Leachman, “Modeling Train Movements Through Complex<br />
Rail Networks,” ACM Transactions on Modeling and Computer Simulation, Vol. 14, No. 1, January, 2004,<br />
p. 48-75. See also Dessouky, Maged, Robert C. Leachman and Quan Lu, “Using Simulation Modeling to<br />
Assess Rail Track Infrastructure in Densely Trafficked Metropolitan Areas,” Proceedings of the2002<br />
Winter Simulation Conference, E. Yücesan, C.-H. Chen, J. L. Snowdon, and J. M. Charnes, eds., 2002.<br />
52
Generate<br />
Departing<br />
Trains<br />
SIMULATION<br />
LOGIC<br />
INPUT<br />
Train Schedule Train Type Track Network<br />
Event<br />
Calendar<br />
Seize Resources<br />
Generate Events<br />
Terminate<br />
Train Entity<br />
OUTPUT<br />
Delay Flow Time<br />
53<br />
Central Dispatch<br />
Algorithm<br />
Stopped<br />
Train Queue<br />
Figure 11. Overview of Rail Dispatch Model Structure<br />
Input data to the model includes the rail network (line segments, junction and crossover<br />
switches, speed limits), train types (priority, origin, destination, length, maximum speed,<br />
acceleration and deceleration rates), and train schedules (origin and destination, train<br />
type, starting times). For the purposes of the current study, maximum speed and<br />
acceleration rates were made a function of line gradient in order to accurately simulate<br />
operation of heavy trains over mountain grades. Values for maximum speed and<br />
acceleration rate as a function of gradient were pre-computed based on train tonnage;<br />
locomotive horsepower, weight and tractive effort; and standard assumptions for rolling<br />
resistance and locomotive efficiency and adhesion.<br />
The simulation logic is briefly summarized as follows. An event calendar is maintained<br />
within the simulation containing events for trains ready to depart and train arrivals at<br />
junctions and end points of track segments. A central dispatching algorithm is called to<br />
process each event and decide whether the train should continue moving (i.e., take<br />
possession of additional track resources) or begin to decelerate to a stop. A train is<br />
simulated to begin decelerating to a stop either when the necessary track segment or<br />
junction resource has been awarded to some other movement, or a continuation of its<br />
movement would cause a deadlock. If the train is stopped, the train is placed in a queue<br />
to wait for an available track resource.<br />
If the central dispatching algorithm decides to move the train, the algorithm determines<br />
the following:
• The distance the train travels within the awarded resource<br />
• The time of travel over the resource, accounting for change-of-speed points<br />
• The successor track resources that could be possessed by the train<br />
The algorithm assigns the track resources to the train and schedules “resource-free”<br />
events that release track resources the train no longer needs during this movement.<br />
Ultimately, an event is scheduled to represent the time the train finishes movement.<br />
When a resource-free event is processed, all the trains in the stopped train queue are<br />
checked to see whether this released resource can trigger a movement for one of the<br />
stopped trains. The triggered train in the queue is the one with the highest priority and<br />
longest waiting time. Its movement will be determined by the central dispatching<br />
algorithm in the same manner as described above.<br />
Finally, if the event is a train arrival at its destination terminal, statistics concerning the<br />
train movement will be recorded and the train will be terminated from the system. When<br />
the simulation finishes, the primary outputs are the average delay and transit time by train<br />
type and origin-destination pair.<br />
Input and Output Files<br />
Input data for the train dispatching simulation model is categorized in terms of the Track<br />
Network, Train Types, and Train Schedules.<br />
The Track Network data (i.e., the physical rail network) is represented in terms of two<br />
types of resources: track segments and junction switches. Each segment of track has a<br />
specified uniform speed limit and extends between other segments with different speed<br />
limits or junctions in the network for crossover or diverging movement. Parallel tracks<br />
are distinct segments. Maximum speed over junction switches also is specified in this<br />
data.<br />
The Train Type data specifies the train length, maximum speed, and acceleration and<br />
deceleration rates for each train type. The latter three parameters are a function of the line<br />
gradient.<br />
The Train Schedule data specifies the train type, origin and destination for each train ID.<br />
It also specifies inter-arrival times (i.e., times between consecutive departure times for<br />
the same train ID). Inter-arrival times may be fixed as a schedule or they may be<br />
randomized by the simulation according to user-specified probability distributions.<br />
Year 2000, Year 2010 and Year 2025 Train Schedule data for all main line rail<br />
movements west and south of Colton Crossing were developed by Leachman and<br />
54
Associates in the previous phase of this study. 14 These include all movements over main<br />
line tracks from the south end of the Alameda Corridor to Colton Crossing via Union<br />
Pacific and Burlington Northern Santa Fe main lines. Metrolink lines utilized by UP and<br />
BNSF main line trains also are included. In the current phase, Train Schedule data was<br />
expanded to include the movements over the UP Yuma <strong>Line</strong> (Colton – Indio), the BNSF<br />
Cajon <strong>Line</strong> (Colton – Barstow), and the UP Palmdale <strong>Line</strong> (West Colton – Hiland).<br />
Output data from the simulation consists of text files of statistical summaries by train ID<br />
and by location. The summary by train ID specifies the following information for each<br />
train ID:<br />
• Transit time: mean, standard deviation, minimum, maximum<br />
• Delay: mean, standard deviation, minimum, maximum<br />
• Mileage: mean, standard deviation, minimum, maximum (Note: mileage may<br />
vary when there are alternative routes through the rail network for a given train<br />
ID)<br />
• Size of queue of waiting trains at origin station: average, maximum<br />
• Wait time at origin station: average over trains that waited<br />
• Probability train waits at origin station (i.e., fraction of simulated trains that<br />
were delayed from starting)<br />
The summary by location (“node”) specifies the following information for each location<br />
and train ID:<br />
• Probability train is stopped at that location (i.e., fraction of simulated trains that<br />
were stopped at that location)<br />
• Average wait time when train was stopped<br />
Model Validation<br />
The Leachman and Associates’ train dispatching model was validated in an earlier<br />
study. 15 A brief summary of that validation is provided here.<br />
A data set of 25 actual Burlington Northern Santa Fe double-stack container train<br />
movements operating over a thirty-day period (mid-April to mid-May, 2003) was<br />
obtained from the railroad. These trains originated at the Maersk/APM on-dock rail<br />
terminal in the Port of Los Angeles and were destined to eastern points, primarily<br />
Chicago. The data set provided by BNSF included passing times at selected points for the<br />
14 Los Angeles Economic Development Corporation, Los Angeles – <strong>Inland</strong> <strong>Empire</strong> <strong>Railroad</strong> <strong>Main</strong> <strong>Line</strong><br />
Advanced Planning <strong>Study</strong>, prepared for Southern California Association of Governments, Contract number<br />
01-077, Work element number 014302, October 1, 2002.<br />
15 Mallon, Larry G., J. D. Hwang and R. C. Leachman, Optimization of Military and Commercial Goods<br />
Movement Through Southern California Using Information Technology, prepared for US Navy Space and<br />
Naval Warfare Systems Center, Center for Commercial Deployment of Transportation Technologies, Cal-<br />
State University at Long Beach, Sept., 2003.<br />
55
actual Maersk container train movements. The southernmost passing point is CP<br />
Sepulveda (1.3 miles north of Long Beach Jct., the junction between lines to Terminal<br />
Island and the Port of Long Beach proper); the northernmost passing point is Colton<br />
Crossing.<br />
Operation of these same 25 trains was simulated between Long Beach Jct. and Colton<br />
Crossing, juxtaposed with all the Year 2000 traffic levels described in earlier sections of<br />
this report. Simulation results for the 25 Maersk stack trains between CP Sepulveda and<br />
Colton Crossing were compared to statistics on the actual transit times between these<br />
points in order to validate the simulation model.<br />
Undertaking a train-by-train review of the passing times of the actual train movements,<br />
two anomalies were discovered. Train #19 experienced a three-hour delay between<br />
Hobart and Pico Rivera, and train #22 experienced a 2 hour, 45 minute delay between<br />
Riverside and Colton. Evidently there were disruptions (e.g., trackside detector alarms,<br />
pickups or setouts, change of locomotives, etc.) impacting these two train movements.<br />
Such disruptions are not included in our simulations. Thus, we did the comparison<br />
without these two trains.<br />
Considering the 23 BNSF trains (trains #19 and 22 removed), statistics on<br />
actual and simulated transit times CP Sepulveda - Colton Crossing are displayed in Table<br />
14. As may be seen, the statistics on actual and simulated trains are remarkably close.<br />
The very minor differences are well within the levels of expected variability for 23 train<br />
movements.<br />
Table 14. Actual vs. Simulated Transit Times, CP Sepulveda – Colton Crossing<br />
Statistic Actual Simulated<br />
Mean 3 hours, 26 minutes 3 hours, 28 minutes<br />
Standard deviation 0 hour, 43 minutes 0 hours, 51 minutes<br />
Minimum 2 hours, 10 minutes 2 hours, 27 minutes<br />
Maximum 4 hours, 53 minutes 5 hours, 01 minutes<br />
Source: Mallon, Larry G., J. D. Hwang and R. C. Leachman, Optimization of Military<br />
and Commercial Goods Movement Through Southern California Using Information<br />
Technology, prepared for US Navy Space and Naval Warfare Systems Center, Center for<br />
Commercial Deployment of Transportation Technologies, Cal-State University at Long<br />
Beach, Sept., 2003.<br />
56
7. Simulation Results<br />
In the previous phase of this study, track capacity was analyzed from downtown Los<br />
Angeles to and including Colton Crossing. 16 <strong>Line</strong>s south and west of Colton Crossing<br />
were thoroughly simulated in the previous phase of this study, so detailed simulation<br />
results for those lines will not be repeated here. A summary of the required track capacity<br />
improvements south and west of Colton Crossing is provided in Section 8 of this report.<br />
In the current phase, we focus on track capacity from Colton Crossing northward to<br />
Barstow and eastward to Indio. In this section the detailed simulation results for lines east<br />
and north of Colton Crossing are integrated with results west of Colton Crossing to<br />
provide complete track capacity plans for the study area.<br />
UP Yuma <strong>Line</strong><br />
Results for the UP Yuma <strong>Line</strong> are presented in Table 15. These results apply to all<br />
routing alternatives. Shown are average minutes of delay and average transit times<br />
between Colton Crossing and West Indio for freight and passenger trains in various<br />
scenarios. Delay times account for periods when trains are stopped as well as extra transit<br />
time when trains move more slowly than their free-running speed.<br />
In the Base Case (Year 2000), there are 42 trains per peak day utilizing about 30 miles of<br />
single-track-CTC line between Fingal and Indio and 40 miles of two-main-track-CTC<br />
line between Colton and Fingal. This results in average delays of 48 minutes per<br />
passenger train and 35 minutes per passenger train. With concerted effort in traffic<br />
control, the delay per passenger train could be reduced somewhat, but at the expense of<br />
much greater delays to freight trains. In any case, delays on this line are significant, and<br />
the lack of capacity is a barrier to improving rail service. This is already recognized. As<br />
noted above, extension of the second main track over the 8.5 miles eastward from Fingal<br />
to Garnet was completed in early 2005.<br />
In 2010, to sustain the Base Case level of delays, it will be necessary to extend the twomain-track<br />
capacity eastward another 9 miles through Garnet (location of the Palm<br />
Springs passenger station) to Salvia (absorbing the existing passing track at that point).<br />
This extension will put all of the grades on the line in excess of 1.2% within two-maintrack<br />
territory.<br />
In 2025, to sustain the Base Case level of delays, it will be necessary to have two main<br />
tracks in operation over the entire line to Indio. Once this is done, train delays will be<br />
significantly less than the Base Case, even when accommodating a doubling of traffic on<br />
the line.<br />
16 Los Angeles Economic Development Corporation, Los Angeles – <strong>Inland</strong> <strong>Empire</strong> <strong>Railroad</strong> <strong>Main</strong> <strong>Line</strong><br />
Advanced Planning <strong>Study</strong>, prepared for Southern California Association of Governments, Contract number<br />
01-077, Work element number 014302, October 1, 2002.<br />
57
It should be noted that even in the case the entire line is equipped with two main tracks,<br />
passenger trains still experience an average of about 25 minutes of delay compared to<br />
their free-running times between Colton and Palm Springs. This is because of the slow<br />
speeds of freight trains climbing and descending the mountain grades Colton – Apex and<br />
Garnet – Apex. If faster passenger schedules than this are desired for the proposed<br />
passenger services to Palm Springs, a third main track over the mountain grades will be<br />
required.<br />
Table 15. Simulation Results, Colton Crossing – Indio<br />
(Results applicable to all routing alternatives)<br />
Year Trackage Configuration Average<br />
Delay<br />
(mins)<br />
2000 Two main tracks,<br />
Colton – Fingal<br />
2010 Two main tracks,<br />
Colton – Fingal<br />
2010 Two main tracks,<br />
Colton – Garnet<br />
2010 Two main tracks,<br />
Colton – Salvia<br />
2025 Two main tracks,<br />
Colton – Salvia<br />
2025 Two main tracks,<br />
Colton – Rimlon<br />
2025 Two main tracks,<br />
Colton – 1000 Palms<br />
2025 Two main tracks,<br />
Colton – Myoma<br />
2025 Two main tracks,<br />
Colton – Indio<br />
58<br />
Freight Passenger<br />
Average<br />
Transit<br />
Time (mins)<br />
Average<br />
Delay<br />
(mins)<br />
Average<br />
Transit<br />
Time (mins)<br />
48.4 193.3 35.3 132.3<br />
63.5 208.9 66.1 163.2<br />
52.1 197.0 38.0 135.0<br />
47.5 193.5 21.3 118.2<br />
101.1 246.5 67.4 164.3<br />
82.4 228.6 36.0 134.0<br />
71.7 219.8 30.8 130.4<br />
53.5 203.1 24.8 126.7<br />
28.6 175.5 23.7 120.9<br />
Note: The Base Case and future scenarios with adequate track capacity are shown in bold<br />
face type. Other scenarios offer inadequate track capacity.<br />
BNSF Cajon <strong>Line</strong> and UP Palmdale <strong>Line</strong><br />
Results from simulating the rail main lines over Cajon Pass are presented in Tables 16, 17<br />
and 18. In the Base Case (Year 2000), freight trains to/from Barstow average 223 minutes<br />
in transit time between Colton Crossing and Valley Jct. (Barstow), while passenger trains<br />
on this line average about 193 minutes in transit. UP Palmdale <strong>Line</strong> trains average about<br />
one and one half hours on the West Colton – Hiland run. Not shown in the table are<br />
delays and transit times for Metrolink passenger trains between Colton Crossing and San
Bernardino. Delay times are less than a minute and transit times are 8-9 minutes for these<br />
trains in all scenarios, so these Metrolink operations are not at issue.<br />
Considering the minimum 30-minute spacing of southbound trains leaving Summit on the<br />
3%-gradient downhill track, there exists a capacity constraint of 48 westbound trains per<br />
day, i.e., 96 total trains per day. In 2004 and 2005, this count was reached or exceeded on<br />
many days, i.e., the BNSF Cajon <strong>Line</strong> is already operating at capacity. The only way<br />
current peak-day traffic volumes can be accommodated is by diverting some southbound<br />
UP trains over the Silverwood connection to use the UP Palmdale and UP Alhambra<br />
<strong>Line</strong>s (i.e., as in the alternatives to the Status Quo).<br />
Table 16. Simulation Results, Colton Crossing – Barstow and<br />
West Colton – Hiland, 2000 and 2010<br />
Barstow Hiland Barstow<br />
Freight Freight Passenger<br />
Year Trackage Configuration Avg. Avg. Avg.<br />
Transit Transit Transit<br />
Time Time Time<br />
(mins) (mins) (mins)<br />
2000 Base Case<br />
UP Palmdale <strong>Line</strong> separate, BNSF <strong>Line</strong> with<br />
2 main tracks Baseline – Barstow<br />
223.0 88.5 193.1<br />
2010 Status Quo<br />
UP Palmdale <strong>Line</strong> separate, BNSF <strong>Line</strong> with<br />
3 main tracks Baseline – Barstow<br />
239.9 90.7 191.2<br />
2010 Status Quo<br />
UP Palmdale <strong>Line</strong> separate, BNSF <strong>Line</strong> with<br />
4 main tracks San Bernardino – Summit, 3<br />
main tracks Summit - Barstow<br />
225.2 90.7 184.1<br />
2010 Alts. 1, 2<br />
Integration of UP Palmdale <strong>Line</strong> with BNSF<br />
<strong>Line</strong> Devore Rd. – Silverwood, BNSF <strong>Line</strong><br />
with 3 main tracks San Bernardino – Devore<br />
Rd. and Silverwood – Barstow, 2 main tracks<br />
Devore Rd. – Silverwood<br />
234.0 139.0 181.9<br />
2010 Alts. 1, 2<br />
Integration of UP Palmdale <strong>Line</strong> with BNSF<br />
<strong>Line</strong> Devore Rd. – Silverwood, BNSF <strong>Line</strong><br />
with 3 main tracks San Bernardino - Barstow<br />
(two 3% and one 2.2% track,<br />
Cajon – Summit)<br />
225.2 135.3 181.8<br />
59
Table 17. Simulation Results, Colton Crossing – Barstow and<br />
West Colton – Hiland, 2025<br />
Barstow Hiland Barstow<br />
Freight Freight Passenger<br />
Year Trackage Configuration Avg. Avg. Avg.<br />
Transit Transit Transit<br />
Time Time Time<br />
(mins) (mins) (mins)<br />
2025 Status Quo<br />
UP Palmdale <strong>Line</strong> separate, BNSF <strong>Line</strong> with<br />
4 main tracks San Bernardino - Barstow<br />
238.7 90.3 191.3<br />
2025 Status Quo<br />
UP Palmdale <strong>Line</strong> separate, BNSF <strong>Line</strong> with<br />
4 main tracks San Bernardino – Barstow,<br />
plus fifth main track Cajon – Summit (2.2%)<br />
237.7 90.3 182.6<br />
2025 Status Quo<br />
UP Palmdale <strong>Line</strong> separate, BNSF <strong>Line</strong> with<br />
4 main tracks San Bernardino – Barstow,<br />
plus fifth main track Cajon – Summit (2.2%)<br />
and Baseline – Devore Rd.<br />
232.9 90.3 181.9<br />
2025 Alts. 1, 2<br />
UP Palmdale <strong>Line</strong> with 2 main tracks West<br />
Colton - Devore Rd., integration of UP<br />
Palmdale <strong>Line</strong> with BNSF <strong>Line</strong> Devore Rd.<br />
– Silverwood, BNSF <strong>Line</strong> with 3 main tracks<br />
San Bernardino – Silverwood (one 2.2% and<br />
two 3%, Cajon – Summit), and 4 main<br />
tracks Silverwood – Barstow<br />
248.4 142.5 201.4<br />
2025 Alts. 1, 2<br />
UP Palmdale <strong>Line</strong> with 2 main tracks West<br />
Colton - Devore Rd., integration of UP<br />
Palmdale <strong>Line</strong> with BNSF <strong>Line</strong> Devore Rd.<br />
– Silverwood, BNSF <strong>Line</strong> with 3 main tracks<br />
San Bernardino – Cajon, and 4 main tracks<br />
Cajon – Barstow (two 2.2% and two 3%,<br />
Cajon – Summit)<br />
246.6 139.6 181.8<br />
2025 Alts. 1, 2<br />
UP Palmdale <strong>Line</strong> with 2 main tracks West<br />
Colton - Devore Rd., integration of UP<br />
Palmdale <strong>Line</strong> with BNSF <strong>Line</strong> Devore Rd.<br />
– Silverwood, BNSF <strong>Line</strong> with 3 main tracks<br />
San Bernardino – Devore Rd., and 4 main<br />
tracks Devore Rd. – Barstow (two 2.2% and<br />
two 3%, Cajon – Summit)<br />
242.0 139.1 181.6<br />
60
At a minimum, three main tracks accommodating BNSF and UP Barstow trains are<br />
required in 2010 and four main tracks are required in 2025. Considering both the UP<br />
Palmdale <strong>Line</strong> and the BNSF Cajon <strong>Line</strong>, three main tracks already exist between<br />
Keenbrook and Silverwood (two with a 2.2% grade and one with a 3% grade between<br />
Cajon and Silverwood), but these are not flexibly dispatched as a single rail line. At<br />
present, only UP trains to/from West Colton may use the UP Palmdale <strong>Line</strong> track. Under<br />
the Status Quo alternative, it is assumed the Palmdale <strong>Line</strong> remains exclusively for<br />
operation of UP freight trains. This means a new main track (2.2%) must be constructed<br />
along the BNSF <strong>Line</strong> Devore Rd. - Summit in 2010, and another main track (3%) must be<br />
constructed in 2025.<br />
On the other hand, in the simulations of 2010 and 2025 scenarios under Alternatives 1<br />
and 2, it has been assumed that the UP Palmdale <strong>Line</strong> and the BNSF Cajon <strong>Line</strong> may be<br />
flexibly dispatched as a single railroad line, whereby another connection would be<br />
constructed at Devore Road (Keenbrook) permitting northbound (uphill) trains on the<br />
BNSF Cajon <strong>Line</strong> to use (as an option) the UP Palmdale <strong>Line</strong> main track from<br />
Keenbrook to Silverwood. Capacity for Barstow trains basically equivalent to the Status<br />
Quo alternative as above is achieved with no new main tracks in 2010 between Devore<br />
Rd. and Silverwood, and with only one new main track (3%) in 2025.<br />
Even for these ambitious improvements, average transit times for Barstow freight trains<br />
are above the Year 2000 levels. Compared to Year 2000, Barstow freight trains<br />
experience an average of 10 – 20 more minutes of transit time using three main tracks in<br />
2010, and 15 – 25 more minutes of transit time using four main tracks in 2025. So the<br />
addition of more trackage was tested in simulations.<br />
In 2010, under both the Status Quo and the alternatives to the Status Quo, configurations<br />
offering four main tracks between Devore Road and Silverwood usable by all Barstow<br />
freight trains are just adequate to allow Barstow freight trains to match Year 2000 transit<br />
times (Table 17). We therefore identify these sets of improvements as the ones that are<br />
required for Year 2010.<br />
For Year 2025, we first simulated the addition of a fifth main track between Cajon and<br />
Silverwood (3%) for use by all Barstow freight trains. As can be seen in Table 17, this<br />
improvement only reduced simulated average transit times by about a minute (although<br />
Amtrak transit times improved about 10 minutes over the Base Case). Next, we tested<br />
extension of this fifth track between Cajon and Devore Road. As can be seen, average<br />
transit times for Barstow freights still ended up 15 – 23 minutes above Year 2000 levels.<br />
To totally restore Year 2000 transit times in the 2025 scenario, even more track would be<br />
required. We therefore tested extending the 5 th main track between Devore Road and San<br />
Bernardino (4 th main track in the case of Alternatives 1 and 2). As shown in Table 18, for<br />
the alternatives to the Status Quo, this configuration eliminates the excess over Year 2000<br />
average transit time for Barstow freights, even bettering it by about 4 minutes. But the<br />
Status Quo transit times are still about 7 minutes worse. This is evidently because the<br />
61
Status Quo attempts to accommodate all Barstow trains on five tracks between<br />
Keenbrook and Colton, whereas the alternatives to the Status Quo spread these trains<br />
over six tracks (two on the Palmdale <strong>Line</strong> and four on the BNSF <strong>Line</strong>).<br />
Table 18. Additional Simulation Results, Colton Crossing – Barstow and<br />
West Colton – Hiland, 2025<br />
Barstow Hiland Barstow<br />
Freight Freight Passenger<br />
Year Trackage Configuration Avg. Avg. Avg.<br />
Transit Transit Transit<br />
Time Time Time<br />
(mins) (mins) (mins)<br />
2025 Status Quo<br />
UP Palmdale <strong>Line</strong> separate, BNSF <strong>Line</strong> with<br />
5 main tracks San Bernardino – Summit<br />
and four main tracks Summit - Barstow<br />
230.4 90.3 174.5<br />
2025 Alts. 1, 2<br />
UP Palmdale <strong>Line</strong> with 2 main tracks West<br />
Colton - Devore Rd., integration of UP<br />
Palmdale <strong>Line</strong> with BNSF <strong>Line</strong> Devore Rd.<br />
– Silverwood, BNSF <strong>Line</strong> with 4 main tracks<br />
San Bernardino – Silverwood (two 2.2% and<br />
two 3%, Cajon – Summit), and 4 main<br />
tracks Silverwood – Barstow<br />
219.0 140.3 181.3<br />
In the consultant’s judgment, the practicality of constructing a five-track BNSF <strong>Line</strong> San<br />
Bernardino – Summit is questionable, and a six-track line seems out of the question. In<br />
that sense, it is impossible for the Status Quo to sustain Year 2000 transit times under<br />
2025 traffic levels. To achieve this, a significant fraction of the Barstow freights must be<br />
routed via the Palmdale <strong>Line</strong>, as under the alternatives to the Status Quo.<br />
To carry out a reasonably fair comparison of alternatives, we shall assume in 2025<br />
comparable configurations for the alternatives offering average transit times 15 – 19<br />
minutes longer than the Year 2000 times, i.e., five main tracks Cajon – Summit (three<br />
2.2%, two 3%) and four main tracks Devore Road – Cajon. East of Summit, there would<br />
be four main tracks. West of Devore Road, there would be three main tracks on the BNSF<br />
<strong>Line</strong> and two on the UP Palmdale <strong>Line</strong> (Alternatives 1 and 2), or four on the BNSF <strong>Line</strong><br />
and one on the UP Palmdale <strong>Line</strong> (Status Quo alternative).<br />
As was the case for the UP Yuma <strong>Line</strong>, passenger trains are not able to achieve their freerunning<br />
transit times, due to the need to follow slow-moving freight trains operating on<br />
the same track over the steep mountain grades. In all three scenarios, simulated running<br />
times for passenger trains Colton Crossing – Barstow on this high-volume, mixed-traffic<br />
line average about 3 hours, 15 minutes, or about one hour longer than the free-running<br />
62
transit time. Shorter transit times for passenger trains would require the construction of a<br />
separate main track for passenger trains over the mountain grades San Bernardino –<br />
Summit – Victorville.<br />
63
8. Summary of Track Capacity Improvements<br />
Improvements Required West and South of Colton Crossing<br />
Table 19 summarizes the track capacity improvements required on the BNSF <strong>Line</strong> west<br />
and south of Colton Crossing, as determined in the previous phase of this study.<br />
(Increments in track capacity are highlighted in bold type.)<br />
Table 19. Summary of Required Track Capacity on BNSF <strong>Line</strong>,<br />
South and West of Colton Crossing<br />
(Figures express required numbers of main tracks.)<br />
Status Quo Alternatives 1 and 2<br />
<strong>Line</strong> Segment Existing 2010 2025 2010 2025<br />
in 2005<br />
BNSF <strong>Line</strong><br />
Hobart – Bandini 3 3 4 3 4<br />
Bandini – Basta 2 3 4 3 4<br />
Bandini – Fullerton Jct. 3 3 4 3 4<br />
Fullerton Jct. – Atwood 2 2 3 2 3<br />
Atwood – Esperanza 2 3 3 3 3<br />
Esperanza – Prado Dam 3 3 3 3 3<br />
Prado Dam – West Riverside 2 3 3 3 3<br />
West Riverside jct. with UP At At grade Flying At At<br />
grade<br />
jct. grade grade<br />
West Riverside – Highland 3 3 4 3 3<br />
Highland – Colton Crossing 2 3 4 3 3<br />
Colton Crossing At grade At grade Separated, At Separated<br />
with flying<br />
jct. to UP<br />
grade<br />
Note: A “flying junction” allows connecting movements to proceed without fouling the route of opposing<br />
through traffic, much like a freeway interchange.<br />
Table 20 summarizes the track capacity improvements required under the Status Quo on<br />
the UP <strong>Line</strong>s west of Colton Crossing, as determined in the previous phase of this study.<br />
As shown in the tables, under the Status Quo Alternative the BNSF <strong>Line</strong> must be<br />
expanded to 3 or 4 main tracks Hobart to Colton Crossing. The UP San Gabriel <strong>Line</strong><br />
must be expanded to 2 main tracks over its entire extent. The UP Alhambra <strong>Line</strong> must be<br />
expanded to 2 main tracks west of Pomona. Flying junctions are required at West<br />
Riverside and West Colton, and the Colton Crossing must be grade-separated.<br />
64
Table 20. Summary of Required Track Capacity on<br />
UP <strong>Line</strong>s West of Colton Crossing – Status Quo Alternative<br />
(Figures express required numbers of main tracks.)<br />
<strong>Line</strong> Segment<br />
UP San Gabriel <strong>Line</strong><br />
Existing in 2005 2010 2025<br />
West Riverside – Streeter 1 2 2<br />
Streeter – Arlington 2 2 2<br />
Arlington – Pedley 1 2 2<br />
Pedley – Bon View 2 2 2<br />
Bon View – Pomona 1 2 2<br />
Pomona – Roselawn 1 2 2<br />
Roselawn – Bartolo 2 2 2<br />
Bartolo – Pico Rivera 1 2 2<br />
Pico Rivera – Garfield Ave. 2 2 2<br />
Garfield Ave. – East Los Angeles 3 3 3<br />
East Los Angeles – Downey Road 2 2 2<br />
Downey Road – Soto St. Jct. 3 3 3<br />
Soto St. Jct. – Redondo<br />
UP Alhambra <strong>Line</strong><br />
2 2 2<br />
Colton Crossing – West Colton 2 2 2<br />
Jct. with Palmdale <strong>Line</strong><br />
Partial Partial Full<br />
at West Colton<br />
flying flying flying<br />
West Colton – Pomona 1 1 1<br />
Pomona route connections At-grade At-grade At-grade<br />
crossovers crossovers crossovers<br />
Pomona - Alhambra 1 1 2<br />
Alhambra – Yuma Jct. 2 2 2<br />
Yuma Jct. – Pasadena Jct. 1 1 1<br />
Metrolink crossing at Pasadena Jct. At grade At grade At grade<br />
Pasadena Jct. – Ninth St. 2 2 2<br />
Ninth St. - Redondo 1 1 1<br />
Note: A “flying junction” allows connecting movements to proceed without fouling the route of opposing<br />
through traffic, much like a freeway interchange.<br />
Five routing alternatives to the Status Quo were investigated west of Colton Crossing in<br />
the previous phase of this study. Three were found to be practical, identified in the<br />
previous phase of this study as Alternatives 1(a), 1(b) and 2. As explained in section 4 of<br />
this report, all three of these alternatives are identical east of Pomona. They minimize UP<br />
through freight trains over the UP San Gabriel <strong>Line</strong> between Colton Crossing and<br />
Pomona, thereby avoiding the need for expensive flying-junction route connections at<br />
Colton Crossing and West Riverside and also avoiding the need for a fourth main track<br />
on the BNSF between Colton Crossing and West Riverside. Table 21 summarizes the<br />
track capacity improvements between Pomona and Colton/Riverside for these<br />
alternatives. As may be seen, the alternatives require double-tracking of the UP Alhambra<br />
65
<strong>Line</strong> from West Colton to Pomona. In common with the Status Quo alternative, by 2025<br />
they require a full flying junction of the UP Alhambra and Palmdale <strong>Line</strong>s.<br />
Table 21.<br />
Summary of Required Track Capacity on UP <strong>Line</strong>s<br />
Colton and Riverside to Pomona for Alternatives to Status Quo Routing<br />
(Figures express required numbers of main tracks.)<br />
Existing in 2005 2010 2025<br />
UP San Gabriel <strong>Line</strong><br />
West Riverside – Streeter 1 1 1<br />
Streeter - Arlington 2 2 2<br />
Arlington - Pedley 1 1 1<br />
Pedley – Bon View 2 2 1<br />
Bon View - Pomona<br />
UP Alhambra <strong>Line</strong><br />
1 1 1<br />
Colton Crossing – West Colton 2 2 2<br />
Jct. with Palmdale <strong>Line</strong><br />
Partial Partial Full<br />
at West Colton<br />
flying flying flying<br />
West Colton – Pomona 1 2 2<br />
Pomona route connections At grade At grade Metrolink<br />
crossovers crossovers fly-over<br />
Note: A “flying junction” allows connecting movements to proceed without fouling the route of opposing<br />
through traffic, much like a freeway interchange. A “partial flying junction” partially eliminates conflicts<br />
between through and connecting movements. A “fly-over” is a grade-separated crossing of rail lines.<br />
Movements connecting between routes by using at-grade crossovers block through traffic.<br />
Because these three alternatives route UP freight traffic differently west of Pomona, their<br />
improvement plans are different between Pomona and downtown Los Angeles. Table 22<br />
summarizes these improvements. As may be seen, in 2025, Alternative 1a requires tripletracking<br />
of the UP San Gabriel <strong>Line</strong> west of Pomona. Alternative 2 requires doubletracking<br />
of the UP Alhambra <strong>Line</strong> west of Pomona, double-tracking of the connections to<br />
the Metrolink East Bank <strong>Line</strong>, triple-tracking of the Metrolink East Bank <strong>Line</strong> itself, and<br />
a separation of the Metrolink crossing at Pasadena Jct. Alternative 1(b) is more economic<br />
in terms of track capacity, with two tracks on the UP San Gabriel <strong>Line</strong> and one track on<br />
the UP Alhambra <strong>Line</strong> west of Pomona.<br />
Improvements Required East and North of Colton Crossing<br />
Tables 23 and 24 summarize track capacity improvements required east and north of<br />
Colton Crossing. On the UP Yuma <strong>Line</strong>, required improvements are common to all<br />
alternatives. The second main track must be progressively extended towards Indio.<br />
Completion as far as Salvia is required for Year 2010 traffic levels, and completion all<br />
the way to Indio is required for Year 2025 traffic levels. These levels of track capacity<br />
enable only relatively slow passenger train schedules of about two hours running time<br />
66
over the 50 miles between Colton and Palm Springs. This is due to the need to follow<br />
slow-moving freight trains up and down the mountain grades. If faster transit times are<br />
desired for passenger trains, a third main track will be required between Colton and Palm<br />
Springs.<br />
Table 22.<br />
Summary of Required Track Capacity on UP <strong>Line</strong>s West of Pomona<br />
For Alternatives to Status Quo Routing<br />
(Figures express required numbers of main tracks.)<br />
Existing<br />
in 2005 2010 2025<br />
Alt<br />
1a<br />
San Gabriel <strong>Line</strong><br />
Pomona – Roselawn 1 2 2 1 3 2 2<br />
Roselawn – Bartolo 2 2 2 2 3 2 2<br />
Bartolo – Pico Rivera 1 2 2 1 3 2 2<br />
Pico Rivera –<br />
Garfield Ave.<br />
2 2 2 2 3 2 2<br />
Garfield Ave. –<br />
East Los Angeles<br />
3 3 3 3 3 3 3<br />
East Los Angeles –<br />
Downey Road<br />
2 2 2 2 2 2 2<br />
Downey Road –<br />
Soto St. Jct.<br />
3 3 3 3 3 3 3<br />
Soto St. Jct. – Redondo<br />
Alhambra <strong>Line</strong><br />
2 2 2 2 2 2 2<br />
Pomona – Alhambra 1 1 1 2 1 1 2<br />
Alhambra – Yuma Jct. 2 2 2 2 2 2 2<br />
Yuma Jct. –<br />
Pasadena Jct.<br />
1 1 1 2 1 1 2<br />
Metrolink crossing at At At At At At At Fly-<br />
Pasadena Jct.<br />
grade grade grade grade grade grade over<br />
Pasadena Jct. –<br />
Ninth St.<br />
2 2 2 2 2 2 3<br />
Ninth St. – Redondo 1 1 1 2 1 1 2<br />
Note: A “fly-over” is a grade-separated crossing of another rail line.<br />
On the UP Palmdale <strong>Line</strong>, two main tracks are required in 2025 under the alternatives to<br />
the Status Quo. This is the result of re-routing all UP Barstow through freight trains via<br />
this line. Moreover, in both 2010 and 2025 under these alternatives, the Palmdale <strong>Line</strong><br />
becomes utilized by BNSF trains between route connections at Devore Road<br />
(Keenbrook) and Silverwood.<br />
67<br />
Alt<br />
1b<br />
Alt<br />
2<br />
Alt<br />
1a<br />
Alt<br />
1b<br />
Alt<br />
2
Table 23.<br />
Summary of Required Track Capacity<br />
on UP <strong>Line</strong>s North and East of Colton Crossing<br />
(Figures express required numbers of main tracks.)<br />
Status Quo Alts. 1 and 2<br />
Existing<br />
in 2005 2010 2025 2010 2025<br />
UP Yuma <strong>Line</strong><br />
Colton Crossing – Garnet 2 2 2 2 2<br />
Garnet – Salvia 1 2 2 2 2<br />
Salvia - Indio 1 1 2 1 2<br />
UP Palmdale <strong>Line</strong><br />
West Colton – Devore Rd. (Keenbrook) 1 1 1 1 2<br />
Devore Rd. (Keenbrook) – Hiland 1 1 1 1 1<br />
On the BNSF <strong>Line</strong>, the very-high traffic volumes will require a minimum of three main<br />
tracks in 2010 and four main tracks in 2025 (Table 24). To match Year 2000 transit<br />
times, an additional track will be needed over the most steeply-graded segment of the<br />
line. Between Devore Road (Keenbrook) and Silverwood, four tracks are required in<br />
2010 (two on a 2.2% grade, two on a 3% grade) and five tracks in 2025 (two on a 2.2%<br />
grade, three on a 3% grade).<br />
Considering the BNSF Cajon <strong>Line</strong> and the UP Palmdale <strong>Line</strong> collectively, there already<br />
exist three main tracks over Cajon Pass, two constructed to a 2.2% grade. Construction of<br />
a crossover at Devore Road (Keenbrook) and institutional agreements between UP and<br />
BNSF allowing BNSF trains to use the UP track could obviate the need to build an<br />
expensive duplicate 2.2%-gradient main track for the BNSF <strong>Line</strong> between Devore Road<br />
(Keenbrook) and Silverwood. Under the alternatives to the Status Quo, this scheme is<br />
proposed (Table 24). Moreover, UP Barstow trains are proposed to be re-routed via the<br />
UP Palmdale <strong>Line</strong> between West Colton and Devore Road (Keenbrook), thereby<br />
eliminating the need for a fourth track on the BNSF between San Bernardino and Devore<br />
Road (Keenbrook). However, as noted above, the UP Palmdale <strong>Line</strong> between West<br />
Colton and Devore Road (Keenbrook) must be double-tracked to smoothly accommodate<br />
the proposed concentration of UP traffic on this line (Table 24). Universal crossover<br />
connections at Devore Road (Keenbrook) also are required.<br />
68
Table 24.<br />
Summary of Required Track Capacity on BNSF <strong>Line</strong><br />
North of Colton Crossing<br />
(Figures express required numbers of main tracks. Percentages express track gradients.)<br />
BNSF <strong>Line</strong><br />
Colton Crossing –<br />
Rana<br />
Rana – San<br />
Bernardino<br />
San Bernardino –<br />
Verdemont<br />
Verdemont –<br />
Devore Road<br />
Devore Rd.<br />
(Keenbrook)<br />
connection<br />
Devore Road –<br />
Cajon<br />
Cajon –<br />
Silverwood<br />
Silverwood<br />
connection<br />
Silverwood –<br />
Summit<br />
Existing<br />
in 2005<br />
Status Quo Alts. 1 and 2<br />
2010 2025 2010 2025<br />
2 3 3 3 3<br />
4 4 4 4 4<br />
3 4 4 3 3<br />
2 4 4 3 3<br />
One<br />
conn.<br />
One<br />
conn.<br />
69<br />
One<br />
conn.<br />
Univ.<br />
conns.<br />
Univ.<br />
conns.<br />
2 4 4 3 4<br />
One<br />
2.2%,<br />
one 3%<br />
One<br />
conn.<br />
One<br />
2.2%,<br />
one 3%<br />
Two 2.2%,<br />
two 3%<br />
One<br />
conn.<br />
Two 2.2%,<br />
two 3%<br />
Two 2.2%,<br />
three 3%<br />
One<br />
conn.<br />
Two 2.2%,<br />
three 3%<br />
One 2.2%,<br />
two 3%<br />
One<br />
conn.<br />
Two 2.2%,<br />
two 3%<br />
One 2.2%,<br />
three 3%<br />
One<br />
conn.<br />
Two 2.2%,<br />
three 3%<br />
Summit – Barstow 2 3 4 3 4<br />
Note: “One connection” indicates only two out of four possible connecting movements are feasible.<br />
“Universal connections” indicates all four possible connecting movements are feasible.
9. Capital Costs for <strong>Main</strong> <strong>Line</strong> Rail Infrastructure<br />
Estimates of construction costs for the improvements listed in section 8 were developed<br />
as follows.<br />
Unit Cost Assumptions<br />
Year 2004 unit costs were developed by applying an inflation factor to Year 2001 unit<br />
costs for new railroad construction. 17 The inflation factor that was applied was based on<br />
the US Army Corps of Engineers Indices for years 2001, 2002, 2003 and 2004 applicable<br />
to road, rail and bridge construction projects. 18 That 2004/2001 factor is 1.08588. It<br />
should be noted, however, that the price of steel has risen sharply in the last year,<br />
meaning that 2005 prices for rail construction are probably higher than those reported for<br />
this study. Table 25 summarizes the unit cost assumptions for 2004.<br />
Table 25.<br />
Unit Cost Assumptions<br />
(All figures in 2004 dollars)<br />
Item Cost per track-mile<br />
For new main-line track:<br />
Roadbed $151,200<br />
Drainage $32,600<br />
Track $803,500<br />
Signals $1,085,900<br />
Utility relocation $542,900<br />
Right of way, east and north of Colton $128,500<br />
Right of way, west of Colton $2,717,400<br />
Subtotals:<br />
Cost per track-mile, east and north of Colton $2,744,600<br />
Cost per track-mile, west of Colton $5,333,500<br />
Exceptional items Unit cost<br />
Bridges $54,294 per track-foot<br />
Power-switch crossovers $407,200 each<br />
Exceptional earthmoving or property-taking case-by-case basis<br />
Separated crossings case-by-case basis<br />
Flying junctions case-by-case basis<br />
New Metrolink stations case-by-case basis<br />
17 Parsons Brinckerhoff, <strong>Inland</strong> <strong>Empire</strong> <strong>Main</strong>line Trade Corridor Cost Benefit <strong>Study</strong>, Order of Magnitude<br />
Cost for <strong>Railroad</strong> Infrastructure, Draft Report prepared for Southern California Association of<br />
Governments, Fall 2001.<br />
18 U.S. Army Corps of Engineers Cost Index, released September 24, 2004.<br />
70
As may be seen, basic main-line costs amount to about $2.7 million per mile east and<br />
north of Colton and $5.3 million per mile west of Colton. To these costs must be added<br />
the costs for exceptional items, including bridges, crossovers, separated crossings and<br />
junctions, and exceptional earthmoving or property-taking situations.<br />
Estimates for Case-by-Case Exceptional Items<br />
Costs for exceptional earthmoving, separated crossings flying junctions and new stations<br />
were estimated as follows. These are preliminary estimates based on sketches of the<br />
required track layouts and field reconnaissance of the geometry and other challenges<br />
involved. Preliminary engineering was not carried out.<br />
Separated Crossings<br />
Colton Crossing (all alternatives in 2025) - $90,000,000. Assumes UP Yuma <strong>Line</strong> is<br />
elevated over existing BNSF tracks. UP Yuma <strong>Line</strong> would have 1% approach grades in<br />
both directions. Costs for a flying-junction connection of the UP Yuma <strong>Line</strong> to the BNSF<br />
<strong>Line</strong> are not included in this figure but are separately tabulated under Flying Junctions<br />
below.<br />
Pasadena Jct. Metrolink Fly-over (Alternative 2 in 2025) - $40,000,000.<br />
Flying Junctions<br />
West Colton (Rancho) Full Flying Junction of UP Palmdale and Alhambra <strong>Line</strong>s and<br />
yard approaches (all alternatives in 2025) - $60,000,000<br />
Pomona Metrolink Fly-over and route connections (Alternatives 1a, 1b and 2 in 2025) -<br />
$40,000,000.<br />
Colton Crossing Flying Junction connection of UP Yuma <strong>Line</strong> to BNSF <strong>Line</strong> (Status Quo<br />
alternative in 2025) - $20,000,000 (as an add-on to the Colton Crossing separation)<br />
West Riverside Flying Junction connection of UP San Gabriel <strong>Line</strong> to BNSF <strong>Line</strong> (Status<br />
Quo alternative in 2025) - $30,000,000<br />
(Note: The above two flying junction connections work in concert, one for EB trains and<br />
one for WB trains.)<br />
Exceptional Earthmoving or Property-Taking<br />
BNSF <strong>Line</strong>, Cajon to Summit (one added 2.2% track and one added 3% track for the<br />
Status Quo alternative in 2010, one added 3% track for other alternatives in 2010, one<br />
more added 2.2% track for the Status Quo alternative in 2025, one added 2.2% track for<br />
71
other alternatives in 2025) - $40,000,000 per 3% track, $48,000,000 for first new 2.2%<br />
track, $40,000,000 for subsequent 2.2% tracks. Numerous deep cuts and high fills are<br />
required on this segment. Two tunnels on main 1 (the existing 2.2% track) would be daylighted<br />
when the first 2.2% track is added, requiring removal of a substantial quantity of<br />
overburden.<br />
BNSF <strong>Line</strong>, Keenbrook to Cajon (2 added tracks for the Status Quo alternative in 2010, 1<br />
added track for other alternatives in 2010) - $30,000,000 per track. Several deep cuts and<br />
high fills are required on this segment.<br />
UP San Gabriel <strong>Line</strong>, Streeter – West Riverside (Status Quo alternative in 2010) -<br />
$25,000,000. Excavation of the side of a large hill in West Riverside is required,<br />
involving the protection of nearby high-value residences and re-alignment to a sharper<br />
curve. Retaining walls on both sides of the track would be required.<br />
New Metrolink Stations<br />
Alternative 1(b) re-routes Metrolink Riverside trains west of Pomona to operate via the<br />
UP Alhambra <strong>Line</strong>. This necessitates a new station at City of Industry to replace the<br />
current station situated on the UP San Gabriel <strong>Line</strong>. It also necessitates closing the<br />
Montebello station (with passengers diverted to the Commerce station on the BNSF<br />
<strong>Line</strong>). To replace the lost stop, a new station stop at Alhambra is proposed. The costs for<br />
each of these new stations, including property acquisition and construction, are estimated<br />
as follows.<br />
City of Industry Station<br />
The cost for a parking space at ground level is $2,500 per space. (A vertical parking<br />
structure would be $12,000 per space, but ground-level parking is assumed here.) There<br />
are 100 parking spaces per acre. The existing City of Industry station currently<br />
experiences loadings of 1,000 people each work day, and parking is inadequate. It is the<br />
highest demand station on the system and has the fastest growth. Property acquisition<br />
would be about $800,000 per acre. To accommodate future growth, a 15-acre facility is<br />
assumed. The station stop would be a minimum of 745' feet in length (at $3000 per foot)<br />
to accommodate an 8-car train hauled by one locomotive. It is assumed that UP would<br />
want the station stop clear of the main track. Costs for additional track and signals are<br />
estimated to total $1 million.<br />
Re-capitulation:<br />
Property acquisition $12,000,000<br />
Parking site preparation 3,750,000<br />
Track and signal 1,000,000<br />
Station 2,235,000<br />
TOTAL $18,985,000 say $19,000,000.<br />
72
Alhambra Station<br />
It is believed that one acre would be sufficient for parking. Nearly all passengers<br />
detraining or entraining at Montebello are bused to or from City of Commerce work<br />
locations (the bus system connects to Metrolink). Therefore, the need for vehicle parking<br />
should be minimal.<br />
Re-capitulation:<br />
Property acquisition $1,000,000<br />
Parking site preparation 250,000<br />
Station shelter (at street level) 1,000,000<br />
Station overpass 1,500,000<br />
Loading strip (both tracks) 1,490,000<br />
Access from street level to<br />
#2 track 2,000,000<br />
Total $7,240,000 say, $7,200,000<br />
NOTE: Access to station platform along #1 track would be along right-of-way of<br />
abandoned industrial track corridor rising from trench to street level.<br />
Cost Estimation Procedure<br />
BNSF and UP track charts were consulted to obtain line segment distances, bridge<br />
locations and bridge lengths. Generally, when new main tracks were planned to be added,<br />
existing bridges were assumed to be replicated for the new tracks. Where power<br />
crossovers were located, additional crossovers were assumed to connect up the new track.<br />
Where single-track CTC territory was converted to two-main track territory, one set of<br />
universal power crossovers was assumed at each existing controlled siding location.<br />
Where new or improved route connections were proposed, crossovers enabling<br />
movement between all main tracks were assumed.<br />
Costs by <strong>Line</strong> Segment<br />
Table 26 provides a listing of the estimated capital costs broken out by routing<br />
alternative, line segment and year. Costs for improvements at connections and junctions<br />
between BNSF and UP <strong>Line</strong>s have been included under the BNSF <strong>Line</strong> segment<br />
amounts. Costs for the Pomona fly-over and connections have been included under the<br />
West Colton – Pomona segment of the UP Alhambra <strong>Line</strong>.<br />
73
Table 26.<br />
Summary of Estimated Rail Infrastructure by <strong>Line</strong> Segment<br />
(millions of 2004 dollars)<br />
<strong>Line</strong> Segment 2010 2025<br />
UP Yuma <strong>Line</strong><br />
Colton Crossing – Indio, all alternatives $24.1 $72.9<br />
UP Palmdale <strong>Line</strong><br />
West Colton – Devore Road, Status Quo $0.0 $0.0<br />
West Colton – Devore Road, Alternatives 1a, 1b, 2 $0.0 $160.9<br />
Devore Road – Hiland $0.0 $0.0<br />
BNSF <strong>Line</strong><br />
Barstow – Summit, all alternatives $142.8 $150.1<br />
Summit – San Bernardino, Status Quo $582.3 $190.6<br />
Summit – San Bernardino, Alternatives 1a, 1b, 2 $325.1 $198.6<br />
San Bernardino – West Riverside, Status Quo $63.8 $218.6<br />
San Bernardino – West Riverside, Alternatives 1a, 1b, 2 $63.8 $90.0<br />
West Riverside – Redondo, all alternatives $321.5 $312.7<br />
UP Alhambra <strong>Line</strong><br />
Colton Crossing – West Colton, all alternatives $0.0 $60.0<br />
West Colton – Pomona, Status Quo $0.0 $0.0<br />
West Colton – Pomona, Alternatives 1a, 1b, 2 $192.7 $40.0<br />
Pomona – Yuma Jct., Status Quo $0.0 $190.5<br />
Pomona – Yuma Jct., Alternative 2 $190.5 $0.0<br />
Pomona – Yuma Jct., Alternative 1a $0.0 $0.0<br />
Pomona – Yuma Jct., Alternatives 1b $26.2 $0.0<br />
Yuma Jct. – Redondo, Alternative 2 $8.1 $55.5<br />
Yuma Jct. – Redondo, Status Quo and Alternatives 1a, 1b $0.0 $0.0<br />
UP San Gabriel <strong>Line</strong><br />
West Riverside – Pomona, Status Quo $160.6 $0.0<br />
West Riverside – Pomona, Alternatives 1a, 1b, 2 $0.0 $0.0<br />
Pomona – Redondo, Status Quo $116.5 $0.0<br />
Pomona – Redondo, Alternative 1a $116.5 $307.9<br />
Pomona – Redondo, Alternative 1b $116.5 $0.0<br />
Pomona – Redondo, Alternative 2 $0.0 $116.5<br />
Total Costs by Alternative<br />
Table 27 summarizes the total capital costs by routing alternative.<br />
74
Table 27.<br />
Estimated Rail Infrastructure Costs by Routing Alternative<br />
(billions of 2004 dollars)<br />
Alternative 2010 2025 Total Total less improvements<br />
already completed<br />
or fully funded<br />
Status Quo $1.412 $1.195 $2.607 $2.354<br />
1a $1.187 $1.393 $2.580 $2.327<br />
1b $1.213 $1.085 $2.298 $2.045<br />
2 $1.269 $1.257 $2.526 $2.273<br />
As may be seen, the total costs of the alternatives range between $1.2 and $1.4 billion<br />
dollars to raise Year 2000 track capacity to accommodate Year 2010 traffic levels, and<br />
between 2.2 and 2.7 billion dollars to raise capacity to accommodate Year 2025 traffic<br />
levels. Accounting for track capacity improvements already completed or fully funded<br />
and under construction subsequent to Year 2000 (discussed below), this range is reduced<br />
to $2.0 to $2.4 billion. Alternative 1b is least costly at $2.02 billion, about $300 million<br />
less than the Status Quo and Alternative 1a.<br />
The capital costs listed in the second, third and fourth columns of the table start with the<br />
Year 2000 track configuration as a base. As of mid-2005, the following improvements to<br />
that configuration had been completed or were fully funded and under construction. (For<br />
purposes of comparison, the cost figures listed below were developed using our cost<br />
estimation methodology and are not actual expenditure amounts.)<br />
• Second main track on UP Yuma <strong>Line</strong>, Fingal milepost 578.8 – Garnet MP 585.0,<br />
funded by UP: $17.8 million. (Improvement required for all alternatives in 2010.)<br />
• Third main track on BNSF <strong>Line</strong> Baseline (San Bernardino) MP 79.9 – Verdemont<br />
MP 73.9, funded by BNSF: $21.3 million. (Improvement required for all<br />
alternatives in 2010.)<br />
• Second main track on UP San Gabriel <strong>Line</strong>, E. Montebello MP 8.6 - E. Pico<br />
Rivera MP 10.7 and Diamond Bar MP 25.5 - Sandra MP 27.8, funded by<br />
Metrolink: $50.1 million. (Improvement required for Status Quo and Alternatives<br />
1a and 1b in 2010, required for Alternative 2 in 2025.)<br />
• Third main track on BNSF <strong>Line</strong>, Bandini MP 149.8 – Basta MP 163.0, funded by<br />
Caltrans: $163.9 million (under construction). (Improvement required for all<br />
alternatives in 2010.)<br />
• Total for capacity improvements already funded: $253.1 million.<br />
The $253 million in funded capacity improvements to date represents about 18% of the<br />
required capital outlays to raise capacity under the Status Quo Alternative from Year<br />
2000 traffic levels to Year 2010 levels and about 21% of the required outlays under<br />
Alternative 1b. Yet half of the decade has passed. Clearly, improvements in track<br />
capacity are not keeping up with the rising traffic levels; in fact, capacity requirements<br />
75
are growing at more than double the rate of growth in capacity. As a result, the quality of<br />
freight and passenger services in the Los Angeles Basin is declining. In view of this<br />
trend, recent severe delays to Amtrak and Metrolink trains and “melt-downs” in rail<br />
freight operations are not surprising.<br />
76
10. Emissions Analysis<br />
Emissions from locomotives powering through train movements and from vehicular<br />
delays at grade crossings are a function of how trains are routed through the <strong>Main</strong> <strong>Line</strong><br />
Network. For the years 2000, 2010 and 2025 and for the various routing alternatives,<br />
emissions were calculated for BNSF and UP through freight trains and passenger trains<br />
over main lines between the north end of the Alameda Corridor and Barstow and Indio.<br />
Locomotive emissions were calculated based on the average through train movements per<br />
day and idling emissions from traffic delay were estimated based on total vehicle hours of<br />
delay at railroad crossings at grade. Emissions are categorized by reactive organic gases,<br />
carbon monoxide, nitrogen oxides, particulate matter, and sulfurous oxides.<br />
10.1 Grade Crossing Analysis<br />
Traffic delays have been estimated for all grade crossings in the study area and for all<br />
routing scenarios for 2005, 2010 and 2025. Thirty-three linked spreadsheets were<br />
developed, including a master that lists train volumes by train type and by segment of<br />
railroad track for all scenarios.<br />
The measure chosen for this study is vehicle hours of delay per day (VHDD). One<br />
VHDD is equal to 60 vehicle minutes of delay. This is equivalent to 60 vehicles delayed<br />
one minute, or one vehicle delayed 60 minutes. The VHDD measure is used in the<br />
calculation of emissions from vehicles waiting to cross the railroad tracks.<br />
The delay equations used for this analysis are the same ones used in SCAG’s San Pedro<br />
Bay Ports Access <strong>Study</strong> published in 1984. 19 These equations have been used in every<br />
grade crossing delay study in the SCAG region ever since, including several EIRs for<br />
major projects such as the Alameda Corridor and for the Alameda Corridor-East Trade<br />
Corridor Plan (April 2001). 20 The equations were originally developed by James Powell<br />
in a paper submitted to the Transportation Research Board in 1982. 21<br />
The spreadsheets first calculate a gate-down time for each train and rail crossing. Then<br />
based on assumed vehicular arrival and departure rates, vehicular delay is calculated for<br />
each train event. These events are summed for all trains over a 24-hour period to develop<br />
an estimate of VHDD. This allows a comparison of the relative impact of each scenario<br />
on traffic delays in the study area.<br />
Important inputs to the analysis include:<br />
19<br />
SCAG, San Pedro Bay Ports Access <strong>Study</strong>: Phase 2: <strong>Railroad</strong> Access, October 1984.<br />
20<br />
ACE Construction Authority, SANBAG, RCTC, OCTA, OnTrac, Alameda Corridor-East Trade<br />
Corridor Plan, April 2001.<br />
21<br />
Powell, James L., Effects of Rail-Highway Grade Crossings on Highway Users, presentation to<br />
Transportation Research Board , January 19, 1982, p.12.<br />
77
• Average Daily Traffic (ADT) at the crossing and distribution of traffic volumes<br />
over four time periods of the day: a.m. peak period, midday, p.m. peak period and<br />
night (determines vehicular arrival rate)<br />
• Number of lanes at the crossing (affects queue storage)<br />
• Speed of the train (affects gate down time)<br />
• Vehicular departure rate (depends on number of trucks in the queue)<br />
• Number of trains by length and distribution of trains by time of day.<br />
ADT estimates and number of lanes were taken from data files of the Public Utilities<br />
Commission (which has jurisdiction over grade crossings). Base year ADT values were<br />
adjusted for future years by inflating the original values by 1% per year, an admittedly<br />
simplistic assumption. Clearly it would have been preferable to have a complete new set<br />
of ADT counts for all crossings and to develop forecasts based on regional modeling<br />
efforts, but this was beyond the scope of this study. Unfortunately, P<strong>UC</strong> files are not<br />
always up to date, so we also compared these ADT figures and resulting VHDD<br />
estimates with the results of the Alameda Corridor-East Trade Corridor Plan. (See<br />
discussion of the comparison later on in this section).<br />
Train speeds were taken from railroad track charts. The estimates of freight train volumes<br />
by type and length developed in this study by Leachman and Associates were assumed,<br />
as documented in Appendix B. For the grade crossing analysis, train volumes were<br />
assumed to be evenly distributed over 24 hours, but passenger train volumes by time<br />
period were based on published schedules.<br />
The gate-down time depends on train length and speed, lead time and lag time (time the<br />
gate goes down before the train arrives and when it goes up after the train clears the<br />
crossing), and on the width of the intersection. Vehicular delay is a function of the square<br />
of the gate-down time, as follows:<br />
⎛ 1 ⎞ aTG ⎛ 1 ⎞<br />
Delay in vehicle-hours = ⎜ ⎟ ⎜ ⎟<br />
⎝ 2 ⎠ ⎛ a ⎞ ⎝ 60 ⎠<br />
⎜1−<br />
⎟<br />
⎝ d ⎠<br />
where TG is the gate-down time expressed in minutes, a is the vehicular arrival rate<br />
expressed in vehicles per minute and d is the vehicular departure rate expressed in<br />
vehicles per minute.<br />
For future years it was assumed that certain major crossings would be grade separated.<br />
VHDD for these streets were “zeroed out” in the final results. The list of grade<br />
separations was derived from the high priority listings of various jurisdictions involved:<br />
San Gabriel Valley Council of Governments and the Alameda Corridor-East Construction<br />
Authority, SANBAG, RCTC, OCTA, Caltrans, OnTrac and the Gateway Cities Council<br />
of Governments. As shown in Table 28, it was assumed that 10 existing grade crossings<br />
would be grade separated and one would be closed by 2010. As shown in Table 29, it was<br />
assumed that an additional 38 streets would be grade separated by 2025. On the UPRR<br />
78<br />
2
Yuma <strong>Line</strong>, Dillon Road and Avenue 50 are on RCTC’s top ten list, but these two<br />
crossings are outside of the study area, which ends at West Indio MP 610.90. In<br />
Placentia, the Melrose Street grade separation was completed in 2005, and thus is not<br />
included in the list below.<br />
Table 28<br />
Streets Assumed to Be Grade-Separated by 2010<br />
Rail <strong>Line</strong> P<strong>UC</strong> # Street Name Jurisdiction<br />
OnTrac<br />
BNSF San Bernardino 2B-43.60 Placentia Avenue Placentia<br />
BNSF San Bernardino 2B-43.00 Bradford Avenue* Placentia<br />
* Street closure.<br />
ACE Construction<br />
Authority (Phase I)<br />
UPRR Alhambra 1B-504.80 Nogales Street Industry/LA County<br />
UPRR Los Angeles 3-33.50 East End Avenue Pomona<br />
UPRR Alhambra 1B-515.40 Reservoir Street Pomona<br />
UPRR Alhambra 1B-495.10 Ramona Blvd. El Monte<br />
UPRR Alhambra 1B-510.50 Temple Avenue LA County<br />
UPRR Los Angeles 3-24.90 Brea Canyon Road Industry/LA County<br />
UPRR Alhambra 1B-499.20 Sunset Avenue Industry/LA County<br />
UPRR Alhambra 1B-493.60 Baldwin Avenue LA County<br />
UPRR Los Angeles 3-22.40 Nogales Street Industry/LA County<br />
79
Table 29<br />
Streets Assumed to Be Grade-Separated by 2025<br />
(in addition to those assumed to be grade-separated by 2010)<br />
Rail <strong>Line</strong><br />
OnTrac<br />
P<strong>UC</strong> # Street Name Jurisdiction<br />
BNSF San Bernardino 2B-42.50 Kramer Blvd. Placentia<br />
BNSF San Bernardino 2B-41.80 Orangethorpe Ave. Placentia<br />
BNSF San Bernardino 2B-41.50 Tustin Ave./ Placentia<br />
80<br />
Rose Drive<br />
BNSF San Bernardino 2B-41.00 Jefferson Street Placentia<br />
BNSF San Bernardino 2B-40.70 Van Buren Street Placentia<br />
BNSF San Bernardino 2B-40.40 Richfield Road Placentia<br />
BNSF San Bernardino 2B-39.90 Lakeview Avenue Placentia<br />
BNSF San Bernardino 2B-39.20 Kellogg Drive Placentia<br />
Caltrans<br />
BNSF San Bernardino 2B-38.40 Imperial Highway Caltrans<br />
ACE Construction<br />
Authority (Phase II)<br />
UPRR Alhambra 1B-485.80 Valley Boulevard City of LA<br />
UPRR Alhambra 1B-490.20 Ramona Street San Gabriel<br />
UPRR Alhambra 1B-490.30 Mission Road San Gabriel<br />
UPRR Alhambra 1B-490.70 Del Mar Avenue San Gabriel<br />
UPRR Alhambra 1B-491.20 San Gabriel Blvd. San Gabriel<br />
UPRR Alhambra 1B-498.20 Puente Avenue Industry/LA County<br />
UPRR Alhambra 1B-505.75 Fairway Drive Industry/LA County<br />
UPRR Los Angeles 3-8.50 Montebello Blvd. Montebello<br />
UPRR Los Angeles 3-12.30 Rose Hills Road LA County<br />
UPRR Los Angeles 3-17.20 Turnbull Canyon Rd LA County<br />
UPRR Los Angeles 3-23.40 Fairway Drive Industry
Table 29 (cont.)<br />
Streets Assumed to Be Grade-Separated by 2025<br />
(in addition to those assumed to be grade-separated by 2010)<br />
Rail <strong>Line</strong><br />
Gateway Cities<br />
P<strong>UC</strong> # Street Name Jurisdiction<br />
BNSF San<br />
Bernardino<br />
2-153.10 Norwalk Blvd. Santa Fe Springs<br />
BNSF San<br />
2-151.45 Passons Blvd. Pico Rivera<br />
Bernardino<br />
San Bernardino Co.<br />
UPRR Yuma 1B-541.00 Hunts Lane SB City/SB<br />
County<br />
BNSF Cajon 2-76.60 State Street University<br />
Parkway<br />
SB County<br />
UPRR Los Angeles 3-43.40 Milliken Ave. Riverside County<br />
UPRR Alhambra 1B-516.90 Ramona Avenue Montclair<br />
UPRR Alhambra 1B-517-<br />
40<br />
Monte Vista Ave. Montclair<br />
BNSF Cajon 2-5.70 Lenwood Road SB County<br />
BNSF Cajon 2-74.00 Palm Avenue SB County<br />
BNSF San<br />
2B-3.10 Valley Blvd. Colton<br />
Bernardino<br />
Riverside County<br />
BNSF San<br />
Bernardino<br />
2B-9.50 3rd St City of Riverside<br />
BNSF San<br />
Bernardino<br />
2B-7.30 Iowa Av City of Riverside<br />
BNSF San<br />
Bernardino<br />
2B-21.20 McKinley St Corona<br />
BNSF San<br />
2B-20.30 Magnolia Ave E&W Riverside County<br />
Bernardino<br />
& 20.35<br />
BNSF San<br />
Bernardino<br />
2B-8.10 Chicago Av City of Riverside<br />
UPRR Los Angeles 3-53.80 Streeter Av City of Riverside<br />
BNSF San<br />
Bernardino<br />
2B-8.80 Spruce St City of Riverside<br />
Summary results for each scenario broken down by year and line segment are displayed<br />
in Table 30.<br />
81
Table 30<br />
Grade Crossing Impacts: Total Gate-Down Time and Total Vehicle-Hours of Delay<br />
(Assumes high-priority grade separations are in place)<br />
<strong>Line</strong> Segment<br />
and<br />
Routing Alternative<br />
Total<br />
Gate<br />
(Hours)<br />
Total<br />
VHDD<br />
(Hours)<br />
82<br />
Total Gate<br />
% Increase<br />
From 2000<br />
Total VHDD<br />
% Increase<br />
From 2000<br />
BNSF Cajon <strong>Line</strong><br />
(Barstow – San Bernardino)<br />
2000 Baseline 42 86 0% 0%<br />
2010 Status Quo 61 140 43% 62%<br />
2010 Alts. 1 or 2 61 140 43% 62%<br />
2025 Status Quo 67 61 57% -29%<br />
2025 Alts. 1 or 2 67 61 57% -29%<br />
BNSF <strong>Line</strong><br />
(San Bernardino – Redondo)<br />
2000 Baseline 159 1,223 0% 0%<br />
2010 Status Quo 233 2,039 46% 67%<br />
2010 Alts. 1 or 2 210 1,904 32% 56%<br />
2025 Status Quo 245 2,036 54% 66%<br />
2025 Alts. 1 or 2 221 1,939 39% 59%<br />
UP Yuma <strong>Line</strong><br />
2000 Baseline 26 60 0% 0%<br />
2010 Status Quo 37 94 42% 58%<br />
2010 Alt. 1a 37 94 42% 58%<br />
2010 Alt. 1b 37 94 42% 58%<br />
2010 Alt. 2 37 94 42% 58%<br />
2025 Status Quo 52 156 97% 161%<br />
2025 Alt. 1a 52 156 97% 161%<br />
2025 Alt. 1b 52 156 97% 161%<br />
2025 Alt. 2 52 156 97% 161%<br />
UP Alhambra <strong>Line</strong><br />
2000 Baseline 39 631 0% 0%<br />
2010 Status Quo 49 766 26% 21%<br />
2010 Alt. 1a 17 241 -58% -62%<br />
2010 Alt. 1b 28 319 -29% -49%<br />
2010 Alt. 2 98 1,618 151% 156%<br />
2025 Status Quo 58 766 47% 21%<br />
2025 Alt. 1a 16 203 -58% -68%<br />
2025 Alt. 1b 32 300 -20% -52%<br />
2025 Alt. 2 120 1,704 205% 170%
Table 30 (cont.)<br />
Grade Crossing Impacts: Total Gate-Down Time and Total Vehicle-Hours of Delay<br />
(Assumes high-priority grade separations are in place)<br />
<strong>Line</strong> Segment<br />
and<br />
Routing Alternative<br />
Total<br />
Gate<br />
(Hours)<br />
Total<br />
VHDD<br />
(Hours)<br />
83<br />
Total Gate<br />
% Increase<br />
From 2000<br />
Total VHDD<br />
% Increase<br />
From 2000<br />
UP San Gabriel <strong>Line</strong><br />
2000 Baseline 59 621 0% 0%<br />
2010 Status Quo 83 948 42% 53%<br />
2010 Alt. 1a 55 659 -7% 6%<br />
2010 Alt. 1b 50 630 -14% 1%<br />
2010 Alt. 2 27 251 -55% -60%<br />
2025 Status Quo 107 1,169 82% 88%<br />
2025 Alt. 1a 65 637 11% 3%<br />
2025 Alt. 1b 60 611 2% -2%<br />
2025 Alt. 2 31 241 -48% -61%<br />
Grand Total<br />
2000 Baseline 326 2,622 0% 0%<br />
2010 Status Quo 464 3,987 42% 52%<br />
2010 Alt. 1a 379 3,039 16% 16%<br />
2010 Alt. 1b 386 3,088 18% 18%<br />
2010 Alt. 2 433 4,007 33% 53%<br />
2025 Status Quo 528 4,188 62% 60%<br />
2025 Alt. 1a 421 2,996 29% 14%<br />
2025 Alt. 1b 431 3,067 32% 17%<br />
2025 Alt. 2 489 4,101 50% 56%<br />
The grade separations listed in Tables 28 and 29 would eliminate 4,000 VHDD in the<br />
2025 Status Quo scenario. If these were not built, the total VHDD for the Status Quo<br />
2025 scenario would be 8,188 VHDD for all crossings.<br />
Comparison to Previous Studies<br />
These results were compared to the estimates prepared by Korve Engineers for the<br />
Alameda Corridor-East Trade Corridor Plan (April 2001) 22 . Korve estimated about 8,700<br />
“unadjusted” VHDD and about 13,346 “adjusted” VHDD for 2020. Although the<br />
number of crossings assumed in this study is not exactly the same as that studied by<br />
Korve, the VHDD results in this study are about 50 to 60% lower than Korve’s<br />
“adjusted” results. Emissions estimates from vehicular delays would be about double<br />
what is reported if Korve’s higher VHDD figures were used.<br />
22 ACE Construction Authority, SANBAG, RCTC, OCTA, OnTrac, Alameda Corridor-East Trade<br />
Corridor Plan, April 2001.
Korve’s unadjusted figures were a compilation of results from various studies from<br />
different jurisdictions. It is unknown what train speeds and what number of lanes were<br />
assumed in those studies. Korve’s adjusted figures represented escalations of the<br />
unadjusted data based on more recent information (in 2001) about the number of<br />
projected trains on the network. Korve’s results were based on ADT figures that are<br />
about 48% higher overall than those assumed in this study.<br />
The discrepancies may be significant, but the structure of the files prepared for this study<br />
are such that future updates of this work can be done from one comprehensive data base,<br />
rather than attempting to piece together several studies with varying methodologies. It is<br />
recommended that a new set of ADT figures be developed for all crossings in the study<br />
area for 2005, and that forecasts of ADT be developed from modeling results for the<br />
region.<br />
10.2 Characterization of Emissions<br />
10.2.1. Baseline Emissions<br />
Locomotive Traffic Emissions in 2000<br />
To establish a baseline, year 2000 emissions for trains operating along the BNSF, UP and<br />
passenger routes were calculated using assumed standard locomotive consists for actual<br />
train traffic data, and are summarized in Table 31. 23 In year 2000 about 60% of UP<br />
freight trains traveled on the UP San Gabriel line and 40% traveled on the UP Alhambra<br />
subdivision line. The year 2000 allocation of trains to routes is hereafter referred to as the<br />
Status Quo routing of train movements. The locomotive emissions (lbs/day) were<br />
calculated by multiplying the daily power consumption with the corresponding emission<br />
factors, which were derived from the actual locomotive duty cycles. The daily power<br />
consumption was calculated by multiplying the number of trains per day, with average<br />
train-hours on the Status Quo regional train routes (BNSF, UP and passenger), average<br />
locomotive cycle horsepower, and the corresponding number of locomotives per train. In<br />
addition pusher locomotives in mountain areas were incorporated into the emissions<br />
inventory for the specific segments where operated. Average daily locomotive emissions<br />
from BNSF, UP and passenger trains were then annualized (tons/year).<br />
Vehicle Delay Emissions in 2000<br />
In order to calculate the emission reductions associated with elimination of vehicular<br />
delays at grade crossings, the number of vehicles and delay times were estimated by Gill<br />
V. Hicks and Associates, Inc. from actual traffic count data scaled to account for growth<br />
factors and then translated into vehicular delay using a standard formula. (See section 3<br />
above.) Total vehicle hours of delay in year 2000 were calculated to be 2,622 hours per<br />
23 Locomotive consists and train counts used in this and all other scenarios analyzed in this section are<br />
provided in Appendix B<br />
84
peak day. To establish a year 2000 baseline, idling emissions were calculated by<br />
multiplying total vehicle hours of delay at grade crossings with vehicle emission factors,<br />
using year 2000 CARB EMFAC 24 vehicle emissions profiles. The daily idling emissions<br />
were annualized and converted from grams/hour to tons/year. These vehicle delays<br />
results in the idling emissions summarized in Table 32.<br />
Table 31: Year 2000 <strong>Main</strong> <strong>Line</strong> Rail Network Emissions from BNSF, UP and<br />
Passenger Trains<br />
(Emissions expressed in tons)<br />
Year 2000 ROG CO NOx PM10 SOx<br />
BNSF 238.06 325.76 7235.67 162.88 448.55<br />
UP 253.72 347.20 7711.83 173.60 478.07<br />
Passenger 6.65 48.33 476.60 11.08 31.74<br />
Cumulative 498.43 721.29 15424.10 347.56 958.36<br />
Table 32: Year 2000 <strong>Main</strong> <strong>Line</strong> Rail Network Emissions from Traffic Delay<br />
(tons)<br />
Year ROG CO NOx PM10 SOx<br />
2000 9.65 100.46 13.85 0.54 0.09<br />
Overall Emissions in 2000<br />
The overall 2000 emissions generated from train emissions and vehicle delays at grade<br />
crossings are summarized in Table 33. Cumulatively the emissions are: 508 tons of<br />
ROG; 822 tons of CO; 15438 tons of NOx; 348 tons of PM; and 958 tons of SOx.<br />
Table 33: Overall Emissions for Year 2000<br />
(tons)<br />
ROG CO NOx PM10 SOx<br />
Rail Emissions 498.43 721.29 15424.10 347.56 958.36<br />
Traffic Delay Emissions 9.65 100.46 13.85 0.54 0.09<br />
Cumulative Emissions 508.08 821.74 15437.95 348.10 958.45<br />
10.2.2 Benefits of Routing Alternatives in 2010<br />
By the year 2010, freight train movements are forecasted to increase by 41% on BNSF<br />
and 40% and UP lines, whereas passenger trains are projected to increase by 70%, when<br />
24 California Air Resources Board, EMFAC 2002, Version 2.20, Calculating emission inventories for<br />
vehicles in California.<br />
85
compared to the 2000 baseline. There are two types of future air quality benefits to be<br />
realized in the various alternatives analyzed; those related to increased rail efficiency<br />
which result in reduced travel times as well as reduced vehicle delay at grade crossings<br />
due to implementation of grade separations. The year 2010 was chosen to represent<br />
benefits in the near future, when 22% (11 out of 49) of the grade separations will be<br />
implemented. These grade separations would allow vehicular traffic (cars, trucks and<br />
buses) to travel unobstructed on surface streets along the BNSF and UP rail lines.<br />
Therefore, emissions of idling vehicles that previously were delayed at grade crossings<br />
waiting for trains to pass would be eliminated.<br />
The assumptions used to quantify control measure improvements in future years are as<br />
follows: Future year 2010 assumptions incorporate emission reductions based on South<br />
Coast Air Quality Management Plan control measure M-14, which assumes that cleaner<br />
locomotive engines (those compliant with federal Tier II standards) will be operating in<br />
California and in the South Coast Air Basin. As a result of M-14, CARB, the railroads<br />
and EPA signed a Memorandum of Understanding providing for early introduction of<br />
clean locomotive units and requiring that a fleet average equivalent to EPA’s Tier II<br />
standards be achieved by 2010. Emission factors for "Tier I" locomotives used in the<br />
analysis are based on actual locomotive duty cycles, whereas emission factors of "Tier II"<br />
locomotives reflect the EPA Tier II standard, with more lenient emission standards for<br />
ROG and in particular for CO. This difference results in an anomalous increase in CO<br />
emissions from 2000 to 2025 as the EPA Tier II standard for CO emissions is well in<br />
excess (by a factor of 3) of actual Tier I locomotive performance. 25<br />
Status Quo Emissions in 2010<br />
In the 2010 Status Quo scenario, about two-thirds (60%) of UP freight trains travel on the<br />
UP San Gabriel subdivision line and one-third (40%) travel on the UP Alhambra<br />
subdivision line. Emissions for trains following BNSF, UP and passenger routes were<br />
calculated using assumed standard locomotive powering practices for various types of<br />
trains.<br />
Emission Benefits 2010 Alternative 1a<br />
In the year 2010 Alternative 1 concentrates UP freight trains on the UP San Gabriel <strong>Line</strong><br />
subdivision west of Pomona (85%) and on the UP Alhambra <strong>Line</strong> subdivision east of<br />
Pomona (Figure 4: bold orange route). This freight train concentration in turn shifts a<br />
number of UP trains off the BNSF <strong>Line</strong> between Colton and Cajon Pass and onto the UP<br />
Palmdale <strong>Line</strong> as far north as Silverwood (Figure 2). Alternative 1a maintains the status<br />
quo routing of Metrolink Riverside passenger trains on the UP San Gabriel <strong>Line</strong> (Figure<br />
4: blue route). The locomotive emissions (lbs/day) in this scenario were calculated by<br />
multiplying the daily power consumption with the corresponding emission factors, which<br />
were derived from the actual locomotive duty cycles. The daily power consumption was<br />
25 Environmental Protection Agency Regulatory Announcement, Final Emissions Standards for<br />
Locomotives, December 1997.<br />
86
calculated by multiplying number of trains per day, with average train-hours on the<br />
regional train routes (BNSF, UP and passenger), average locomotive cycle horsepower,<br />
and the corresponding number of locomotives per train. In addition pusher locomotives<br />
in mountain areas were accounted for on the specific segments where operated. The daily<br />
locomotive emissions were then annualized (tons/year).<br />
Emissions were calculated for the “Status Quo” and “Alternative 1a” scenarios. The<br />
“Alternative 1a” emissions were then subtracted from the “Status Quo” emissions to<br />
quantify the year 2010 emissions reductions. The benefits from increased rail efficiency<br />
for Alternative 1a are 91 tons of ROG, 455 tons of CO, 1668 tons of NOx, 61 tons of PM<br />
and 19 tons of SOx, which are summarized in Table 34.<br />
Table 34: Basin-wide Emission Reduction Benefits from Rail Efficiency in 2010,<br />
Alternative 1a<br />
(tons)<br />
2010 ROG CO NOx PM SOx<br />
Status Quo - BNSF 285.35 1426.73 5231.33 190.23 58.02<br />
Status Quo - UP 269.21 1346.05 4935.51 179.47 54.74<br />
Status Quo - Passenger 21.80 109.02 399.76 14.54 4.43<br />
Cumulative 576.36 2881.80 10566.59 384.24 117.19<br />
Alternative 1a - BNSF 280.54 1402.69 5143.21 187.03 57.04<br />
Alternative 1a - UP 183.95 919.74 3372.39 122.63 37.40<br />
Alternative 1a - Passenger 20.88 104.38 382.73 13.92 4.24<br />
Cumulative 485.36 2426.82 8898.33 323.58 98.69<br />
Benefits Alternative 1a 91.00 454.98 1668.27 60.66 18.50<br />
As before, emissions from vehicular hours of delay were calculated and added to<br />
emissions from the trains. The calculated vehicular hours of delay per peak day in 2010<br />
are 3,987 for Status Quo and 3,039 for Alternative 1a. Emission benefits from eliminated<br />
vehicle delay for Alternative 1a were calculated by multiplying total reduced vehicle<br />
hours of delay at grade crossings with emission factors, using year 2010 CARB EMFAC<br />
vehicle emissions profiles, which are summarized in Table 35. Cumulative emission<br />
benefits from Alternative 1a are also presented in this table.<br />
Emission Benefits 2010, Alternative 1b<br />
As outlined in Alternative 1b, UP freight trains are concentrated on the UP San Gabriel<br />
<strong>Line</strong> subdivision west of Pomona (85%) and on the UP Alhambra <strong>Line</strong> subdivision east<br />
of Pomona (Figure 4: bold orange route). This alternative in turn shifts a number of UP<br />
trains off the BNSF <strong>Line</strong> between Colton and Cajon Pass and onto the UP Palmdale <strong>Line</strong><br />
as far north as Silverwood (Figure 2). Alternative 1b reroutes the Metrolink Riverside<br />
passenger trains via the Alhambra UP subdivision line west of Pomona (Figure 5: blue<br />
line).<br />
87
Table 35: Basin-wide Combined Emission Reduction Benefits from Rail Efficiency<br />
and Vehicle Delay Elimination in 2010, Alternative 1a<br />
(tons)<br />
2010 ROG CO NOx PM SOx<br />
Status Quo 5.00 58.34 10.11 0.79 0.09<br />
Alternative 1a 3.81 44.45 7.70 0.60 0.07<br />
Benefits 1.19 13.88 2.41 0.19 0.02<br />
Cumulative Benefits 1a 92.19 468.87 1670.67 60.85 18.52<br />
The benefits from increased rail efficiency for Alternative 1b are 98 tons of ROG, 491<br />
tons of CO, 1800 tons of NOx, 65 tons of PM and 20 tons of SOx, and are summarized in<br />
Table 36. Cumulative emission benefits from Alternative 1b are also presented in this<br />
table.<br />
Table 36: Basin-wide Emission Reduction Benefits from Rail Efficiency in 2010,<br />
Alternative 1b<br />
(tons)<br />
2010 ROG CO NOx PM SOx<br />
Status Quo - BNSF 285.35 1426.73 5231.33 190.23 58.02<br />
Status Quo - UP 269.21 1346.05 4935.51 179.47 54.74<br />
Status Quo - Passenger 21.80 109.02 399.76 14.54 4.43<br />
Cumulative 576.36 2881.80 10566.59 384.24 117.19<br />
Alternative 1b - BNSF 280.54 1402.69 5143.21 187.03 57.04<br />
Alternative 1b - UP 176.87 884.35 3242.62 117.91 35.96<br />
Alternative 1b - Passenger 20.76 103.80 380.60 13.84 4.22<br />
Cumulative 478.17 2390.84 8766.43 318.78 97.23<br />
Benefits Alternative 1b 98.19 490.95 1800.16 65.46 19.97<br />
As before, emissions from vehicular hours of delay were calculated and added to<br />
emissions from the trains. The calculated vehicular hours of delay per peak day in 2010<br />
are 3,987 for Status Quo and 3,088 for Alternative 1b. Emission benefits from eliminated<br />
vehicle delay for Alternative 1b were calculated by multiplying total reduced vehicle<br />
hours of delay at grade crossings with emission factors, and were summarized in Table<br />
37. Cumulative emission benefits from Alternative 1b are also presented in this table.<br />
88
Table 37: Basin-wide Combined Emission Reduction Benefits from Rail Efficiency<br />
and Vehicle Delay Elimination in 2010, Alternative 1b<br />
(tons)<br />
2010 ROG CO NOx PM SOx<br />
Status Quo 5.00 58.34 10.11 0.79 0.09<br />
Alternative 1b 3.87 45.18 7.83 0.61 0.07<br />
Benefits 1.13 13.16 2.28 0.18 0.02<br />
Cumulative Benefits 1b 99.32 504.11 1802.44 65.64 19.99<br />
Emission Benefits 2010, Alternative 2<br />
For the year 2010 Alternative 2 concentrates UP freight trains on the UP Alhambra<br />
subdivision <strong>Line</strong> west of Pomona with 85% and on the UP Alhambra <strong>Line</strong> subdivision<br />
east of Pomona with 88% (Figure 6: bold orange route). This alternative in turn shifts a<br />
number of UP trains off the BNSF <strong>Line</strong> between Colton and Cajon Pass and onto the UP<br />
Palmdale <strong>Line</strong> as far north as Silverwood (Figure 2). The Metrolink Riverside passenger<br />
trains remain on the UP San Gabriel <strong>Line</strong> (Figure 6: blue route). The locomotive<br />
emissions (lbs/day) in this scenario were calculated by multiplying the daily power<br />
consumption with the corresponding emission factors, which were derived from the<br />
actual locomotive duty cycles. The daily power consumption was calculated by<br />
multiplying number of trains per day, with average train-hours on pre-existing regional<br />
train routes (BNSF, UP and passenger), average locomotive cycle horsepower, and the<br />
corresponding number of locomotives per train. In addition pusher locomotives in<br />
mountain areas are accounted for on the specific segments where operated. Average daily<br />
locomotive emissions were then annualized (tons/year).<br />
The benefits from increased rail efficiency for Alternative 2 are 98 tons of ROG, 491 tons<br />
of CO, 1801 tons of NOx, 66 tons of PM and 20 tons of SOx, which are summarized in<br />
Table 38.<br />
Table 38: Basin-wide Emission Reduction Benefits from Rail Efficiency in 2010,<br />
Alternative 2<br />
(tons)<br />
2010 ROG CO NOx PM SOx<br />
Status Quo - BNSF 285.35 1426.73 5231.33 190.23 58.02<br />
Status Quo - UP 269.21 1346.05 4935.51 179.47 54.74<br />
Status Quo - Passenger 21.80 109.02 399.76 14.54 4.43<br />
Cumulative 576.36 2881.80 10566.59 384.24 117.19<br />
Alternative 2 - BNSF 280.54 1402.69 5143.21 187.03 57.04<br />
Alternative 2 - UP 177.16 885.82 3248.02 118.11 36.02<br />
Alternative 2 - Passenger 20.41 102.03 374.09 13.60 4.15<br />
Cumulative 478.11 2390.54 8765.32 318.74 97.22<br />
Benefits Alternative 2 98.25 491.26 1801.28 65.50 19.98<br />
89
As before, emissions from vehicular hours of delay were calculated and added to<br />
emissions from the trains. The calculated vehicular hours of delay per peak day in 2010<br />
are 3,987 for Status Quo and 4,007 for Alternative 2. Emission benefits from eliminated<br />
vehicle delay for Alternative 2 were calculated by multiplying total reduced vehicle hours<br />
of delay at grade crossings with emission factors, which were summarized in Table 39.<br />
Cumulative emission benefits from Alternative 2 are also presented in this table.<br />
Table 39: Basin-wide Combined Emission Reduction Benefits from Rail Efficiency<br />
and Vehicle Delay Elimination in 2010, Alternative 2<br />
(tons)<br />
2010 ROG CO NOx PM SOx<br />
Status Quo – 5.00 58.34 10.11 0.79 0.09<br />
Alternative 2 5.03 58.63 10.16 0.80 0.09<br />
Benefits -0.03 -0.29 -0.05 0.00 0.00<br />
Cumulative Benefits 2 98.23 490.96 1801.22 65.50 19.98<br />
10.2.3 <strong>Main</strong> <strong>Line</strong> Rail Network Benefits in 2025<br />
By the year 2025 freight traffic on BNSF and UP lines is forecasted to increase by 105%<br />
and 86% respectively, whereas passenger trains are projected to increase by 147% when<br />
compared to the 2000 baseline. There are two types of future air quality benefits to be<br />
realized; those related to increased rail efficiency with reduced travel times, and those<br />
related to reduced vehicle delay at grade crossings due to implementation of grade<br />
separations. The year 2025 represents benefits in a future year when grade separations are<br />
implemented and additional control measures that reduce the locomotive emissions<br />
profile will have been fully implemented. The <strong>Main</strong> <strong>Line</strong> Rail Network assumes<br />
implementation of 38 grade separations by 2025, which allow vehicular traffic (cars,<br />
trucks and buses) to travel unobstructed on surface streets along the BNSF and UP rail<br />
lines. Therefore, emissions of idling vehicles that previously were delayed at grade<br />
crossings waiting for trains to pass are eliminated.<br />
The assumptions used to quantify control measure improvements are as follows: Future<br />
year 2025 assumptions incorporate emission reductions based on South Coast Air Quality<br />
Management Plan control measure M-14, which assumes that cleaner locomotive engines<br />
(those compliant with federal Tier II standards) will be operating in California and in the<br />
South Coast Air Basin. As a result of M-14, CARB, the railroads and EPA signed a<br />
Memorandum of Understanding providing for early introduction of clean locomotive<br />
units and requiring that a fleet average equivalent to EPA’s Tier II standards be achieved<br />
by 2010. The emissions profile for future year locomotives also assumes the<br />
implementation of the California low-sulfur diesel fuel regulations (for which<br />
locomotives will have to comply by January 1, 2012).<br />
90
Emission Benefits 2025, Alternative 1a<br />
In the year 2025 Alternative 1 concentrates UP freight trains on the UP San Gabriel <strong>Line</strong><br />
subdivision west of Pomona (85%) and on the UP Alhambra <strong>Line</strong> subdivision east of<br />
Pomona (Figure 4: bold orange route). This alternative in turn shifts a number of UP<br />
trains off the BNSF <strong>Line</strong> between Colton and Cajon Pass and onto the UP Palmdale <strong>Line</strong><br />
as far north as Silverwood (Figure 2). Alternative 1a maintains the status quo routing of<br />
Metrolink Riverside passenger trains on the UP San Gabriel <strong>Line</strong> (Figure 4: blue route).<br />
The locomotive emissions (lbs/day) in this scenario were calculated by multiplying the<br />
daily power consumption with the corresponding emission factors, which were derived<br />
from the actual locomotive duty cycles. The daily power consumption was calculated by<br />
multiplying number of trains per day, with average train-hours on regional train routes<br />
(BNSF, UP and passenger), average locomotive cycle horsepower, and the corresponding<br />
number of locomotives per train. In addition pusher locomotives in mountain areas are<br />
accounted for on the specific segments where operated. The daily locomotive emissions<br />
were then annualized (tons/year).<br />
The 2025 benefits from increased rail efficiency for Alternative 1a are 167 tons of ROG,<br />
834 tons of CO, 3058 tons of NOx, 111 tons of PM and 2 tons of SOx, which are<br />
summarized in Table 40.<br />
Table 40: Basin-wide Emission Reduction Benefits from Rail Efficiency in 2025,<br />
Alternative 1a<br />
(tons)<br />
2025 ROG CO NOx PM SOx<br />
Status Quo - BNSF 429.64 2148.18 7876.64 286.42 5.73<br />
Status Quo - UP 406.00 2030.00 7443.33 270.67 5.41<br />
Status Quo - Passenger 30.98 154.90 567.97 20.65 0.41<br />
Cumulative 866.62 4333.08 15887.94 577.74 11.55<br />
Alternative 1a - BNSF 421.65 2108.26 7730.29 281.10 5.62<br />
Alternative 1a - UP 247.07 1235.36 4529.64 164.71 3.29<br />
Alternative 1a - Passenger 31.07 155.34 569.57 20.71 0.41<br />
Cumulative 699.79 3498.96 12829.51 466.53 9.33<br />
Net Change 166.82 834.12 3058.44 111.22 2.22<br />
As before, emissions from vehicular hours of delay were calculated and added to<br />
emissions from the trains. The calculated vehicular hours of delay per peak day in 2025<br />
are 4,188 for Status Quo and 2,996 for Alternative 1a. The 2025 emission benefits from<br />
eliminated vehicle delay for Alternative 1a were calculated by multiplying total reduced<br />
vehicle hours of delay at grade crossings with emission factors, and are summarized in<br />
Table 41. Cumulative emission benefits from Alternative 1a are also presented in this<br />
table.<br />
91
Table 41: Basin-wide Combined Emission Reduction Benefits from Rail Efficiency<br />
and Vehicle Delay Elimination in 2025, Alternative 1a<br />
(tons)<br />
2025 ROG CO NOx PM SOx<br />
Status Quo – 1.48 18.31 2.89 0.81 0.09<br />
Alternative 1a 1.06 13.10 2.07 0.58 0.07<br />
Benefits 0.42 5.21 0.82 0.23 0.03<br />
Cumulative Benefits 1a 167.25 839.33 3059.26 111.45 2.25<br />
Emission Benefits 2025, Alternative 1b<br />
As outlined in Alternative 1b, UP freight trains are concentrated on the UP San Gabriel<br />
<strong>Line</strong> subdivision west of Pomona (85%) and on the UP Alhambra <strong>Line</strong> subdivision east<br />
of Pomona (Figure 5: bold orange route). This alternative in turn shifts a number of UP<br />
trains off the BNSF <strong>Line</strong> between Colton and Cajon Pass and onto the UP Palmdale <strong>Line</strong><br />
as far north as Silverwood (Figure 2). Alternative 1b reroutes the Metrolink Riverside<br />
passenger trains via the Alhambra UP subdivision line west of Pomona (Figure 5: blue<br />
line).<br />
The 2025 benefits from increased rail efficiency for Alternative 1b are 163 tons of ROG,<br />
814 tons of CO, 2983 tons of NOx, 108 tons of PM and 2 tons of SOx, which are<br />
summarized in Table 42.<br />
Table 42: Basin-wide Emission Reduction Benefits from Rail Efficiency in 2025,<br />
Alternative 1b<br />
(tons)<br />
2025 ROG CO NOx PM SOx<br />
Status Quo - BNSF 429.64 2148.18 7876.64 286.42 5.73<br />
Status Quo - UP 406.00 2030.00 7443.33 270.67 5.41<br />
Status Quo - Passenger 30.98 154.90 567.97 20.65 0.41<br />
Cumulative 866.62 4333.08 15887.94 577.74 11.55<br />
Alternative 1b - BNSF 421.65 2108.26 7730.29 281.10 5.62<br />
Alternative 1b - UP 248.20 1241.02 4550.40 165.47 3.31<br />
Alternative 1b - Passenger 34.04 170.21 624.12 22.70 0.45<br />
Cumulative 703.90 3519.49 12904.81 469.27 9.39<br />
Net Change 162.72 813.58 2983.13 108.48 2.17<br />
As before, emissions from vehicular hours of delay were calculated and added to<br />
emissions from the trains. The calculated vehicular hours of delay per peak day in 2025<br />
are 4,188 for Status Quo and 3,067 for Alternative 1b. The 2025 emission benefits from<br />
eliminated vehicle delay for Alternative 1b were calculated by multiplying total reduced<br />
vehicle hours of delay at grade crossings with emission factors, which were summarized<br />
92
in Table 43. Cumulative emission benefits from Alternative 1b are also presented in this<br />
table.<br />
Table 43: Basin-wide Combined Emission Reduction Benefits from Rail Efficiency<br />
and Vehicle Delay Elimination in 2025, Alternative 1b<br />
(tons)<br />
2025 ROG CO NOx PM SOx<br />
Status Quo – 1.48 18.31 2.89 0.81 0.09<br />
Alternative 1b 1.09 13.41 2.11 0.59 0.07<br />
Benefits 0.40 4.90 0.77 0.22 0.02<br />
Cumulative Benefits 1b 163.11 818.48 2983.90 108.69 2.19<br />
Emission Benefits 2025, Alternative 2<br />
In the year 2025 Alternative 2 concentrates UP freight trains on the UP Alhambra<br />
subdivision <strong>Line</strong> west of Pomona with 85% and on the UP Alhambra <strong>Line</strong> subdivision<br />
east of Pomona with 88% (Figure 6: bold orange route). This alternative in turn shifts a<br />
number of UP trains off the BNSF <strong>Line</strong> between Colton and Cajon Pass and onto the UP<br />
Palmdale <strong>Line</strong> as far north as Silverwood (Figure 2). The Metrolink Riverside passenger<br />
trains remain on the UP San Gabriel <strong>Line</strong> (Figure 6: blue route). The locomotive<br />
emissions (lbs/day) in this scenario were calculated by multiplying the daily power<br />
consumption with the corresponding emission factors, which were derived from the<br />
actual locomotive duty cycles. The daily power consumption was calculated by<br />
multiplying number of trains per day, with average train-hours on regional train routes<br />
(BNSF, UP and passenger), average locomotive cycle horsepower, and the corresponding<br />
number of locomotives per train. In addition pusher locomotives in mountain areas are<br />
accounted for on the specific segments where operated. The daily locomotive emissions<br />
were then annualized (tons/year).<br />
The 2025 benefits from increased rail efficiency for Alternative 2 are 156 tons of ROG,<br />
781 tons of CO, 2865 tons of NOx, 104 tons of PM and 2 tons of SOx, which are<br />
summarized in Table 44.<br />
As before, emissions from vehicular hours of delay were calculated and added to<br />
emissions from the trains. The calculated vehicular hours of delay per peak day in 2010<br />
are 4,188 for Status Quo and 4,101 for Alternative 2. The 2025 emission benefits from<br />
eliminated vehicle delay for Alternative 2 were calculated by multiplying total reduced<br />
vehicle hours of delay at grade crossings with emission factors, which are summarized in<br />
Table 45. Cumulative emission benefits from Alternative 2 also are presented in this<br />
table.<br />
93
Table 44: Basin-wide Emission Reduction Benefits from Rail Efficiency in 2025,<br />
Alternative 2<br />
(tons)<br />
2025 ROG CO NOx PM SOx<br />
Status Quo - BNSF 429.64 2148.18 7876.64 286.42 5.73<br />
Status Quo - UP 406.00 2030.00 7443.33 270.67 5.41<br />
Status Quo - Passenger 30.98 154.90 567.97 20.65 0.41<br />
Cumulative 866.62 4333.08 15887.94 577.74 11.55<br />
Alternative 2 - BNSF 421.65 2108.26 7730.29 281.10 5.62<br />
Alternative 2 - UP 258.62 1293.12 4741.42 172.42 3.45<br />
Alternative 2 - Passenger 30.04 150.22 550.82 20.03 0.40<br />
Cumulative 710.32 3551.60 13022.54 473.55 9.47<br />
Net Change 156.30 781.48 2865.41 104.20 2.08<br />
Table 45: Basin-wide Combined Emission Reduction Benefits from Rail Efficiency<br />
and Vehicle Delay Elimination in 2025, Alternative 2<br />
(tons)<br />
2025 ROG CO NOx PM SOx<br />
Status Quo – 1.48 18.31 2.89 0.81 0.09<br />
Alternative 2 1.45 17.93 2.83 0.79 0.09<br />
Benefits 0.03 0.38 0.06 0.02 0.00<br />
Cumulative Benefits 2 156.33 781.85 2865.47 104.21 2.09<br />
10.3 Summary and Conclusions of Emissions Analysis<br />
Phased implementation of Tier II locomotives by year 2010, ultra-low sulfur diesel fuel<br />
regulations by year 2012 as well as a total of 49 grade separations partially mitigate the<br />
increases in emissions associated with more than doubling the number of train<br />
movements in the Basin from 2000 to 2025. By 2025, SOx emissions will be virtually<br />
eliminated. In 2025 NOx emissions will be either comparable to year 2000 NOx<br />
emissions or as much as 16% lower, depending on routing alternative. However, even<br />
under the most effective routing alternative, ROG and PM10 emissions are projected to<br />
increase by more than 30%, and CO emissions are projected to increase by a factor of<br />
more than four. The very large increase in CO emissions from 2000 to 2025 may be an<br />
anomaly, as it is based on the fact that the EPA Tier II standard for CO emissions is well<br />
in excess (by a factor of 3) of actual Tier I locomotive performance. Actual Tier II<br />
locomotive performance may turn out to be much better than the standard.<br />
In 2010 the alternatives to the Status Quo increase rail efficiency and therefore provide<br />
emission benefits. Additional emission benefits are achieved by reducing vehicular<br />
delays at grade crossings due to the implementation of 11 grade separation projects by<br />
2010. Alternative 1b provides the highest emission reduction benefits, which are<br />
94
projected as follows: 99 tons of ROG; 504 tons of CO; 1802 tons of NOx; 66 tons of PM<br />
and 20 tons of SOx.<br />
Projected 2025 emission benefits take into account the increase in rail efficiency by<br />
rerouting freight trains, imposition of control measures for locomotives, and the<br />
implementation of 49 grade crossing separation projects by 2025. Alternative 1a provides<br />
the highest emission reduction benefits, which are projected as follows: 167 tons of ROG;<br />
839 tons of CO; 3059 tons of NOx; 111 tons of PM and 2 tons of SOx.<br />
Table 46: Future Basin-wide Emission Benefits from the <strong>Main</strong> <strong>Line</strong> Rail Network<br />
(Emission reductions in tons compared to Status Quo Alternative)<br />
ROG CO NOx PM10 SOx<br />
Alternative 2010 2025 2010 2025 2010 2025 2010 2025 2010 2025<br />
1a 92 167 469 839 1671 3059 60.85 111.45 18.52 2.25<br />
1b 99 163 504 818 1802 2984 65.64 108.69 19.99 2.19<br />
2 98 156 491 782 1801 2865 65.50 104.21 19.98 2.09<br />
95
11. Ranking of Alternatives<br />
The routing alternatives are ranked along the dimensions of capital costs for required<br />
Year 2025 infrastructure improvements, total Year 2025 emissions, total Year 2025<br />
population exposure to main-line freight train movements, and total Year 2025<br />
population access to passenger train movements.<br />
Capital Costs<br />
Table 47 ranks capital costs of the alternatives. These are costs for construction of track<br />
capacity improvements necessary to achieve Year 2000 transit times for forecasted Year<br />
2010 and Year 2025 traffic levels.<br />
Table 47.<br />
Estimated Rail Infrastructure Costs by Routing Alternative<br />
(billions of 2004 dollars)<br />
Alternative 2010 2025 Total Total less improvements<br />
already completed<br />
or fully funded<br />
1(b) $1.213 $1.085 $2.298 $2.045<br />
2 $1.269 $1.257 $2.526 $2.273<br />
1(a) $1.187 $1.393 $2.580 $2.327<br />
Status Quo $1.412 $1.195 $2.607 $2.354<br />
Source: <strong>Inland</strong> <strong>Empire</strong> <strong>Main</strong> <strong>Line</strong> Rail <strong>Study</strong>, Interim Report on Task 6, prepared for the Southern<br />
California Association of Governments by Leachman and Associates LLC and Gill V. Hicks & Associates,<br />
Inc., June 18, 2005.<br />
As may be seen, Alternative 1(b) is least expensive, followed by Alternative 2, then<br />
Alternative 1(a), and finally the Status Quo, the most expensive alternative. Total capital<br />
costs left to be spent for Alternative 1(b) are estimated to be 13.1% less than for the<br />
Status Quo. Alternative 2 is next best, about 3.4% less than the Status Quo. Alternative<br />
1(a) is only about 1.1% less.<br />
Emissions<br />
Table 48 ranks emissions of the alternatives. These are estimated tons of emissions per<br />
year from through train operations and from vehicles delayed at grade crossings.<br />
Emissions are categorized by reactive organic gases, carbon monoxide, nitrogen oxides,<br />
particulate matter, and sulfurous oxides.<br />
96
Table 48.<br />
Estimated Total Emissions by Routing Alternative in Year 2025<br />
(tons)<br />
Alternative ROG CO NOx PM10 SOx<br />
1(a) 701 3692 12832 467.1 9.40<br />
1(b) 705 3713 12907 469.9 9.46<br />
2 712 3749 13026 474.4 9.56<br />
Status Quo 868 4531 15891 578.6 11.65<br />
Source: <strong>Inland</strong> <strong>Empire</strong> <strong>Main</strong> <strong>Line</strong> Rail <strong>Study</strong>, Interim Report on Task 7, prepared for the Southern<br />
California Association of Governments by Weston Solutions, Inc. and Gill V. Hicks & Associates, Inc.,<br />
June 18, 2005.<br />
As may be seen, all of the alternatives to the Status Quo are effective at reducing<br />
emissions. There are only very small differences between them, encompassing a range of<br />
80.8 – 82.0% of the Status Quo emissions. The outputs of the various pollutants under<br />
each alternative exhibit almost exactly the same fixed mix, so the ranking of alternatives<br />
is uniform across the pollutant types. Alternative 1(a) is best, reducing emissions from<br />
the Status Quo by approximately 19.2%. Alternative 1(b) is a close second, reducing<br />
emissions from the Status Quo by approximately 18.8%. Alternative 2 reduces emissions<br />
from the Status Quo by approximately 18.0%.<br />
Population Exposure to <strong>Main</strong>-<strong>Line</strong> Freight Train Operations<br />
To analyze population exposure to main-line freight train operations, we estimated the<br />
population living within 0.5 miles of the study-area main lines, and then tallied these<br />
populations for each line segment. These populations were then weighted by the train<br />
traffic density on the line segment as explained below.<br />
The unit of data on population is termed a Traffic Analysis Zone (TAZ). The TAZ<br />
population data was produced by SCAG over a three year period of time commencing in<br />
calendar year 2001. U.S. census data for year 2000 was used as the baseline. In turn,<br />
TAZ data was incorporated into the 2004 Regional Transportation Plan, “Destination<br />
2030”. The 2030 TAZ projections and the methodology used to calculate them can be<br />
found on the SCAG website, WWW.SCAG.CA.GOV. entitled “Destination 2030”,<br />
Appendix A. The appendix is approximately 70 pages long and is referenced herein for<br />
those seeking more detail concerning the forecasting methodology<br />
There are literally hundreds of TAZ’s located along the railroad corridors studied in this<br />
report. Some are less than one mile wide and some are much larger. In developing<br />
population inside a one-mile zone, i.e., one-half mile on either side of the rail corridor,<br />
the relationship of the total TAZ area to the one-mile corridor area was calculated. It was<br />
assumed that the population density was evenly distributed throughout the entire TAZ.<br />
Thus, if a TAZ had a population of 100, and the area within 0.5 miles on each side of the<br />
rail corridor was calculated to be 10% of the total TAZ area, the study projects that 10<br />
people would be impacted by a train passing through that TAZ.<br />
97
After calculating the estimated population impacted by a rail line segment in each TAZ in<br />
years 2000 and 2025, these figures were multiplied by the number of projected train<br />
movements for years 2000 and 2025, respectively, to derive the number of people<br />
impacted as a function of train density.<br />
Table 49 summarizes the total population exposure to peak-day through freight train<br />
movements in 2025. The figures in the table express 2030 population (in millions) living<br />
within 0.5 miles of trackside, multiplied by the number of 2025 peak-day through freight<br />
trains passing by. We term this index the train-weighted population exposure. In the<br />
table, Alternatives 1(a) and 1(b) are not shown separately in the table, as the routings of<br />
freight trains under these two alternatives are identical.<br />
Table 49<br />
Population Exposure to <strong>Main</strong>-<strong>Line</strong> Freight Train Operations<br />
(figures express millions of population multiplied by<br />
peak-day through freight train movements passing within 0.5 miles)<br />
Scenario UP <strong>Line</strong>s BNSF <strong>Line</strong>s Total<br />
2000 Status Quo 14.70 19.03 33.73<br />
2025 Alternatives 1(a), 1(b) 48.51 52.87 101.38<br />
2025 Alternative 2 52.84 52.87 105.70<br />
2025 Status Quo 48.70 57.56 106.26<br />
Regardless of routing alternative, from 2000 to 2025 the total population exposure to<br />
heavy freight train operations in the greater Los Angeles Basin is roughly tripling, due to<br />
an approximate doubling of train traffic juxtaposed on the population growth. Alternative<br />
1 reduces population exposure to heavy freight train operations by about 5% compared to<br />
the Status Quo. Population exposure for Alternative 2 is about the same as for the Status<br />
Quo.<br />
Note that Alternatives 1 and 2 achieve substantial reductions in population exposure on<br />
BNSF <strong>Line</strong>s. This comes from taking UP freight trains out of downtown San Bernardino<br />
and downtown Riverside and re-routing along the more sparsely-populated Palmdale and<br />
Alhambra <strong>Line</strong>s. Alternative 2 suffers an offsetting increase on the UP <strong>Line</strong>s, reflecting a<br />
higher population west of Pomona along the Alhambra <strong>Line</strong> than along the San Gabriel<br />
<strong>Line</strong>.<br />
Population Access to Passenger Train Operations<br />
For passenger trains, we take an opposite view of the exposure metric. Proximity of<br />
population to passenger routes is considered a good thing, because people residing close<br />
to the tracks ought to be more inclined to commute and travel via rail rather than private<br />
98
automobile. Moreover, the more frequent the passenger service, the more likely the<br />
population will use it. 26 A metric similarly computed for passenger trains is termed the<br />
train-weighted population access index. Table 50 summarizes the total population access<br />
to passenger train movements in 2025. The figures in the table express total 2030<br />
population (in millions) living within 0.5 miles of trackside, multiplied by the number of<br />
weekday 2025 passenger trains passing by.<br />
As may be seen, train-weighted population access to passenger services in the greater Los<br />
Angeles Basin will be growing by almost a factor of four over the period 2000 to 2025.<br />
Alternatives 1(a), 2 and the Status Quo have identical scores because routings of<br />
passenger trains among these alternatives are identical. Alternative 1(b) shifts Metrolink<br />
Riverside – Pomona – Los Angeles trains to operate via the Alhambra <strong>Line</strong> west of<br />
Pomona in lieu of the San Gabriel <strong>Line</strong>. In so doing, it increases Basin-wide population<br />
access to passenger services by about 5%.<br />
Summary of Ranking<br />
Table 50<br />
Population Access to Passenger Train Operations<br />
(figures express millions of population multiplied by<br />
weekday passenger train movements passing within 0.5 miles)<br />
Scenario UP <strong>Line</strong>s BNSF <strong>Line</strong>s Total<br />
2000 Status Quo 2.95 5.93 8.88<br />
2025 Alternative 1(b) 14.92 21.53 36.45<br />
2025 Alternative 1(a), 2 13.31 21.53 34.83<br />
2025 Status Quo 13.31 21.53 34.83<br />
Table 51 summarizes the evaluation. Figures are expressed as percentage improvements<br />
over the Status Quo Alternative.<br />
Table 51<br />
Ranking of Routing Alternatives<br />
(Figures express percentage improvement in Year 2025 over Status Quo Alternative)<br />
Alternative Capital Cost Emissions Population Exposure Population Access<br />
To Freight Trains To Passenger Trains<br />
1(a) 1.1% 19.2% 4.6% 0.0%<br />
1(b) 13.1% 18.8% 4.6% 4.7%<br />
2 3.4% 18.0% 0.1% 0.0%<br />
In the dimensions of cost, population exposure to freight trains and population access to<br />
passenger trains, Alternative 1(b) ranks best. In the emissions dimension, Alternative 1(a)<br />
26 We leave aside consideration of other factors that may influence ridership, such as income levels.<br />
99
anks best, but Alternative 1(b) contributes only about 0.6% more emissions. Compared<br />
to the Status Quo, Alternative 1(b) offers about 13% less capital cost, about 19% less<br />
emissions, about 5% less population exposure to main-line freight train operations, and<br />
about 5% more population access to passenger train operations.<br />
100
12. Comments from Stakeholders<br />
The preliminary findings of this study were presented to Metrolink and BNSF in Los<br />
Angeles on April 25, 2005. (BNSF serves as a strategic partner to Metrolink in planning<br />
track capacity for joint passenger and freight operations between Hobart and Colton<br />
Crossing.) Generally, improvements planned on BNSF <strong>Line</strong>s by Metrolink and by this<br />
study were in agreement. The only exceptions were at Colton Crossing. Metrolink and<br />
BNSF are projecting that a grade separation of Colton Crossing will be required by 2010<br />
(whereas this study finds it unnecessary for the 2010 traffic levels but required for the<br />
2025 traffic levels). Metrolink and BNSF also were planning for a flying junction<br />
connection with the UP Yuma <strong>Line</strong> in 2010 (not required in this study’s Status Quo<br />
Alternative for 2010, but required in this study’s Status Quo Alternative for 2025). As of<br />
the date of that meeting, Metrolink and BNSF had not analyzed 2025 traffic levels.<br />
Given this concern, the consulting retrieved the simulation results for Colton Crossing.<br />
These results are summarized as follows:<br />
Scenario/Train Type Fraction of Average Delay (minutes)<br />
Trains Stopped (including trains not delayed)<br />
2000 Base Case<br />
UP trains across crossing 31.4% 1.7<br />
BNSF trains across crossing 36.6% 3.1<br />
2010 Status Quo<br />
UP trains across crossing 63.6% 6.5<br />
BNSF trains across crossing 26.6% 2.0<br />
2010 Alts. to Status Quo<br />
UP trains across crossing 64.1% 11.2<br />
BNSF trains across crossing 30.1% 2.6<br />
Note that the simulated stoppages of BNSF trains decline slightly in 2010. This is<br />
because the BNSF <strong>Line</strong> is planned to have three main tracks across Colton Crossing in<br />
2010, but it had only two main tracks in the Year 2000 Base Case. Note also that delays<br />
at Colton Crossing in 2010 are higher for UP trains and slightly higher for BNSF trains<br />
under the Alternatives to the Status Quo than under the Status Quo. This is evidently<br />
because of congestion at West Colton backing up along the UP <strong>Line</strong> to Colton Crossing.<br />
(The junction with the UP Palmdale <strong>Line</strong> at West Colton is planned to remain as is in the<br />
2010 scenarios but is planned become a full flying junction in the 2025 scenarios.)<br />
The consultant’s conclusion is that an at-grade crossing at Colton is feasible for the 2010<br />
traffic levels assumed in this study, provided the BNSF <strong>Line</strong> is equipped with three main<br />
tracks. However, this configuration has little capacity to spare. With almost one third of<br />
BNSF trains getting stopped and almost two thirds of UP trains getting stopped at the<br />
101
crossing, the 2010 traffic levels are close to the maximums that can be accommodated<br />
without grade separation. So the BNSF – Metrolink proposal to implement the separation<br />
in 2010 is not many years early compared to the time when the consultant believes it<br />
would be truly required.<br />
A letter dated April 28, 2005 was received from Metrolink indicating that levels of<br />
passenger service in 2010 and 2025 different than assumed in this study are now being<br />
evaluated. These levels of service are as follows. (Figures include both Amtrak and<br />
Metrolink services. New Metrolink figures are cited first, assumptions of this study are<br />
second.)<br />
<strong>Line</strong> Segment 2010 2025<br />
BNSF Hobart – Fullerton 72 compared with 96 118 compared with 106<br />
BNSF Atwood – Riverside 42 compared with 38 82 compared with 62<br />
BNSF Riverside – Colton 24 compared with 24 40 compared with 36<br />
Considering the time and budget limitations of this study, the consultant was unable to redo<br />
the operational analysis for these new passenger train frequencies.<br />
A second presentation of the preliminary findings was made to BNSF management in<br />
Fort Worth, TX on May 5, 2005. This time, the discussion was focused on track capacity<br />
improvements between San Bernardino and Barstow. BNSF’s plans for 2010 call for<br />
three main tracks on their line between those points. This study plans for three main<br />
tracks Summit – Barstow, but it plans a fourth main track San Bernardino – Summit<br />
(Status Quo Alternative), and it plans three main tracks San Bernardino – Summit plus<br />
integration of the UP Palmdale <strong>Line</strong> with the BNSF <strong>Line</strong> between Devore Road and<br />
Silverwood and a fourth main track Silverwood – Summit (Alternatives to the Status<br />
Quo). As discussed in section 7 of this report, while the three-main-track configuration<br />
proposed by BNSF is indeed feasible, average freight train running times are predicted to<br />
be about 15 minutes longer than in the Year 2000 Base Case. The increased levels of<br />
improvements planned in this study are believed to be necessary to achieve Year 2000<br />
transit times for the Year 2010 forecasts. As of the date of that meeting, BNSF had not<br />
analyzed 2025 traffic levels.<br />
BNSF management also remarked that productivity improvements they are striving to<br />
achieve may temper train movement growth. They indicated that in 2004, BNSF<br />
intermodal unit volume (trailers and containers) to and from Southern California<br />
increased by about 14%, yet the number of intermodal trains operated increased by less<br />
than 4%.<br />
A presentation of the preliminary findings was made to UP management in Omaha, NE<br />
on May 6, 2005. In general, UP management concurred with the planned improvements.<br />
UP indicated that a similar plan had been jointly presented by UP and BNSF two years<br />
ago to MTA, with copy to SCAG. (The consultant of this study has not seen that plan.)<br />
UP also indicated that their plans for accommodating 2010 traffic levels call for<br />
102
increasing the percentage of UP train movements routed via the Alhambra <strong>Line</strong> between<br />
Colton and Pomona, and decreasing the percentage routed via the San Gabriel <strong>Line</strong>. This<br />
is consistent with the Alternatives to the Status Quo formulated in this study. Complete<br />
double-tracking of the San Gabriel <strong>Line</strong> between West Riverside and Pomona was seen<br />
by UP management as unrealistic, whereas double-tracking the Alhambra <strong>Line</strong> between<br />
West Colton and Pomona was more practical and part of their plan. UP management<br />
indicated that, in general, making capacity improvements in Southern California is much<br />
more difficult than elsewhere on their system, given the environmental reports and other<br />
requirements. As a result, no near-term track capacity improvements are planned by UP<br />
for the Los Angeles Basin, and their near-term capacity improvement projects are being<br />
undertaken elsewhere.<br />
103
XX_SGxx_S0 (a, b)<br />
XX_SGxx_D1 (a, b)<br />
XX_SGxx_D2 (a, b)<br />
XX_SGxx_T1 (a, b)<br />
XX_SGxx_T2 (a, b)<br />
XX_SGxx_T3 (a, b)<br />
XX_SGxx_ST (a, b)<br />
XX_SGxx_BF (a, b)<br />
XX_SGxx_DM )<br />
XX_JTxx_xx(c)<br />
Single Track<br />
Double Track<br />
Triple Track<br />
Station<br />
Buffer<br />
Dummy segment with zero length<br />
Junction/ Switch<br />
• ‘a’ : speed limit for passenger trains. (miles/hour)<br />
‘b’ : speed limit for freight trains. (miles/hour)<br />
‘c’ : speed limit for both passenger and freight trains. (miles/hour)<br />
• ‘XX’ : has values ‘UA’, ’US’, ’BF’ or ‘DT’.<br />
‘UA’ stands for the UP-Alhambra line.<br />
‘US’ stands for the UP-San Gabriel line.<br />
‘BF’ stands for the BNSF line.<br />
‘DT’ stands for downtown line near Redondo Tower.<br />
• ‘xx’: the track index number. Range 0-99<br />
104<br />
Appendix. Year 2000<br />
Trackage Network
- 2.00<br />
-1.70<br />
-1.50<br />
1.80<br />
1.65<br />
DT_SG10_ST<br />
(15,15)<br />
Length = 1.52<br />
- 0.45<br />
- 0.35<br />
- 0.15<br />
0.2<br />
US_SG1_ST(10,10)<br />
US_SG3_D1 (15,15)<br />
US_SG3_D2(15,15)<br />
US_SG8_D1(15,15)<br />
US_SG8_D2(15,15)<br />
US_SG10_D1(70,30)<br />
US_SG10_D2(70,30)<br />
fl<br />
UP-San Gabriel <strong>Line</strong><br />
5-1<br />
To CP Dayton Taylor Yard<br />
›<br />
US_JT1_1(25)<br />
US_JT1_2(25)<br />
US_JT2_1(25)<br />
US_JT2_2(25)<br />
UA_SG1_T1 (10,10)<br />
UA_SG1_T2 (10,10)<br />
length = 0.5<br />
UA_SG1_T3 (10,10)<br />
length = 0.4<br />
US_JT3_1(25)<br />
Yuma JCT<br />
US_JT4_1(25)<br />
US_JT4_2(25)<br />
Pasadena<br />
JCT<br />
US_JT9_1(25)<br />
US_JT9_2(25)<br />
First St.<br />
JCT<br />
UA_JT2_1(25)<br />
482.60<br />
482.80<br />
UA_JT3_1(25)<br />
UA_JT3_2(25)<br />
DT_SG11_ST(45,45)<br />
Length = 1.52<br />
UA_SG7_D1 (20,20)<br />
UA_SG7_D2 (20,20)<br />
LATC<br />
1.13<br />
UA_SG7_ST(10,10)<br />
UP – Alhambra <strong>Line</strong> ( 7-1 )<br />
105<br />
1.52<br />
Metro Link<br />
San Bernardino <strong>Line</strong><br />
483.52<br />
UA_JT4_1(25)<br />
UA_JT4_2(25)<br />
UA_JT4_3(25)<br />
UA_SG8_T1(20,20)<br />
UA_SG8_T2(20,20)<br />
UA_SG8_T3(20,20)<br />
0.41<br />
483.93<br />
UA_JT4_4(25)<br />
�West Colton<br />
1.69<br />
485.00<br />
UA_SG10_D1(30,30)<br />
UA_SG10_D2(30,30)
485.00<br />
Los Angeles �<br />
485.62<br />
UA_JT5_1 (25)<br />
UA_JT5_2 (25)<br />
Valley Blvd.<br />
X-Over<br />
486.94<br />
Aurant<br />
X-Over<br />
488.39<br />
Alhambra<br />
Metro Link<br />
Los Angeles �<br />
106<br />
493.53<br />
UP – Alhambra <strong>Line</strong> ( 7-2 )<br />
Metro Link<br />
� San Bernardino<br />
CP El Monte<br />
CP<br />
494.99 496.93 498.45<br />
CP Bassett<br />
CP<br />
499.00<br />
�West Colton<br />
1.69 1.32<br />
1.45 1.52 1.29 2.27 1.52/1.46 1.94 1.52<br />
1.43<br />
UA_SG10_D1(30,30)<br />
UA_SG10_D2(30,30)<br />
UA_SG12_D1(50,50)<br />
UA_SG12_D2(50,50)<br />
UA_JT7_1(25)<br />
UA_JT7_2(25)<br />
UA_SG14_D1(50,50<br />
UA_SG14_D2(50,50<br />
489.91 491.20<br />
UA_JT9_1(60) UA_JT11_1(25) UA_JT11_2(25) UA_JT15_1(25) UA_JT15_2(25)<br />
UA_SG16_S0(50,50) UA_SG18_S0(40,30) UA_SG20_S0<br />
(65,60)<br />
EL_SG10_ST(10,10)<br />
UA_SG22_BF(65,60)<br />
UA_SG22_S0(65,60)<br />
495.1<br />
UA_JT13_1(40)<br />
UA_SG24_S0<br />
(65,60)<br />
DT_SG16_ST(10,10)<br />
UA_SG26_S0(65,60)<br />
UA_SG26_BF(65,60)<br />
UA_SG28_S0(<br />
65,60)
499.00<br />
499.88<br />
Los Angeles �<br />
CP<br />
City of<br />
Industry<br />
502.68<br />
Marne<br />
X-Over<br />
503.94<br />
Marne<br />
107<br />
506.52<br />
UA_JT25_1(25)<br />
CP<br />
507.81<br />
UA_JT25_2(25)<br />
Walnut<br />
CP<br />
1.43 2.54 / 1.52<br />
1.52 2.35 1.52 1.52 1.2 1.2<br />
1.53<br />
UA_SG28_S0(65,60)<br />
500.90<br />
UA_JT17_1(25) UA_JT21_1(25) UA_JT17_2(25)<br />
UA_SG29_D1(65,60)<br />
UA_SG29_D2(10,10)<br />
UA_SG30_ST(10,10)<br />
502.42<br />
UA_JT21_2(25)<br />
UA_JT19_1(15) UA_JT19_2(15)<br />
UA_SG31_D1(65,60)<br />
UA_SG31_D2(10,10)<br />
UA_SG33_S0(65,60)<br />
UA_SG36_BF<br />
(25,25)<br />
UA_SG36_S0<br />
(65,60)<br />
UP – Alhambra <strong>Line</strong> ( 7-3 )<br />
UA_SG40_S0(65,60)<br />
UA_SG41_S0<br />
(65,60)<br />
UA_SG42_S0<br />
(65,60)<br />
�West Colton<br />
UA_SG43_S0(65,60)<br />
513.00
Los Angeles � UA_JT30_1(40) UA_JT30_3(40)<br />
UP-Alhambra<br />
UA_JT30_4(40)<br />
Los Angeles �<br />
UP-San Gabriel<br />
UP-San Gabriel<br />
1.53<br />
30.6 (UP- San Gabriel)<br />
513.25<br />
(30.85)<br />
513.21<br />
(30.81)<br />
UA_SG43_S0(65,60)<br />
US_SG62_D1(70,60)<br />
US_SG62_D2(70,60)<br />
UA_JT30_2(40)<br />
0.4<br />
US_SG64_S0(70,65)<br />
513.65<br />
(31.25)<br />
Platform<br />
514.3<br />
(31.9)<br />
Pomona<br />
0.2<br />
US_SG65_ST(70,65)<br />
515.08<br />
(32.68)<br />
UA_JT30_5(25)<br />
UA_JT30_6(25)<br />
1.52<br />
515.37<br />
(32.97)<br />
UA_JT30_7(25)<br />
UA_SG45_S0(65,60) UA_SG47_S0(65,60) UA_SG48_ST(65, UA_SG50_S0(25,25)<br />
60)<br />
0.44 (30.81 – 31.25)<br />
0.29<br />
US_SG66_S US_SG67_S US_SG68_S US_SG<br />
US_SG63_S0(70,65) 0(70,65) T(70,65) 0(70,65) 69_S0(<br />
70,65)<br />
1.87(30.81 - 32.68)<br />
2.34<br />
UP – Alhambra <strong>Line</strong> (7-4 )<br />
UP - San Gabriel <strong>Line</strong> ( 5-3 )<br />
108<br />
0.2<br />
US_SG70_S0(70,65)<br />
UA_SG51_S0(65,60)<br />
UP-Alhambra<br />
UP-San Gabriel<br />
1.37<br />
�West Colton<br />
�Riverside<br />
33.6<br />
(UP-San Gabriel)
516.00<br />
516.94<br />
Los Angeles �<br />
1.37<br />
UA_SG51_S0<br />
(65,60)<br />
UA_JT40_1(25)<br />
CP<br />
1.52<br />
UA_SG53_S0(65,60)<br />
UA_SG53_BF(30,30)<br />
518.2<br />
UA_JT40_2(25)<br />
Montclair<br />
519.69<br />
UA_JT41_1(25)<br />
CP<br />
Ontario<br />
Station<br />
520.85<br />
UA_JT41_2(25)<br />
Ontario<br />
UP – Alhambra <strong>Line</strong> (7-5 )<br />
109<br />
523.49<br />
Guasti<br />
524.71<br />
CP<br />
525.80<br />
1.23 1.52 1.52 1.52 1.55 1.52<br />
UA_SG57_S0(65,60)<br />
UA_SG55_S0(65,60)<br />
UA_SG57_ST(30,30)<br />
UA_SG59_S0(65,60)<br />
UA_JT42_1(25)<br />
UA_SG60_S0(65,60)<br />
UA_SG60_BF(30,30)<br />
UA_JT42_2(25)<br />
CP<br />
UA_SG62_S0(65,60)<br />
UA_JT43_1(25)<br />
UA_SG63_S0(65,60)<br />
UA_SG63_BF(30,30)<br />
527.17<br />
UA_JT43_2(25)<br />
Vina Vista<br />
527.20<br />
�West Colton<br />
0.18<br />
UA_SG65_S<br />
0<br />
(65,60)
527.20<br />
0.18<br />
UA_SG65_<br />
S0(65,60)<br />
527.50<br />
UA_JT45_1(25)<br />
Los Angeles �<br />
Kaiser<br />
1.79<br />
UA_SG70_BF(30,30)<br />
UA_SG70_S0(65,60)<br />
529.29<br />
UA_JT45_2(15)<br />
UA_JT45_3(15)<br />
CP<br />
1.52<br />
UA_SG71_D1 (30,30)<br />
1.21<br />
UA_SG71_D2(65,60)<br />
530.50<br />
UA_JT50_1(25)<br />
530.81<br />
UA_JT45_4(25)<br />
CP<br />
South Fontana<br />
532.50<br />
UA_JT50_2(25)<br />
533.50<br />
UA_JT50_3(25)<br />
UA_JT50_4(25)<br />
West Colton<br />
Receiving<br />
UP – Alhambra <strong>Line</strong> (7 -6 )<br />
110<br />
CP<br />
Sierra<br />
534.70 537.70<br />
West Colton<br />
Departure<br />
2.00 1.52 1.68 2.00<br />
0.90<br />
UA_SG72_D1<br />
(65,60)<br />
UA_SG72_D2<br />
(10,10)<br />
UA_SG73_D1 (60,50)<br />
UA_SG73_D2 (10,10)<br />
UA_SG73_ST (10,10)<br />
534.02<br />
UA_JT50_5(25)<br />
UA_JT50_6(25)<br />
UA_JT50_7(25)<br />
UA_SG74_D1<br />
(60,50)<br />
UA_SG74_D2<br />
(25,25)<br />
535.70<br />
UA_JT51_1(25)<br />
536.70<br />
UA_JT51_4(25)<br />
UA_SG75_D1 (50,50)<br />
UA_SG75_D2 (25,25)<br />
UA_SG75_ST (10,10)<br />
UA_JT51_2(25)<br />
UA_JT51_3(25)<br />
To Palmdale<br />
DT_SG30_ST (20,20)<br />
537.80<br />
UA_JT52_1(25)<br />
UA_JT53_1<br />
(10)<br />
UA_JT53_2(25)<br />
UA_SG80_D1 (50,50)<br />
UA_SG80_D2 (50,50)<br />
537.90<br />
UA_JT52_2<br />
(25)<br />
UA_JT53_3<br />
(10)<br />
538.00
From BNSF<br />
(7-6)<br />
203.00<br />
(8.00)<br />
Riverside �<br />
1.50<br />
BN_SG87_T<br />
1(60,50)<br />
BN_SG87_T<br />
2(60,50)<br />
BN_SG87_T<br />
3(60,50)<br />
6.80<br />
0.20<br />
BN_SG88_T1(<br />
50,40)<br />
BN_SG88_T2(<br />
50,40)<br />
BN_SG88_T3(<br />
50,40)<br />
6.60<br />
204.69<br />
(6.31)<br />
BN_JT40_1(50)<br />
BN_JT40_2(50)<br />
High Grove<br />
0.29<br />
BN_SG89_S0(<br />
60,50)<br />
2.20<br />
BN_SG90_D1(60,50)<br />
BN_SG90_D2(60,50)<br />
206.80<br />
(4.20)<br />
BN_JT42_1(50)<br />
BN_JT42_2(50)<br />
207.16<br />
(3,84)<br />
4.40<br />
BN_JT42_3(50)<br />
UA_SG80_S0 (20,20)<br />
Length = 1. 0<br />
UA_SG81_S0 (15,15)<br />
Length = 0.5<br />
UA_SG82_T3 (20,20)<br />
Length = 0.5<br />
UA_JT60_3(25)<br />
1.20<br />
BN_SG91_D1(40,40)<br />
BN_SG91_D2(40,40)<br />
From UP-Alhambra<br />
<strong>Line</strong> (7-6)<br />
207.80<br />
(3.20)<br />
UA_SG80_D1 (50,50)<br />
UA_SG80_D2 (50,50)<br />
UA_SG81_T1 (30,30)<br />
UA_SG81_T2 (30,30)<br />
UP – Alhambra <strong>Line</strong> (7- 7)<br />
BNSF (7-7)<br />
111<br />
fl To Yuma<br />
0.40<br />
UA_SG82_T1 (60,50)<br />
UA_SG82_T2 (60,50)<br />
UA_SG83_D1 (60,50)<br />
UA_SG83_D2 (60,50)<br />
UA_SG84_ST (20,20)<br />
› To Los Angeles.<br />
UA_SG81_T3 (30,30)<br />
Length = 1.52<br />
0.90<br />
UA_JT60_1(25)<br />
UA_JT60_2(25)<br />
1.2<br />
UA_JT60_4(25)<br />
1.52<br />
208.02<br />
(2.98)<br />
BN_JT43_1(25)<br />
BN_SG92_D1(30,30)<br />
BN_SG92_D2(30,30)<br />
Length = 0.22<br />
538.00<br />
538.60<br />
542.00<br />
� To Cajon<br />
BN_SG98_ST(10,10)<br />
Length = 1.52<br />
539.00<br />
BNSF/UP/<br />
METROLINK<br />
540.2<br />
541.72
-- 1.80--<br />
0.00<br />
US_JT10_1(25)<br />
US_JT10_2(25)<br />
US_JT11_1(25)<br />
1.90<br />
Alameda Corridor �<br />
US_SG10_D1(70,30)<br />
US_SG10_D2(70,30)<br />
1.65<br />
Ninth St.<br />
JCT<br />
2.03<br />
US_JT11_2(25)<br />
Soto St. JCT<br />
2.77<br />
-- 1.52--<br />
-- 0.48--<br />
-- 0.3 -- -- 0.34 --<br />
US_SG16_S0(30,20)<br />
US_SG15_D1(30,20) US_SG17_S0(45,40) US_SG18_S0(35,35)<br />
US_SG13_D1(30,20) US_SG15_D2(30,20) US_SG19_D1(30,20)<br />
US_SG13_D2(10,10)<br />
2.13<br />
US_JT15_1(25)<br />
US_JT15_2(25)<br />
-- 0.64 --<br />
US_SG19_D2(10,10)<br />
-- 0.74 --<br />
US_JT16_1(15)<br />
US_JT16_2(15)<br />
US_JT16_3(25)<br />
UP – San Gabriel <strong>Line</strong> (5-1)<br />
112<br />
East Yard<br />
-- 1.54 -- -- 1.54 --<br />
US_SG22_D1<br />
(35,35)<br />
US_SG22_D2<br />
(20,20)<br />
-- 1.52 --<br />
US_SG23_D1<br />
(35,35)<br />
US_SG23_D2<br />
(20,20)<br />
US_JT17_1(60)<br />
US_JT17_2(25)<br />
US_JT17_3(25)<br />
5.85<br />
-- 1.38 --<br />
US_JT19_1(60)<br />
US_JT19_2(15)<br />
US_SG25_BF(35,35)<br />
US_SG26_T1(35,35)<br />
US_SG20_ST(10,10) US_SG26_T2(20,20)<br />
US_SG26_T3(10,10)<br />
7.23 7.36<br />
-- 0.130 --<br />
US_SG28_<br />
D1(35,35)<br />
US_SG28_<br />
D2(35,35)<br />
US_JT20_1(60)<br />
US_JT20_2(60)<br />
-- 0.10 --<br />
Montebello<br />
Station<br />
-- 1.35 --<br />
US_SG30_S0(35,35)<br />
US_SG29_<br />
S0(35,35)<br />
US_SG30_<br />
ST(35,35)<br />
8.00<br />
� Riverside
1.48<br />
8.00<br />
8.71<br />
East<br />
Montebello<br />
0.49<br />
US_SG32_<br />
S0<br />
(70,65)<br />
9.20<br />
US_JT22_1(40) US_JT24_1(25)<br />
Los Angeles �<br />
US_SG30_S0(35,35)<br />
US_SG31_S0<br />
(35,35)<br />
CP<br />
0.90<br />
US_SG33_<br />
S0<br />
(70,65)<br />
US_SG35_BF (20,20)<br />
10.8<br />
US_JT24_2(25)<br />
Pico Rivera<br />
CP<br />
0.70<br />
US_SG34_S0<br />
(65,60)<br />
0.56<br />
11.36<br />
US_JT26_1(40)<br />
US_SG38_<br />
S0<br />
(70,65)<br />
Bartolo<br />
CP<br />
US_SG40_<br />
D1<br />
(79,65)<br />
13.54 14.00<br />
0.46<br />
US_SG<br />
41_S0<br />
(70,<br />
65)<br />
1.86<br />
0.90<br />
US_SG<br />
42_S0<br />
(79,<br />
65)<br />
14.9 15.4<br />
0.50<br />
US_SG<br />
43_S0<br />
(70,<br />
65)<br />
113<br />
18.44<br />
US_JT26_2(40)<br />
US_JT26_3(40)<br />
Puente JCT.<br />
UP – San Gabriel <strong>Line</strong> (5-2)<br />
23.00 23.80<br />
25.48<br />
US_JT26_4(40)<br />
Industry<br />
Station<br />
2.18 1.52 1.52 1.52 1.52 1.52 0.80 1.68<br />
US_SG US_SG US_SG US_SG US_SG US_SG US_SG<br />
48_D1 49_D1 50_D1 51_D1 52_D1 53_D1 54_ST<br />
(79, (79, (79, (79, (79, (65, (70,<br />
65) 65) 65) 65) 65) 65) 65)<br />
US_SG40_<br />
US_SG US_SG US_SG US_SG US_SG US_SG US_SG<br />
D2<br />
(70,65)<br />
US_SG44_S0(70,65) 48_D2 49_D2 50_D2 51_D2 52_D2 53_D2 54_S0<br />
(70, (70, (70, (70, (70, (65, (70,<br />
65) 65) 65) 65) 65) 65) 60)<br />
Diamond<br />
Bar CP<br />
2.27<br />
US_SG60_S0<br />
(70,60)<br />
27.75<br />
US_JT28_1(40)<br />
Sandra<br />
CP<br />
30.51<br />
US_JT28_2(40)<br />
US_JT28_3(40)<br />
30.60<br />
� Riverside<br />
1.53<br />
US_SG61_D1<br />
(70,60)<br />
US_SG61_D2<br />
(70,60)<br />
29.28<br />
1.53<br />
US_SG<br />
62_D1<br />
(70,<br />
60)<br />
US_SG<br />
62_D2<br />
(70,<br />
60)
Los Angeles � UA_JT30_1(40) UA_JT30_3(40)<br />
UP-Alhambra<br />
UA_JT30_4(40)<br />
Los Angeles �<br />
UP-San Gabriel<br />
UP-San Gabriel<br />
1.53<br />
513.25<br />
(30.85)<br />
513.21<br />
(30.81)<br />
UA_SG43_S0(65,60)<br />
US_SG62_D1(70,60)<br />
US_SG62_D2(70,60)<br />
30.6 (UP- San Gabriel)<br />
UA_JT30_2(40)<br />
0.4<br />
UA_SG45_S0(65,60)<br />
0.44 (30.81 – 31.25)<br />
US_SG63_S0(70,65)<br />
US_SG64_S0(70,65)<br />
513.65<br />
(31.25) 515.08<br />
(32.68)<br />
Platform<br />
Pomona<br />
1.87(30.81 - 32.68)<br />
514.3<br />
(31.9)<br />
1.72<br />
UA_JT30_5(25)<br />
UA_JT30_6(25)<br />
UA_SG47_S0(65,60)<br />
US_SG66_S US_SG67_S<br />
0(70,65) T(70,65)<br />
US_SG65_ST(70,65)<br />
515.37<br />
(32.97)<br />
UA_JT30_7(25)<br />
0.29<br />
US_SG68_S US_SG<br />
0(70,65) 69_S0(<br />
70,65)<br />
114<br />
0.2<br />
UA_SG50_S0(25,25)<br />
2.34<br />
US_SG70_S0(70,65)<br />
UP - San Gabriel <strong>Line</strong> ( 5-3 )<br />
UP – Alhambra <strong>Line</strong> (7-4 )<br />
UA_SG51_S0(65,60)<br />
UP-Alhambra<br />
UP-San Gabriel<br />
1.37<br />
�West Colton<br />
�Riverside<br />
33.6<br />
(UP-San Gabriel)
33.60<br />
Los Angeles �<br />
2.34<br />
35.02<br />
East<br />
Montclair<br />
US_SG70_S0(70,65)<br />
US_JT30_1(25)<br />
US_SG74_BF(10,10)<br />
US_SG75_<br />
S0(70,65)<br />
37.70<br />
US_JT30_2(25)<br />
CP<br />
38.40<br />
Bon<br />
View<br />
41.60<br />
115<br />
46.63<br />
US_SG85_D1(79,65)<br />
48.80<br />
49.86<br />
50.00<br />
Turner Ave. Mira Loma<br />
Space Center<br />
Pedley<br />
� Riverside<br />
Limonite<br />
2.68 0.70 1.60 1.60 1.67 1.68 1.68 2.17 1.06<br />
US_SG76_<br />
S0(70,65)<br />
US_S<br />
G77_<br />
S0(40,<br />
30)<br />
1.34 1.34 0.4 0.30<br />
US_JT31_1(40)<br />
US_S US_SG79_D1(79,65)<br />
G78_<br />
S0(50, US_SG79_D2(70,65)<br />
40)<br />
US_JT31_2(40)<br />
US_JT31_3(40)<br />
US_SG80_<br />
D1<br />
(79,65)<br />
US_SG80_<br />
D2<br />
(70,65)<br />
East Ontario<br />
Station<br />
US_SG82_<br />
ST<br />
(79,65)<br />
US_SG82_<br />
S0<br />
(70,65)<br />
US_SG83_<br />
D1<br />
(79,65)<br />
US_SG83_<br />
D2<br />
(70,65)<br />
US_SG84_<br />
D1<br />
(79,65)<br />
US_SG84_<br />
D2<br />
(70,65)<br />
UP – San Gabriel <strong>Line</strong> (5-4)<br />
US_JT31_4(25)<br />
US_JT31_5(25)<br />
US_JT31_6(25)<br />
US_JT31_7(25)<br />
US_SG85_D2(70,65)<br />
US_JT31_8(40)<br />
US_SG87_<br />
ST<br />
(79,65)<br />
US_SG87_<br />
S0<br />
(70,65)<br />
Pedley<br />
Station<br />
1.84<br />
US_<br />
SG89<br />
_S0<br />
(70,65<br />
)
Los Angeles�<br />
UP,San Gabriel<br />
5-4<br />
Los Angeles �<br />
BNSF (7-5)<br />
50.00 (UP-SG)<br />
199 (BNSF)<br />
(12.00)<br />
51.70<br />
52.60 55.50 56.50<br />
US_JT40_1(40)<br />
US_JT40_2(40)<br />
Arlington<br />
UP-San Gabriel<br />
BN_SG77_D1(45,40)<br />
BN_SG78_D1(60,50)<br />
BNSF<br />
BN_SG77_D2(45,40)<br />
len=0.7 (12.5 – 11.8)<br />
11.8<br />
BNSF<br />
56.62 (UP-San Gabriel) = 10.7 (BNSF) = 200.3<br />
US_JT40_3(40)<br />
BN_SG78_D2(60,50)<br />
len=1.1 (11.8 – 10.7)<br />
200.28<br />
10.72<br />
56.60<br />
US_JT40_4(40)<br />
BN_JT30_1(40)<br />
BN_JT30_2(40)<br />
200.43<br />
10.57<br />
1.84<br />
0.8<br />
1.9 0.2<br />
- 0.9 - US_S<br />
G92_ US_SG9 US_SG9<br />
S0(70, 3_D1(60, 4_D1(55, 1.00<br />
200.30<br />
10.70<br />
0.32<br />
US_<br />
60) 55) 50)<br />
US_SG95<br />
US_SG97_S0(10,10)<br />
US_SG89_S0 SG<br />
_S0(55,50)<br />
(70,65) 90_ US_SG9 US_SG9 US_SG9<br />
S0( 1_S0(65, 3_D2(60, 4_D2(55,<br />
US_SG96_S0(45,45)<br />
60, 60) 55) 50)<br />
60)<br />
0.50 1.2<br />
0.1<br />
BN_JT30_4(40)<br />
BN_JT30_5(25)<br />
BN_JT30_3(40)<br />
116<br />
Riverside Area<br />
BN_JT30_6(25)<br />
200.48 200.80<br />
10.52 10.20<br />
200.52<br />
10.48<br />
BN_SG<br />
81_S0<br />
(10,10)<br />
len=0.2<br />
BN_SG82_ST<br />
(10,10)<br />
len=1.52<br />
BN_SG79_D1(60,50)<br />
BN_SG79_D2(60,50)<br />
len=1.1 (10.7 – 9.60)<br />
Passenger Platform<br />
200.84 – 200.98<br />
(10.02 – 10.16)<br />
BN_SG80_S0(60,50)<br />
len=0.7 (10.5 – 9.80)<br />
BN_SG81_ST(10,10)<br />
len=1.52<br />
201.2<br />
9.80<br />
UP – San Gabriel <strong>Line</strong> (5-5)<br />
BNSF ( 7-6 )<br />
BN_JT30_7(25)<br />
BN_JT30_8(25)<br />
201.4<br />
9.60<br />
BN_SG83_T1 BN_SG84_T<br />
(55,50) 1(55,50)<br />
BN_SG83_T2<br />
(55,50)<br />
BN_SG83_T3<br />
(55,50)<br />
BN_SG84_T<br />
2(55,50)<br />
BN_SG84_T<br />
3(55,50)<br />
203.00 (BNSF)<br />
(8.00)<br />
BNSF<br />
BNSF<br />
BNSF<br />
� Colton Crossing<br />
9.30<br />
BN_SG85_T1(<br />
60,50)<br />
BN_SG85_T2(<br />
60,50)<br />
BN_SG85_T3(<br />
60,50)<br />
8.50<br />
8.30<br />
BN_SG86_T<br />
1(55,50)<br />
BN_SG86_T<br />
2(55,50)<br />
BN_SG86_T<br />
3(55,50)
144.00<br />
BN_JT1_1(40)<br />
BN_JT1_2(40)<br />
BN_JT1_3(40)<br />
BN_JT1_4(40)<br />
Alameda Corridor<br />
Union Station<br />
DT_SG<br />
10_ST<br />
DT_SG1<br />
_ST<br />
1.52<br />
BN_SG2_<br />
D1<br />
(45,30)<br />
BN_SG2_<br />
D2<br />
(45,30)<br />
BN_SG3_<br />
D1<br />
(45,30)<br />
BN_SG3_<br />
D2<br />
(45,30)<br />
144.82<br />
BN_JT2_1(50)<br />
BN_JT2_2(50)<br />
144.70<br />
144.50<br />
West End<br />
Hobart Yard<br />
0.32<br />
BN_SG4_D1<br />
(79,50)<br />
BN_SG4_D2<br />
(40,40)<br />
BN_SG5_D1<br />
(40,40)<br />
BN_SG5_D2<br />
(40,40)<br />
1.28<br />
146.1<br />
BN_JT3_1(40)<br />
BN_JT3_2(40)<br />
BN_JT3_3(40)<br />
BN_SG6_T1<br />
(79,50)<br />
BN_SG6_T2<br />
(79,50)<br />
BN_SG6_T3<br />
(79,50)<br />
Hobart<br />
Crossover<br />
40 mph<br />
BN_SG8_ST(10,10)<br />
1.00<br />
BN_SG7_T1(79,50)<br />
BN_SG7_T2(79,50)<br />
BN_SG7_T3(79,50)<br />
147.1<br />
BN_JT3_3(50)<br />
147.2<br />
East Entry<br />
Hobart Yard<br />
40 mph<br />
BN_S<br />
G10_T<br />
3(79,50<br />
)<br />
147.3<br />
BN_JT4_3(40)<br />
BN_JT4_4(40)<br />
BN_JT4_1(40)<br />
BN_JT4_2(40)<br />
Commerce<br />
148.3-148.4<br />
BNSF (7-1)<br />
117<br />
148.5<br />
149.8<br />
Bandini<br />
40 mph<br />
152.1<br />
DT JCT.<br />
40 mph<br />
1.4 1.3<br />
1.6<br />
0.70<br />
0.9<br />
BN_SG10_T1(79,50)<br />
BN_SG10_T2(79,50)<br />
BN_SG<br />
11_S0<br />
(79,50)<br />
0.1 0.2<br />
BN_SG12_<br />
ST<br />
(79,50)<br />
BN_JT5_1(50)<br />
1.52<br />
BN_S<br />
G13_S<br />
0(79,50<br />
)<br />
BN_SG14_D1(79,50)<br />
BN_SG14_D2(79,50)<br />
BN_JT6_1(40)<br />
BN_JT6_2(40)<br />
BN_SG15_D1(79,50)<br />
BN_SG15_D2(79,50)<br />
151.4<br />
BN_JT7_1(40)<br />
BN_JT7_2(40)<br />
BN_SG16_D1(65,60)<br />
BN_SG16_D2(65,60)<br />
154.00<br />
153.8<br />
� Riverside<br />
BN_SG17_<br />
D1(70,50)<br />
BN_SG17_<br />
D2(70,50)<br />
153.0<br />
0.8<br />
BN_SG19<br />
_D1(79,50<br />
)<br />
BN_SG19<br />
_D2(79,50<br />
)
154.00<br />
154.20<br />
155.00<br />
BN_JT8_1(40)<br />
BN_JT8_2(40)<br />
0.40<br />
BN_SG20_<br />
D1(70,50)<br />
BN_SG20_<br />
D2(70,50)<br />
Santa Fe<br />
Springs<br />
40 mph<br />
155.8<br />
BN_JT9_1(40)<br />
BN_JT9_2(40)<br />
BN_SG21_D1(79,50<br />
)<br />
BN_SG21_D2(79,50<br />
)<br />
West<br />
Norwalk<br />
40 mph<br />
0.4<br />
Norwalk<br />
Station<br />
156.2 -.3<br />
156.60<br />
BN_JT10_1(40)<br />
BN_JT10_2(40)<br />
East<br />
Norwalk<br />
40mph<br />
157.70<br />
BN_JT11_1(40)<br />
BN_JT11_2(40)<br />
La Mirada<br />
Crossover<br />
40 mph<br />
157.82 160.10 160.30<br />
BN_JT11_3(15)<br />
15 mph Buena Park<br />
Crossover<br />
40 mph<br />
BNSF (7-2)<br />
118<br />
BN_JT11_4(40)<br />
BN_JT11_5(40)<br />
BN_JT11_6(15)<br />
Los Angeles � � Riverside<br />
Buena Park<br />
15 mph<br />
1.52<br />
BN_S BN_SG23_ST<br />
G22_ (10,10)<br />
S0(10,<br />
10)<br />
BN_SG23_D1(75,50)<br />
BN_SG23_D2(75,50)<br />
0.12<br />
1.1<br />
BN_S<br />
G27_<br />
D1(79,<br />
BN_SG26_D1(79,50<br />
50)<br />
)<br />
BN_SG26_D2(79,50 BN_S<br />
2.28<br />
BN_SG28_D1(79,50)<br />
BN_SG28_D2(79,50)<br />
0.70<br />
BN_SG22_ST<br />
(10,10)<br />
BN_S<br />
G25_<br />
S0(10,<br />
10)<br />
) G27_<br />
D2(79,<br />
50)<br />
BN_SG28_BF(10,10)<br />
2.48<br />
BN_SG29_D1(79,50)<br />
BN_SG29_D2(79,50)<br />
160.80<br />
0.30<br />
161.10<br />
BN_SG30_D1(70,<br />
50)<br />
BN_SG30_D2(70,<br />
50)<br />
1.20<br />
162.30<br />
BN_SG32_D1(79,50)<br />
BN_SG32_D2(79,50)<br />
1.20<br />
163.00<br />
BN_SG33_D1<br />
(79,50)<br />
BN_SG33_D2<br />
(79,50)
163.00<br />
163.10<br />
BN_JT13_1(50)<br />
BN_JT13_2(50)<br />
163.2<br />
BN_JT13_3(50)<br />
Los Angeles �<br />
Basta<br />
Crossover<br />
50 mph<br />
Basta<br />
Track#3<br />
50 mph<br />
Fullerton<br />
Station<br />
165.0 -.1<br />
1.20 0.30<br />
1.45<br />
0.55<br />
BN_SG33_D1(79,50)<br />
BN_SG33_D2(79,50)<br />
163.5<br />
163.8<br />
BN_SG34_<br />
D1(79,50)<br />
BN_SG34_<br />
D2(79,50)<br />
BN_SG35_ST<br />
(10,10)<br />
0.15<br />
165.25<br />
BN_JT14_1(40)<br />
BN_SG36_ST(79,50)<br />
BN_SG36_S0(79,50)<br />
BN_SG39_<br />
S0(10,10)<br />
165.30<br />
165.10<br />
BN_JT14_6(40)<br />
165.50<br />
(45.5)<br />
Fullerton East<br />
Crossover<br />
50 mph<br />
MetroLink<br />
To Orange County<br />
& San Diego<br />
BN_SG40_D1(50,50)<br />
BN_SG40_D2(50,50)<br />
BNSF (7-3)<br />
119<br />
165.80<br />
(45.2)<br />
165.44 = LS7600 45.56 =LS7602<br />
167.40<br />
(43.6)<br />
0.9<br />
BN_SG42_<br />
D1<br />
(50,50)<br />
BN_SG42_<br />
D2<br />
(50,50)<br />
168.30<br />
(42.7)<br />
MetroLink<br />
To Orange County<br />
& San Diego<br />
40 mph<br />
1.2<br />
BN_SG45_D1(60,50)<br />
BN_SG45_D2(60,50)<br />
169.50<br />
(41.5)<br />
BN_JT14_4(40) BN_JT16_1(50)<br />
BN_JT14_2(40)<br />
BN_JT16_2(50)<br />
BN_JT14_3(40) BN_JT14_5(40)<br />
1.6<br />
BN_SG41_D1<br />
(60,50)<br />
BN_SG41_D2<br />
(60,50)<br />
169.30<br />
BN_JT16_3(50)<br />
Atwood<br />
50 mph<br />
1.60<br />
BN_SG48_D1(60,<br />
50)<br />
BN_SG48_D2(60,<br />
50)<br />
(39.9) (38.3)<br />
173.00<br />
(38.00)<br />
� Riverside<br />
1.60<br />
BN_SG49_<br />
D1(60,50)<br />
BN_SG49_<br />
D2(60,50)
173.00<br />
(38.00)<br />
(36.7)<br />
175.10<br />
(35.9)<br />
Los Angeles � � Riverside<br />
Esperanza<br />
Crossover<br />
50 mph<br />
175.20<br />
(35.8)<br />
Begin<br />
Track#3<br />
50 mph<br />
177.90<br />
(35.1)<br />
1.6 1.6 0.7 1.60 1.2 0.2<br />
2.00<br />
BN_SG50_D1(60,<br />
50)<br />
BN_SG50_D2(60,<br />
50)<br />
BN_JT17_1(50)<br />
BN_JT17_2(50)<br />
BN_JT18_1(50)<br />
BN_SG51_D2(60,50)<br />
0.7<br />
BN_SG52_S0(60,<br />
50)<br />
BN_SG51_D1(60,50)<br />
BN_SG54_T1(50,45)<br />
BN_SG54_T2(50,45)<br />
BN_SG54_T3(50,45)<br />
179.70<br />
(34.4)<br />
BN_SG55_T1(50,<br />
50)<br />
BN_SG55_T2(50,<br />
50)<br />
BNSF (7-4)<br />
120<br />
179.70<br />
(32.8)<br />
BN_SG55_T3(50,<br />
50)<br />
179.70<br />
(31.6)<br />
179.70<br />
(31.4)<br />
BN_SG56_T1( BN_SG57_T1(55,<br />
60, 50)<br />
50)<br />
BN_SG56_T2( BN_SG57_T2(55,<br />
60, 50)<br />
50)<br />
BN_SG56_T3( BN_SG57_T3(55,<br />
60, 50)<br />
50)<br />
1.90<br />
181.50<br />
(29.5)<br />
BN_JT19_1(50)<br />
BN_SG58_S0(60,50)<br />
End<br />
Track #3<br />
50 mph<br />
BN_SG59_D1(60,50)<br />
BN_SG59_D2(60,50)<br />
181.60<br />
(29.4)<br />
182.00<br />
(29.00)<br />
BN_JT20_1(50)<br />
BN_JT20_2(50)<br />
Prado Dam<br />
Crossover<br />
50 mph<br />
1.48<br />
BN_SG61<br />
_D1<br />
(60,50)<br />
BN_SG61<br />
_D2<br />
(60,50)
182.00<br />
(29.00)<br />
Los Angeles�<br />
1.48<br />
BN_SG61<br />
_D1<br />
(60,50)<br />
BN_SG61<br />
_D2<br />
(60,50)<br />
183.90<br />
(27.1)<br />
Corona<br />
Station<br />
184.00<br />
(27.0)<br />
184.60<br />
(26.4)<br />
186.90<br />
(24.1)<br />
Corona<br />
15 mph<br />
188.50<br />
(22.5)<br />
Porphyry<br />
15 mph<br />
BNSF (7-5)<br />
121<br />
189.60<br />
(21.4)<br />
May<br />
Crossover<br />
192.00 192.60<br />
(19.0) (18.4)<br />
192.70<br />
(18.3)<br />
La Sierra<br />
Station<br />
194.10<br />
(16.7)<br />
195.9<br />
(15.1)<br />
CP 151<br />
Crossover<br />
Arlington<br />
1.52 2.3 1.60 1.1 1.7 1.7<br />
1.6 1.3 1.38<br />
BN_SG62_ST<br />
(60,50)<br />
BN_SG63_ST<br />
(60,50)<br />
BN_JT21_1(15)<br />
BN_JT21_2(15)<br />
BN_SG64_D1<br />
(60,50)<br />
BN_SG64_D2<br />
(60,50)<br />
BN_SG65_D1 (60,50)<br />
BN_SG65_D2 (60,50)<br />
BN_SG65_BF (15,15)<br />
BN_JT22_1(15)<br />
BN_JT23_1(50)<br />
BN_JT23_2(50)<br />
BN_SG66_<br />
D1 (60,50)<br />
BN_SG66_<br />
D2 (60,50)<br />
BN_SG67_<br />
D1 (60,50)<br />
BN_SG67_<br />
D2 (60,50)<br />
BN_SG68_ST<br />
(60,50)<br />
BN_SG69_ST<br />
(60,50)<br />
BN_SG70_<br />
D1 (60,50)<br />
BN_SG70_<br />
D2 (60,50)<br />
BN_SG71_D1<br />
(55,50)<br />
BN_SG71_D2<br />
(55,50)<br />
195.9<br />
(15.4)<br />
BN_JT24_1(50)<br />
BN_JT24_2(50)<br />
BN_SG73_D1<br />
(55,50)<br />
BN_SG73_D2<br />
(55,50)<br />
(14.02)<br />
198.10<br />
(12.5)<br />
199.00<br />
(12.00)<br />
� Riverside<br />
1.52<br />
BN_SG75_D1<br />
(55,50)<br />
BN_SG75_D2<br />
(55,50)
Los Angeles�<br />
UP,San Gabriel<br />
5-4<br />
Los Angeles �<br />
BNSF (7-5)<br />
50.00 (UP-SG)<br />
199 (BNSF)<br />
(12.00)<br />
51.70<br />
52.60 55.50 56.50<br />
US_JT40_1(40)<br />
US_JT40_2(40)<br />
Arlington<br />
UP-San Gabriel<br />
BN_SG77_D1(45,40)<br />
BN_SG78_D1(60,50)<br />
BNSF<br />
BN_SG77_D2(45,40)<br />
len=0.7 (12.5 – 11.8)<br />
11.8<br />
BNSF<br />
56.62 (UP-San Gabriel) = 10.7 (BNSF) = 200.3<br />
US_JT40_3(40)<br />
BN_SG78_D2(60,50)<br />
len=1.1 (11.8 – 10.7)<br />
200.28<br />
10.72<br />
56.60<br />
US_JT40_4(40)<br />
BN_JT30_1(40)<br />
BN_JT30_2(40)<br />
200.43<br />
10.57<br />
1.84<br />
0.8<br />
1.9 0.2<br />
- 0.9 - US_S<br />
G92_ US_SG9 US_SG9<br />
S0(70, 3_D1(60, 4_D1(55, 1.00<br />
200.30<br />
10.70<br />
0.32<br />
US_<br />
60) 55) 50)<br />
US_SG95<br />
US_SG97_S0(10,10)<br />
US_SG89_S0 SG<br />
_S0(55,50)<br />
(70,65) 90_ US_SG9 US_SG9 US_SG9<br />
S0( 1_S0(65, 3_D2(60, 4_D2(55,<br />
US_SG96_S0(45,45)<br />
60, 60) 55) 50)<br />
60)<br />
0.50 1.2<br />
0.1<br />
BN_JT30_4(40)<br />
BN_JT30_5(25)<br />
BN_JT30_3(40)<br />
122<br />
Riverside Area<br />
BN_JT30_6(25)<br />
200.48 200.80<br />
10.52 10.20<br />
200.52<br />
10.48<br />
BN_SG<br />
81_S0<br />
(10,10)<br />
len=0.2<br />
BN_SG82_ST<br />
(10,10)<br />
len=1.52<br />
BN_SG79_D1(60,50)<br />
BN_SG79_D2(60,50)<br />
len=1.1 (10.7 – 9.60)<br />
Passenger Platform<br />
200.84 – 200.98<br />
(10.02 – 10.16)<br />
BN_SG80_S0(60,50)<br />
len=0.7 (10.5 – 9.80)<br />
BN_SG81_ST(10,10)<br />
len=1.52<br />
BN_JT30_7(25)<br />
BN_JT30_8(25)<br />
201.2<br />
9.80<br />
BNSF ( 7-6 )<br />
UP – San Gabriel <strong>Line</strong> (5-5)<br />
201.4<br />
9.60<br />
BN_SG83_T1 BN_SG84_T<br />
(55,50) 1(55,50)<br />
BN_SG83_T2<br />
(55,50)<br />
BN_SG83_T3<br />
(55,50)<br />
BN_SG84_T<br />
2(55,50)<br />
BN_SG84_T<br />
3(55,50)<br />
203.00 (BNSF)<br />
(8.00)<br />
BNSF<br />
BNSF<br />
BNSF<br />
� Colton Crossing<br />
9.30<br />
BN_SG85_T1(<br />
60,50)<br />
BN_SG85_T2(<br />
60,50)<br />
BN_SG85_T3(<br />
60,50)<br />
8.50<br />
8.30<br />
BN_SG86_T<br />
1(55,50)<br />
BN_SG86_T<br />
2(55,50)<br />
BN_SG86_T<br />
3(55,50)
From BNSF<br />
(7-6)<br />
203.00<br />
(8.00)<br />
Riverside �<br />
1.50<br />
BN_SG87_T<br />
1(60,50)<br />
BN_SG87_T<br />
2(60,50)<br />
BN_SG87_T<br />
3(60,50)<br />
6.80<br />
0.20<br />
BN_SG88_T1(<br />
50,40)<br />
BN_SG88_T2(<br />
50,40)<br />
BN_SG88_T3(<br />
50,40)<br />
6.60<br />
204.69<br />
(6.31)<br />
BN_JT40_1(50)<br />
BN_JT40_2(50)<br />
Highgrove<br />
0.29<br />
BN_SG89_S0(<br />
60,50)<br />
2.20<br />
BN_SG90_D1(60,50)<br />
BN_SG90_D2(60,50)<br />
206.80<br />
(4.20)<br />
BN_JT42_1(50)<br />
BN_JT42_2(50)<br />
4.40<br />
207.16<br />
(3,84)<br />
BN_JT42_3(50)<br />
UA_SG80_S0 (20,20)<br />
Length = 1. 0<br />
UA_SG81_S0 (15,15)<br />
Length = 0.5<br />
UA_SG82_T3 (20,20)<br />
Length = 0.5<br />
UA_JT60_3(25)<br />
1.20<br />
BN_SG91_D1(40,40)<br />
BN_SG91_D2(40,40)<br />
From UP-Alhambra<br />
<strong>Line</strong> (7-6)<br />
123<br />
207.80<br />
(3.20)<br />
UA_SG80_D1 (50,50)<br />
UA_SG80_D2 (50,50)<br />
UA_SG81_T1 (30,30)<br />
UA_SG81_T2 (30,30)<br />
fl To Yuma<br />
0.40<br />
UA_SG82_T1 (60,50)<br />
UA_SG82_T2 (60,50)<br />
UA_SG83_D1 (60,50)<br />
UA_SG83_D2 (60,50)<br />
UA_SG84_ST (20,20)<br />
› To Los Angeles.<br />
UA_SG81_T3 (30,30)<br />
Length = 1.52<br />
0.90<br />
UA_JT60_1(25)<br />
UA_JT60_2(25)<br />
1.2<br />
UA_JT60_4(25)<br />
1.52<br />
208.02<br />
(2.98)<br />
BN_JT43_1(25)<br />
BN_SG92_D1(30,30)<br />
BN_SG92_D2(30,30)<br />
Length = 0.22<br />
538.00<br />
538.60<br />
542.00<br />
540.2<br />
541.72<br />
� To Cajon<br />
BN_SG98_ST(10,10)<br />
Length = 1.52<br />
539.00<br />
BNSF/UP/<br />
METROLINK
124
125
126
127
128
129
130
131
132
133
134
135
136
137
138
139
140
141
142
143
Appendix B. Peak-Day Train Counts<br />
Table B-1. Peak-Day Train Counts on BNSF <strong>Line</strong>s, Year 2000 Base Case<br />
8,000 ft<br />
intermodal<br />
6,000 ft<br />
intermodal<br />
5,000 ft<br />
unit<br />
bulk<br />
144<br />
6,000 ft<br />
unit<br />
auto<br />
6,500 ft<br />
carload<br />
500 ft<br />
commuter<br />
passenger<br />
1,000 ft<br />
intercity<br />
passenger Total<br />
Year 2000 Base Case<br />
Barstow - Summit 20.6 33 8.4 8 17.2 0 2 89.2<br />
Summit - Devore Rd. (inclusive)<br />
via BNSF tracks 20.6 33 8.4 8 17.2 0 2 89.2<br />
via UP Palmdale track 0 0 0 0 6.5 0 0 6.5<br />
Devore Rd. - San Bernardino 20.6 33 8.4 8 17.2 0 2 89.2<br />
San Bernardino - Colton Crossing<br />
via <strong>Main</strong>s 1,2 and 3 20.6 29 8.4 6 15.2 0 0 79.2<br />
via <strong>Main</strong> 4 0 0 0 0 0 9 2 11<br />
Colton Crossing – West Riverside 20.6 36.6 8.4 11.4 15.2 9 2 103.2<br />
West Riverside - Atwood 11 29 3 6 8 15 2 74<br />
Atwood - Fullerton 11 29 1 4 5 3 2 55<br />
Fullerton Jct. - Hobart 11 29 1 4 5 44 2 96<br />
Hobart - Redondo 11 11 1 2 2 44 2 73
Table B-2. Peak-Day Train Counts on BNSF <strong>Line</strong>s, Status Quo Routing Alternative<br />
8,000 ft<br />
intermodal<br />
6,000 ft<br />
intermodal<br />
5,000 ft<br />
unit<br />
bulk 6,000 ft unit auto<br />
145<br />
6,500 ft<br />
carload<br />
500 ft<br />
commuter<br />
passenger<br />
1,000 ft<br />
intercity<br />
passenger Total<br />
Year 2010 Status Quo<br />
Barstow – Summit 36.2 48 9.8 9.2 19.3 4 2 128.5<br />
Summit – Devore Rd. (inclusive)<br />
via BNSF tracks 36.2 48 9.8 9.2 19.3 4 2 128.5<br />
via UP Palmdale track 0 0 0 0 7.5 0 0 7.5<br />
Devore Rd. – San Bernardino 36.2 48 9.8 9.2 19.3 4 2 128.5<br />
San Bernardino - Colton Crossing<br />
via <strong>Main</strong>s 1,2 and 3 36.2 42.9 9.8 6.9 17.3 0 0 113.1<br />
via <strong>Main</strong> 4 0 0 0 0 0 22 2 24<br />
Colton Crossing – West Riverside 36.2 55.6 9.8 13.1 17.3 22 2 156<br />
West Riverside - Atwood 19.9 42.9 3.5 6.9 9 36 2 120.2<br />
Atwood - Fullerton 19.9 42.9 1.2 4.6 5.5 18 2 94.1<br />
Fullerton Jct. - Hobart 19.9 42.9 1.2 4.6 5.5 74 2 150.1<br />
Hobart - Redondo 19.9 19.9 1.2 2.3 2 74 2 121.3<br />
Year 2025 Status Quo<br />
Barstow – Summit 62.7 70.4 11.3 11.8 21.7 6 2 185.9<br />
Summit – Devore Rd. (inclusive)<br />
via BNSF tracks 62.7 70.4 11.3 11.8 21.7 6 2 185.9<br />
via UP Palmdale track 0 0 0 0 8.8 0 0 8.8<br />
Devore Rd. – San Bernardino 62.7 70.4 11.3 11.8 21.7 6 2 185.9<br />
San Bernardino - Colton Crossing<br />
via <strong>Main</strong>s 1,2 and 3 62.7 64 11.3 8.1 19.7 0 0 165.8<br />
via <strong>Main</strong> 4 0 0 0 0 0 34 2 36<br />
Colton Crossing – West Riverside 62.7 85.1 11.3 15.4 19.7 34 2 230.2<br />
West Riverside - Atwood 35.2 64 4 8.1 10 60 2 183.3<br />
Atwood - Fullerton 35.2 64 1.3 5.4 6 32 2 145.9<br />
Fullerton Jct. - Hobart 35.2 64 1.3 5.4 6 98 2 211.9<br />
Hobart - Redondo 35.2 35.2 1.3 2.7 2 98 2 176.4
Table B-3. Peak-Day Train Counts on BNSF <strong>Line</strong>s, Routing Alternatives 1a, 1b and 2<br />
8,000 ft<br />
intermodal<br />
6,000 ft<br />
intermodal<br />
5,000 ft<br />
unit<br />
bulk 6,000 ft unit auto<br />
146<br />
6,500 ft<br />
carload<br />
500 ft<br />
commuter<br />
passenger<br />
1,000 ft<br />
intercity<br />
passenger Total<br />
Year 2010 Status Quo<br />
Barstow – Summit 36.2 48 9.8 9.2 19.3 4 2 128.5<br />
Summit – Devore Rd. (inclusive)<br />
via BNSF tracks 24.1 32.0 6.5 6.1 17.9 2.7 1.3 90.7<br />
via UP Palmdale track 12.1 16.0 3.3 3.1 8.9 1.3 0.7 45.3<br />
Devore Rd. – San Bernardino 19.9 48 3.5 9.2 15.6 4 2 102.2<br />
San Bernardino - Colton Crossing<br />
via <strong>Main</strong>s 1,2 and 3 19.9 42.9 3.5 6.9 13.6 0 0 86.8<br />
via <strong>Main</strong> 4 0 0 0 0 0 22 2 24.0<br />
Colton Crossing – West Riverside 19.9 42.9 3.5 11.5 13.6 22 2 115.4<br />
West Riverside - Atwood 19.9 42.9 3.5 6.9 9 36 2 120.2<br />
Atwood - Fullerton 19.9 42.9 1.2 4.6 5.5 18 2 94.1<br />
Fullerton Jct. - Hobart 19.9 42.9 1.2 4.6 5.5 74 2 150.1<br />
Hobart - Redondo 19.9 19.9 1.2 2.3 2 74 2 121.3<br />
Year 2025 Status Quo<br />
Barstow – Summit 62.7 70.4 11.3 11.8 21.7 6 2 185.9<br />
Summit – Devore Rd. (inclusive)<br />
via BNSF tracks 47.0 52.8 8.5 8.9 22.9 4.5 1.5 146.0<br />
via UP Palmdale track 15.7 17.6 2.8 3.0 7.6 1.5 0.5 48.7<br />
Devore Rd. – San Bernardino 35.2 70.4 4 11.8 17.4 6 2 146.8<br />
San Bernardino - Colton Crossing<br />
via <strong>Main</strong>s 1,2 and 3 35.2 64 4 8.1 15.4 0 0 126.7<br />
via <strong>Main</strong> 4 0 0 0 0 0 34 2 36.0<br />
Colton Crossing – West Riverside 35.2 64 4 13.5 15.4 34 2 168.1<br />
West Riverside - Atwood 35.2 64 4 8.1 10 60 2 183.3<br />
Atwood - Fullerton 35.2 64 1.3 5.4 6 32 2 145.9<br />
Fullerton Jct. - Hobart 35.2 64 1.3 5.4 6 98 2 211.9<br />
Hobart - Redondo 35.2 35.2 1.3 2.7 2 98 2 176.4
Table B-4. Peak-Day Train Counts on UP <strong>Line</strong>s, Year 2000 Base Case<br />
8,000 ft<br />
intermodal<br />
6,000 ft<br />
intermodal<br />
5,000 ft<br />
unit<br />
bulk<br />
147<br />
6,000 ft<br />
unit<br />
auto<br />
6,500 ft<br />
carload<br />
500 ft<br />
commuter<br />
passenger<br />
1,000 ft<br />
intercity<br />
passenger Total<br />
Year 2000 Base Case<br />
Devore Rd. - West Colton<br />
(Palmdale <strong>Line</strong>) 0 0 0 0 6.5 0 0 6.5<br />
Indio - Garnet 0 21.6 0 5.4 15 0 2 44<br />
Garnet - Colton Crossing 0 21.6 0 5.4 15 0 2 44<br />
Colton Crossing - West Colton 0 14 0 0 15 0 2 31<br />
West Colton – Pomona<br />
(Alhambra <strong>Line</strong>) 0 14 0 0 9.4 0 2 25.4<br />
Pomona - City of Industry 0 14 0 0 9.4 0 2 25.4<br />
City of Industry - El Monte 0 14 0 0 7.4 0 2 23.4<br />
El Monte - Yuma Jct. 0 14 0 0 7.4 0 0 21.4<br />
Yuma Jct. - Pasadena Jct. 0 10 0 0 4 0 0 14<br />
Pasadena Jct. – Ninth Street 0 10 4.4 0 4 12 0 30.4<br />
West Riverside - Mira Loma 9.6 7.6 5.4 5.4 7.2 12 0 47.2<br />
Mira Loma - Pomona 9.6 7.6 5.4 1.4 7.2 12 0 43.2<br />
Pomona - East Los Angeles (San<br />
Gabriel <strong>Line</strong>) 9.6 7.6 5.4 1.4 7.2 12 0 43.2<br />
East Los Angeles – Ninth Street 7.6 5.6 5.4 0.6 0 12 0 31.2
Table B-5. Peak-Day Train Counts on UP <strong>Line</strong>s, Status Quo Routing Alternative in 2010<br />
8,000 ft<br />
intermodal<br />
6,000 ft<br />
intermodal<br />
5,000 ft<br />
unit<br />
bulk<br />
148<br />
6,000 ft<br />
unit<br />
auto<br />
6,500 ft<br />
carload<br />
500 ft<br />
commuter<br />
passenger<br />
1,000 ft<br />
intercity<br />
passenger Total<br />
Year 2010 Status Quo<br />
Devore Rd. - West Colton<br />
(Palmdale <strong>Line</strong>) 0 0 0 0 6.5 0 0 6.5<br />
Indio - Garnet 0 21.6 0 5.4 15 0 2 44<br />
Garnet - Colton Crossing 0 21.6 0 5.4 15 0 2 44<br />
Colton Crossing - West Colton 0 14 0 0 15 0 2 31<br />
West Colton – Pomona<br />
(Alhambra <strong>Line</strong>) 0 14 0 0 9.4 0 2 25.4<br />
Pomona - City of Industry<br />
(Alhambra <strong>Line</strong>) 0 14 0 0 9.4 0 2 25.4<br />
City of Industry - El Monte 0 14 0 0 7.4 0 2 23.4<br />
El Monte - Yuma Jct. 0 14 0 0 7.4 0 0 21.4<br />
Yuma Jct. - Pasadena Jct. 0 10 0 0 4 0 0 14<br />
Pasadena Jct. – Ninth Street 0 10 4.4 0 4 12 0 30.4<br />
West Riverside - Mira Loma 9.6 7.6 5.4 5.4 7.2 12 0 47.2<br />
Mira Loma - Pomona 9.6 7.6 5.4 1.4 7.2 12 0 43.2<br />
Pomona - East Los Angeles<br />
(San Gabriel <strong>Line</strong>) 9.6 7.6 5.4 1.4 7.2 12 0 43.2<br />
East Los Angeles – Ninth Street 7.6 5.6 5.4 0.6 0 12 0 31.2
Table B-6. Peak-Day Train Counts on UP <strong>Line</strong>s, Status Quo Routing Alternative in 2025<br />
8,000 ft<br />
intermodal<br />
6,000 ft<br />
intermodal<br />
5,000 ft<br />
unit<br />
bulk<br />
149<br />
6,000 ft<br />
unit<br />
auto<br />
6,500 ft<br />
carload<br />
500 ft<br />
commuter<br />
passenger<br />
1,000 ft<br />
intercity<br />
passenger Total<br />
Year 2025 Status Quo<br />
Devore Rd. - West Colton<br />
(Palmdale <strong>Line</strong>)<br />
0 0 0 0 8.8 0 0 8.8<br />
Indio - Garnet 0 59.6 0 7.3 20.2 0 2 89.1<br />
Garnet - Colton Crossing 0 59.6 0 7.3 20.2 6 2 95.1<br />
Colton Crossing - West Colton 0 38.5 0 0 20.2 6 2 66.7<br />
West Colton – Pomona<br />
(Alhambra <strong>Line</strong>)<br />
0 38.5 0 0 10.6 6 2 57.1<br />
Pomona - City of Industry<br />
0 38.5 0 0 10.6 6 2 57.1<br />
(Alhambra <strong>Line</strong>)<br />
City of Industry - El Monte 0 38.5 0 0 8.6 6 2 55.1<br />
El Monte - Yuma Jct. 0 38.5 0 0 8.6 0 0 47.1<br />
Yuma Jct. - Pasadena Jct. 0 32.1 0 0 4 0 0 36.1<br />
Pasadena Jct. – Ninth Street 0 32.1 5.9 0 4 36 0 78<br />
West Riverside - Mira Loma 27.5 21.1 7.3 7.3 9.7 36 0 108.9<br />
Mira Loma - Pomona 27.5 21.1 7.3 1.9 9.7 36 0 103.5<br />
Pomona - East Los Angeles<br />
(San Gabriel <strong>Line</strong>)<br />
27.5 21.1 7.3 1.9 9.7 36 0 103.5<br />
East Los Angeles – Ninth Street 24.3 17.9 7.3 0.8 0 36 0 86.3
Table B-7. Peak-Day Train Counts on UP <strong>Line</strong>s, Routing Alternative 1a in 2010<br />
8,000 ft<br />
intermodal<br />
6,000 ft<br />
intermodal<br />
5,000 ft<br />
unit<br />
bulk<br />
150<br />
6,000 ft<br />
unit<br />
auto<br />
6,500 ft<br />
carload<br />
500 ft<br />
commuter<br />
passenger<br />
1,000 ft<br />
intercity<br />
passenger Total<br />
Year 2010 Alternative 1a<br />
Devore Rd. - West Colton<br />
(Palmdale <strong>Line</strong>)<br />
16.3 0 6.3 0 11.2 0 0 33.8<br />
Indio - Garnet 0 35.9 0 6.2 17.4 0 2 61.5<br />
Garnet - Colton Crossing 0 35.9 0 6.2 17.4 2 2 63.5<br />
Colton Crossing - West Colton 0 23.2 0 1.6 17.4 2 2 46.2<br />
West Colton – Pomona<br />
(Alhambra <strong>Line</strong>)<br />
16.3 35.9 6.3 1.6 13.6 2 2 77.7<br />
Pomona - City of Industry<br />
0 5.1 0 0 5.9 2 2 15.0<br />
(Alhambra <strong>Line</strong>)<br />
City of Industry - El Monte 0 5.1 0 0 3.9 2 2 13.0<br />
El Monte - Yuma Jct. 0 5.1 0 0 3.9 0 0 9.0<br />
Yuma Jct. - Pasadena Jct. 0 0 0 0 0 0 0 0.0<br />
Pasadena Jct. – Ninth Street 0 0 5.1 0 0 22 0 27.1<br />
West Riverside - Mira Loma 0 0 0 4.6 4.6 22 0 31.2<br />
Mira Loma - Pomona 0 0 0 0 4.6 22 0 26.6<br />
Pomona - East Los Angeles<br />
(San Gabriel <strong>Line</strong>)<br />
16.3 30.8 6.3 1.6 12.3 22 0 89.3<br />
East Los Angeles – Ninth Street 13.7 28.2 6.3 0.7 4 22 0 74.9
Table B-8. Peak-Day Train Counts on UP <strong>Line</strong>s, Routing Alternative 1a in 2025<br />
8,000 ft<br />
intermodal<br />
6,000 ft<br />
intermodal<br />
5,000 ft<br />
unit<br />
bulk<br />
151<br />
6,000 ft<br />
unit<br />
auto<br />
6,500 ft<br />
carload<br />
500 ft<br />
commuter<br />
passenger<br />
1,000 ft<br />
intercity<br />
passenger Total<br />
Year 2025 Alternative 1a<br />
Devore Rd. - West Colton<br />
(Palmdale <strong>Line</strong>)<br />
27.5 0 7.3 0 13.1 0 0 47.9<br />
Indio - Garnet 0 59.6 0 7.3 20.2 0 2 89.1<br />
Garnet - Colton Crossing 0 59.6 0 7.3 20.2 6 2 95.1<br />
Colton Crossing - West Colton 0 38.5 0 1.9 20.2 6 2 68.6<br />
West Colton – Pomona<br />
(Alhambra <strong>Line</strong>)<br />
27.5 59.6 7.3 1.9 14.9 6 2 119.2<br />
Pomona - City of Industry<br />
0 6.4 0 0 6.6 6 2 21.0<br />
(Alhambra <strong>Line</strong>)<br />
City of Industry - El Monte 0 6.4 0 0 4.6 6 2 19.0<br />
El Monte - Yuma Jct. 0 6.4 0 0 4.6 0 0 11.0<br />
Yuma Jct. - Pasadena Jct. 0 0 0 0 0 0 0 0.0<br />
Pasadena Jct. – Ninth Street 0 0 5.9 0 0 36 0 41.9<br />
West Riverside - Mira Loma 0 0 0 5.4 5.4 36 0 46.8<br />
Mira Loma - Pomona 0 0 0 0 5.4 36 0 41.4<br />
Pomona - East Los Angeles<br />
(San Gabriel <strong>Line</strong>)<br />
27.5 53.2 7.3 1.9 13.7 36 0 139.6<br />
East Los Angeles – Ninth Street 24.3 50 7.3 0.8 4 36 0 122.4
Table B-9. Peak-Day Train Counts on UP <strong>Line</strong>s, Routing Alternative 1b in 2010<br />
8,000 ft<br />
intermodal<br />
6,000 ft<br />
intermodal<br />
5,000 ft<br />
unit<br />
bulk<br />
152<br />
6,000 ft<br />
unit<br />
auto<br />
6,500 ft<br />
carload<br />
500 ft<br />
commuter<br />
passenger<br />
1,000 ft<br />
intercity<br />
passenger Total<br />
Year 2010 Alternative 1b<br />
Devore Rd. - West Colton<br />
(Palmdale <strong>Line</strong>)<br />
16.3 0 6.3 0 11.2 0 0 33.8<br />
Indio - Garnet 0 35.9 0 6.2 17.4 0 2 61.5<br />
Garnet - Colton Crossing 0 35.9 0 6.2 17.4 2 2 63.5<br />
Colton Crossing - West Colton 0 23.2 0 1.6 17.4 2 2 46.2<br />
West Colton – Pomona<br />
(Alhambra <strong>Line</strong>)<br />
16.3 35.9 6.3 1.6 13.6 2 2 77.7<br />
Pomona - City of Industry<br />
0 5.1 0 0 5.9 24 2 37.0<br />
(Alhambra <strong>Line</strong>)<br />
City of Industry - El Monte 0 5.1 0 0 3.9 24 2 35.0<br />
El Monte - Yuma Jct. 0 5.1 0 0 3.9 20 0 29.0<br />
Yuma Jct. - Pasadena Jct. 0 0 0 0 0 0 0 0.0<br />
Pasadena Jct. – Ninth Street 0 0 5.1 0 0 0 0 5.1<br />
West Riverside - Mira Loma 0 0 0 4.6 4.6 22 0 31.2<br />
Mira Loma - Pomona 0 0 0 0 4.6 22 0 26.6<br />
Pomona - East Los Angeles<br />
(San Gabriel <strong>Line</strong>)<br />
16.3 30.8 6.3 1.6 12.3 0 0 67.3<br />
East Los Angeles – Ninth Street 13.7 28.2 6.3 0.7 4 0 0 52.9
Table B-10. Peak-Day Train Counts on UP <strong>Line</strong>s, Routing Alternative 1b in 2025<br />
8,000 ft<br />
intermodal<br />
6,000 ft<br />
intermodal<br />
5,000 ft<br />
unit<br />
bulk<br />
153<br />
6,000 ft<br />
unit<br />
auto<br />
6,500 ft<br />
carload<br />
500 ft<br />
commuter<br />
passenger<br />
1,000 ft<br />
intercity<br />
passenger Total<br />
Year 2025 Alternative 1b<br />
Devore Rd. - West Colton<br />
(Palmdale <strong>Line</strong>)<br />
27.5 0 7.3 0 13.1 0 0 47.9<br />
Indio - Garnet 0 59.6 0 7.3 20.2 0 2 89.1<br />
Garnet - Colton Crossing 0 59.6 0 7.3 20.2 6 2 95.1<br />
Colton Crossing - West Colton 0 38.5 0 1.9 20.2 6 2 68.6<br />
West Colton – Pomona<br />
(Alhambra <strong>Line</strong>)<br />
27.5 59.6 7.3 1.9 14.9 6 2 119.2<br />
Pomona - City of Industry<br />
0 6.4 0 0 6.6 42 2 57.0<br />
(Alhambra <strong>Line</strong>)<br />
City of Industry - El Monte 0 6.4 0 0 4.6 42 2 55.0<br />
El Monte - Yuma Jct. 0 6.4 0 0 4.6 34 0 45.0<br />
Yuma Jct. - Pasadena Jct. 0 0 0 0 0 0 0 0.0<br />
Pasadena Jct. – Ninth Street 0 0 5.9 0 0 0 0 5.9<br />
West Riverside - Mira Loma 0 0 0 5.4 5.4 36 0 46.8<br />
Mira Loma - Pomona 0 0 0 0 5.4 36 0 41.4<br />
Pomona - East Los Angeles<br />
(San Gabriel <strong>Line</strong>)<br />
27.5 53.2 7.3 1.9 13.7 0 0 103.6<br />
East Los Angeles – Ninth Street 24.3 50 7.3 0.8 4 0 0 86.4
Table B-11. Peak-Day Train Counts on UP <strong>Line</strong>s, Routing Alternative 2 in 2010<br />
8,000 ft<br />
intermodal<br />
6,000 ft<br />
intermodal<br />
5,000 ft<br />
unit<br />
bulk<br />
154<br />
6,000 ft<br />
unit<br />
auto<br />
6,500 ft<br />
carload<br />
500 ft<br />
commuter<br />
passenger<br />
1,000 ft<br />
intercity<br />
passenger Total<br />
Year 2010 Alternative 2<br />
Devore Rd. - West Colton<br />
(Palmdale <strong>Line</strong>)<br />
16.3 0 6.3 0 11.2 0 0 33.8<br />
Indio - Garnet 0 35.9 0 6.2 17.4 0 2 61.5<br />
Garnet - Colton Crossing 0 35.9 0 6.2 17.4 2 2 63.5<br />
Colton Crossing - West Colton 0 23.2 0 1.6 17.4 2 2 46.2<br />
West Colton – Pomona<br />
(Alhambra <strong>Line</strong>)<br />
16.3 33.3 6.3 1.6 13.6 2 2 75.1<br />
Pomona - City of Industry<br />
13.7 33.3 6.3 0.7 9.9 2 2 67.9<br />
(Alhambra <strong>Line</strong>)<br />
City of Industry - El Monte 13.7 33.3 6.3 0.7 7.9 2 2 65.9<br />
El Monte - Yuma Jct. 13.7 33.3 6.3 0.7 7.9 0 0 61.9<br />
Yuma Jct. - Pasadena Jct. 13.7 28.2 6.3 0.7 4 0 0 52.9<br />
Pasadena Jct. – Ninth Street 13.7 28.2 11.4 0.7 4 22 0 80.0<br />
West Riverside - Mira Loma 0 0 0 4.6 4.6 22 0 31.2<br />
Mira Loma - Pomona 0 0 0 0 4.6 22 0 26.6<br />
Pomona - East Los Angeles<br />
(San Gabriel <strong>Line</strong>)<br />
2.6 2.6 0 0.9 8.3 22 0 36.4<br />
East Los Angeles – Ninth Street 0 0 0 0 0 22 0 22.0
Table B-12. Peak-Day Train Counts on UP <strong>Line</strong>s, Routing Alternative 2 in 2025<br />
8,000 ft<br />
intermodal<br />
6,000 ft<br />
intermodal<br />
5,000 ft<br />
unit<br />
bulk<br />
155<br />
6,000 ft<br />
unit<br />
auto<br />
6,500 ft<br />
carload<br />
500 ft<br />
commuter<br />
passenger<br />
1,000 ft<br />
intercity<br />
passenger Total<br />
Year 2025 Alternative 2<br />
Devore Rd. - West Colton<br />
(Palmdale <strong>Line</strong>)<br />
27.5 0 7.3 0 13.1 0 0 47.9<br />
Indio - Garnet 0 59.6 0 7.3 20.2 0 2 89.1<br />
Garnet - Colton Crossing 0 59.6 0 7.3 20.2 6 2 95.1<br />
Colton Crossing - West Colton 0 38.5 0 1.9 20.2 6 2 68.6<br />
West Colton – Pomona<br />
(Alhambra <strong>Line</strong>)<br />
27.5 59.6 7.3 1.9 14.9 6 2 119.2<br />
Pomona - City of Industry<br />
24.3 56.4 7.3 0.8 10.6 6 2 107.4<br />
(Alhambra <strong>Line</strong>)<br />
City of Industry - El Monte 24.3 56.4 7.3 0.8 8.6 6 2 105.4<br />
El Monte - Yuma Jct. 24.3 56.4 7.3 0.8 8.6 0 0 97.4<br />
Yuma Jct. - Pasadena Jct. 24.3 50 7.3 0.8 4 0 0 86.4<br />
Pasadena Jct. – Ninth Street 24.3 50 13.2 0.8 4 36 0 128.3<br />
West Riverside - Mira Loma 0 0 0 5.4 5.4 36 0 46.8<br />
Mira Loma - Pomona 0 0 0 0 5.4 36 0 41.4<br />
Pomona - East Los Angeles<br />
(San Gabriel <strong>Line</strong>)<br />
3.2 3.2 0 1.1 9.7 36 0 53.2<br />
East Los Angeles – Ninth Street 0 0 0 0 0 36 0 36.0
Table B-13. Locomotive Consists for Various Types of Trains Assumed in Train Dispatching Simulations and Emissions<br />
Analysis<br />
Train Type Locomotive Consist<br />
Long-distance passenger train (1,000ft) 2 4,000HP B-B locomotive units<br />
Commuter passenger train (500ft) 1 4,000HP B-B locomotive unit<br />
BNSF freight trains<br />
3 4,400 HP C-C locomotive units, plus 2 3,000 HP C-C locomotive units<br />
Alameda Corridor - Barstow Carload<br />
as pusher San Bernardino - Victorville<br />
3 4,400 HP C-C locomotive units, plus 2 3,000 HP C-C locomotive units<br />
Hobart - Barstow Carload<br />
as pusher San Bernardino - Victorville<br />
3 4,400 HP C-C locomotive units, plus 2 3,000 HP C-C locomotive units<br />
San Diego - Atwood - Barstow Carload as pusher San Bernardino - Victorville<br />
3 4,400 HP C-C locomotive units, plus 2 3,000 HP C-C locomotive units<br />
Fontana - San Bernardino - Barstow Carload as pusher San Bernardino - Victorville<br />
4 4,400 HP C-C locomotive units, plus 2 3,000 HP C-C locomotive units<br />
Alameda Corridor - Barstow Unit Bulk as pusher San Bernardino - Victorville<br />
4 4,400 HP C-C locomotive units, plus 2 3,000 HP C-C locomotive units<br />
San Diego - Atwood - Barstow Unit Bulk<br />
as pusher San Bernardino - Victorville<br />
Alameda Corridor - Barstow 8,000ft Intermodal<br />
4 4,400 HP C-C locomotive units, plus 2 3,000 HP C-C locomotive units<br />
as pusher San Bernardino - Victorville<br />
Alameda Corridor - Barstow 6,000ft Intermodal 4 4,400 HP C-C locomotive units<br />
Hobart - Barstow 6,000ft Intermodal 4 4,400 HP C-C locomotive units<br />
San Bernardino - Barstow 6,000ft Intermodal 4 4,400 HP C-C locomotive units<br />
Alameda Corridor - Barstow Unit Auto 4 4,400 HP C-C locomotive units<br />
Hobart - Barstow Unit Auto 4 4,400 HP C-C locomotive units<br />
San Diego - Atwood - Barstow Unit Auto 4 4,400 HP C-C locomotive units<br />
San Bernardino - Barstow Unit Auto<br />
UP freight trains<br />
4 4,400 HP C-C locomotive units<br />
LATC - Indio 6,000ft Intermodal 4 4,400 HP C-C locomotive units<br />
156
East LA - Indio 6,000ft Intermodal 4 4,400 HP C-C locomotive units<br />
Alameda Corridor - Indio 6,000ft Intermodal 4 4,400 HP C-C locomotive units<br />
4 4,400 HP C-C locomotive units, plus 2 3,000 HP C-C locomotive units<br />
Alameda Corridor - Barstow 8,000ft Intermodal as pusher San Bernardino - Victorville<br />
4 4,400 HP C-C locomotive units, plus 2 3,000 HP C-C locomotive units<br />
East LA - Barstow 8,000ft Intermodal as pusher San Bernardino - Victorville<br />
Alameda Corridor - Indio Unit Auto 4 4,400 HP C-C locomotive units<br />
East LA - Indio Unit Auto 4 4,400 HP C-C locomotive units<br />
Mira Loma - Indio Unit Auto 4 4,400 HP C-C locomotive units<br />
4 4,400 HP C-C locomotive units, plus 2 3,000 HP C-C locomotive units<br />
Alameda Corridor - Barstow Unit Bulk as pusher San Bernardino - Victorville<br />
Alameda Corridor - Glendale <strong>Line</strong> Unit Bulk 4 4,400 HP C-C locomotive units<br />
Alameda Corridor - West Colton Carload 2 4,400 HP C-C locomotive units<br />
3 4,400 HP C-C locomotive units, plus 2 3,000 HP C-C locomotive units<br />
East LA - Barstow Carload w/stop at Montclair as pusher San Bernardino - Victorville<br />
3 4,400 HP C-C locomotive units, plus 2 3,000 HP C-C locomotive units<br />
East LA - Barstow Carload non-stop<br />
as pusher San Bernardino - Victorville<br />
Glendale <strong>Line</strong> - West Colton Carload 2 4,400 HP C-C locomotive units<br />
City of Industry - West Colton Carload 2 4,400 HP C-C locomotive units<br />
3 4,400 HP C-C locomotive units, plus 2 3,000 HP C-C locomotive units<br />
West Colton - Palmdale <strong>Line</strong> Carload<br />
as pusher San Bernardino - Victorville<br />
3 4,400 HP C-C locomotive units, plus 2 3,000 HP C-C locomotive units<br />
West Colton - Indio Carload<br />
as pusher Colton - Garnet<br />
157