Evaluation of a standardized physical training program for
Evaluation of a standardized physical training program for
Evaluation of a standardized physical training program for
You also want an ePaper? Increase the reach of your titles
YUMPU automatically turns print PDFs into web optimized ePapers that Google loves.
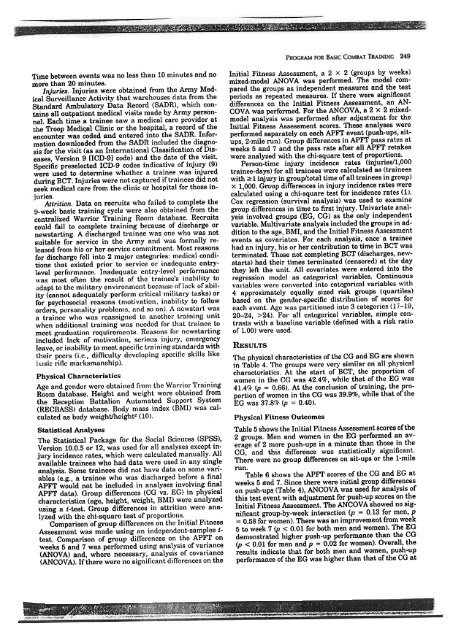
Time between events was no less than 10 minutes and no<br />
more than 20 minutes.<br />
Injuries. Injuries were obtained from the Anny Medical<br />
Surveillance Activity that warehouses data from the<br />
Standard Ambulatory Data Record (SADR), which contains<br />
all outpatient medical visits made by Army personnel.<br />
Each time a trainee saw a medical care provider at<br />
the Troop Medi24). For all categorical variables, simple contrasts<br />
with a baseline variab]e (dcfined with a risk ratio<br />
<strong>of</strong> 1.00) were used.<br />
RESUI..TS<br />
1'he <strong>physical</strong> characteristics <strong>of</strong> the CG and EG are sho\vn<br />
in Table 4. ,!'he groups were very similar on all <strong>physical</strong><br />
characteristics. At the start <strong>of</strong> BCT, the proportion <strong>of</strong><br />
women in the CG was 42.4%, while that <strong>of</strong> the EG \vas<br />
41.4rk (p = 0.66). At the conclusion <strong>of</strong> <strong>training</strong>, the proportion<br />
<strong>of</strong> women in the CG was 39.9%, \vhile that <strong>of</strong> the<br />
EG was 37.8"/c, (p = 0.40).<br />
Physical Fitness Outcomes<br />
Table 5 shows the Initial Fitness Assessment scores <strong>of</strong> the<br />
2 groups. Men and women in the EG per<strong>for</strong>med an average<br />
<strong>of</strong> 2 more push-ups in a minute than those in the<br />
CG, and this difference was statistically significant.<br />
There were no group differences on sit-ups or the 1-mile<br />
run.<br />
Table 6 shows the APFT scores <strong>of</strong> the CG and EG at<br />
weeks 5 and 7. Since there were initial group differences<br />
on push-ups (Table 4), ANCOV A was used <strong>for</strong> analysis <strong>of</strong><br />
this test event with adjustment <strong>for</strong> push-up scores on the<br />
Initial Fitness Assessment. The ANCOVA showed no significant<br />
group-by-week interaction (p = 0.13 <strong>for</strong> men, p<br />
= 0.58 <strong>for</strong> \vomen). There was an improvement from \veek<br />
5 to week 7 (p < 0.01 <strong>for</strong> both men and women). The EG<br />
demonstrated higher push-up per<strong>for</strong>mance than the CG<br />
(p < 0.01 <strong>for</strong> men and p = 0.02 <strong>for</strong> women). Overall, the<br />
results indicate that <strong>for</strong> both men and women, push-up<br />
per<strong>for</strong>mance <strong>of</strong> the EG was higher than that <strong>of</strong> the CG at


